Copyright
©The Author(s) 2025.
World J Hepatol. Oct 27, 2025; 17(10): 110402
Published online Oct 27, 2025. doi: 10.4254/wjh.v17.i10.110402
Published online Oct 27, 2025. doi: 10.4254/wjh.v17.i10.110402
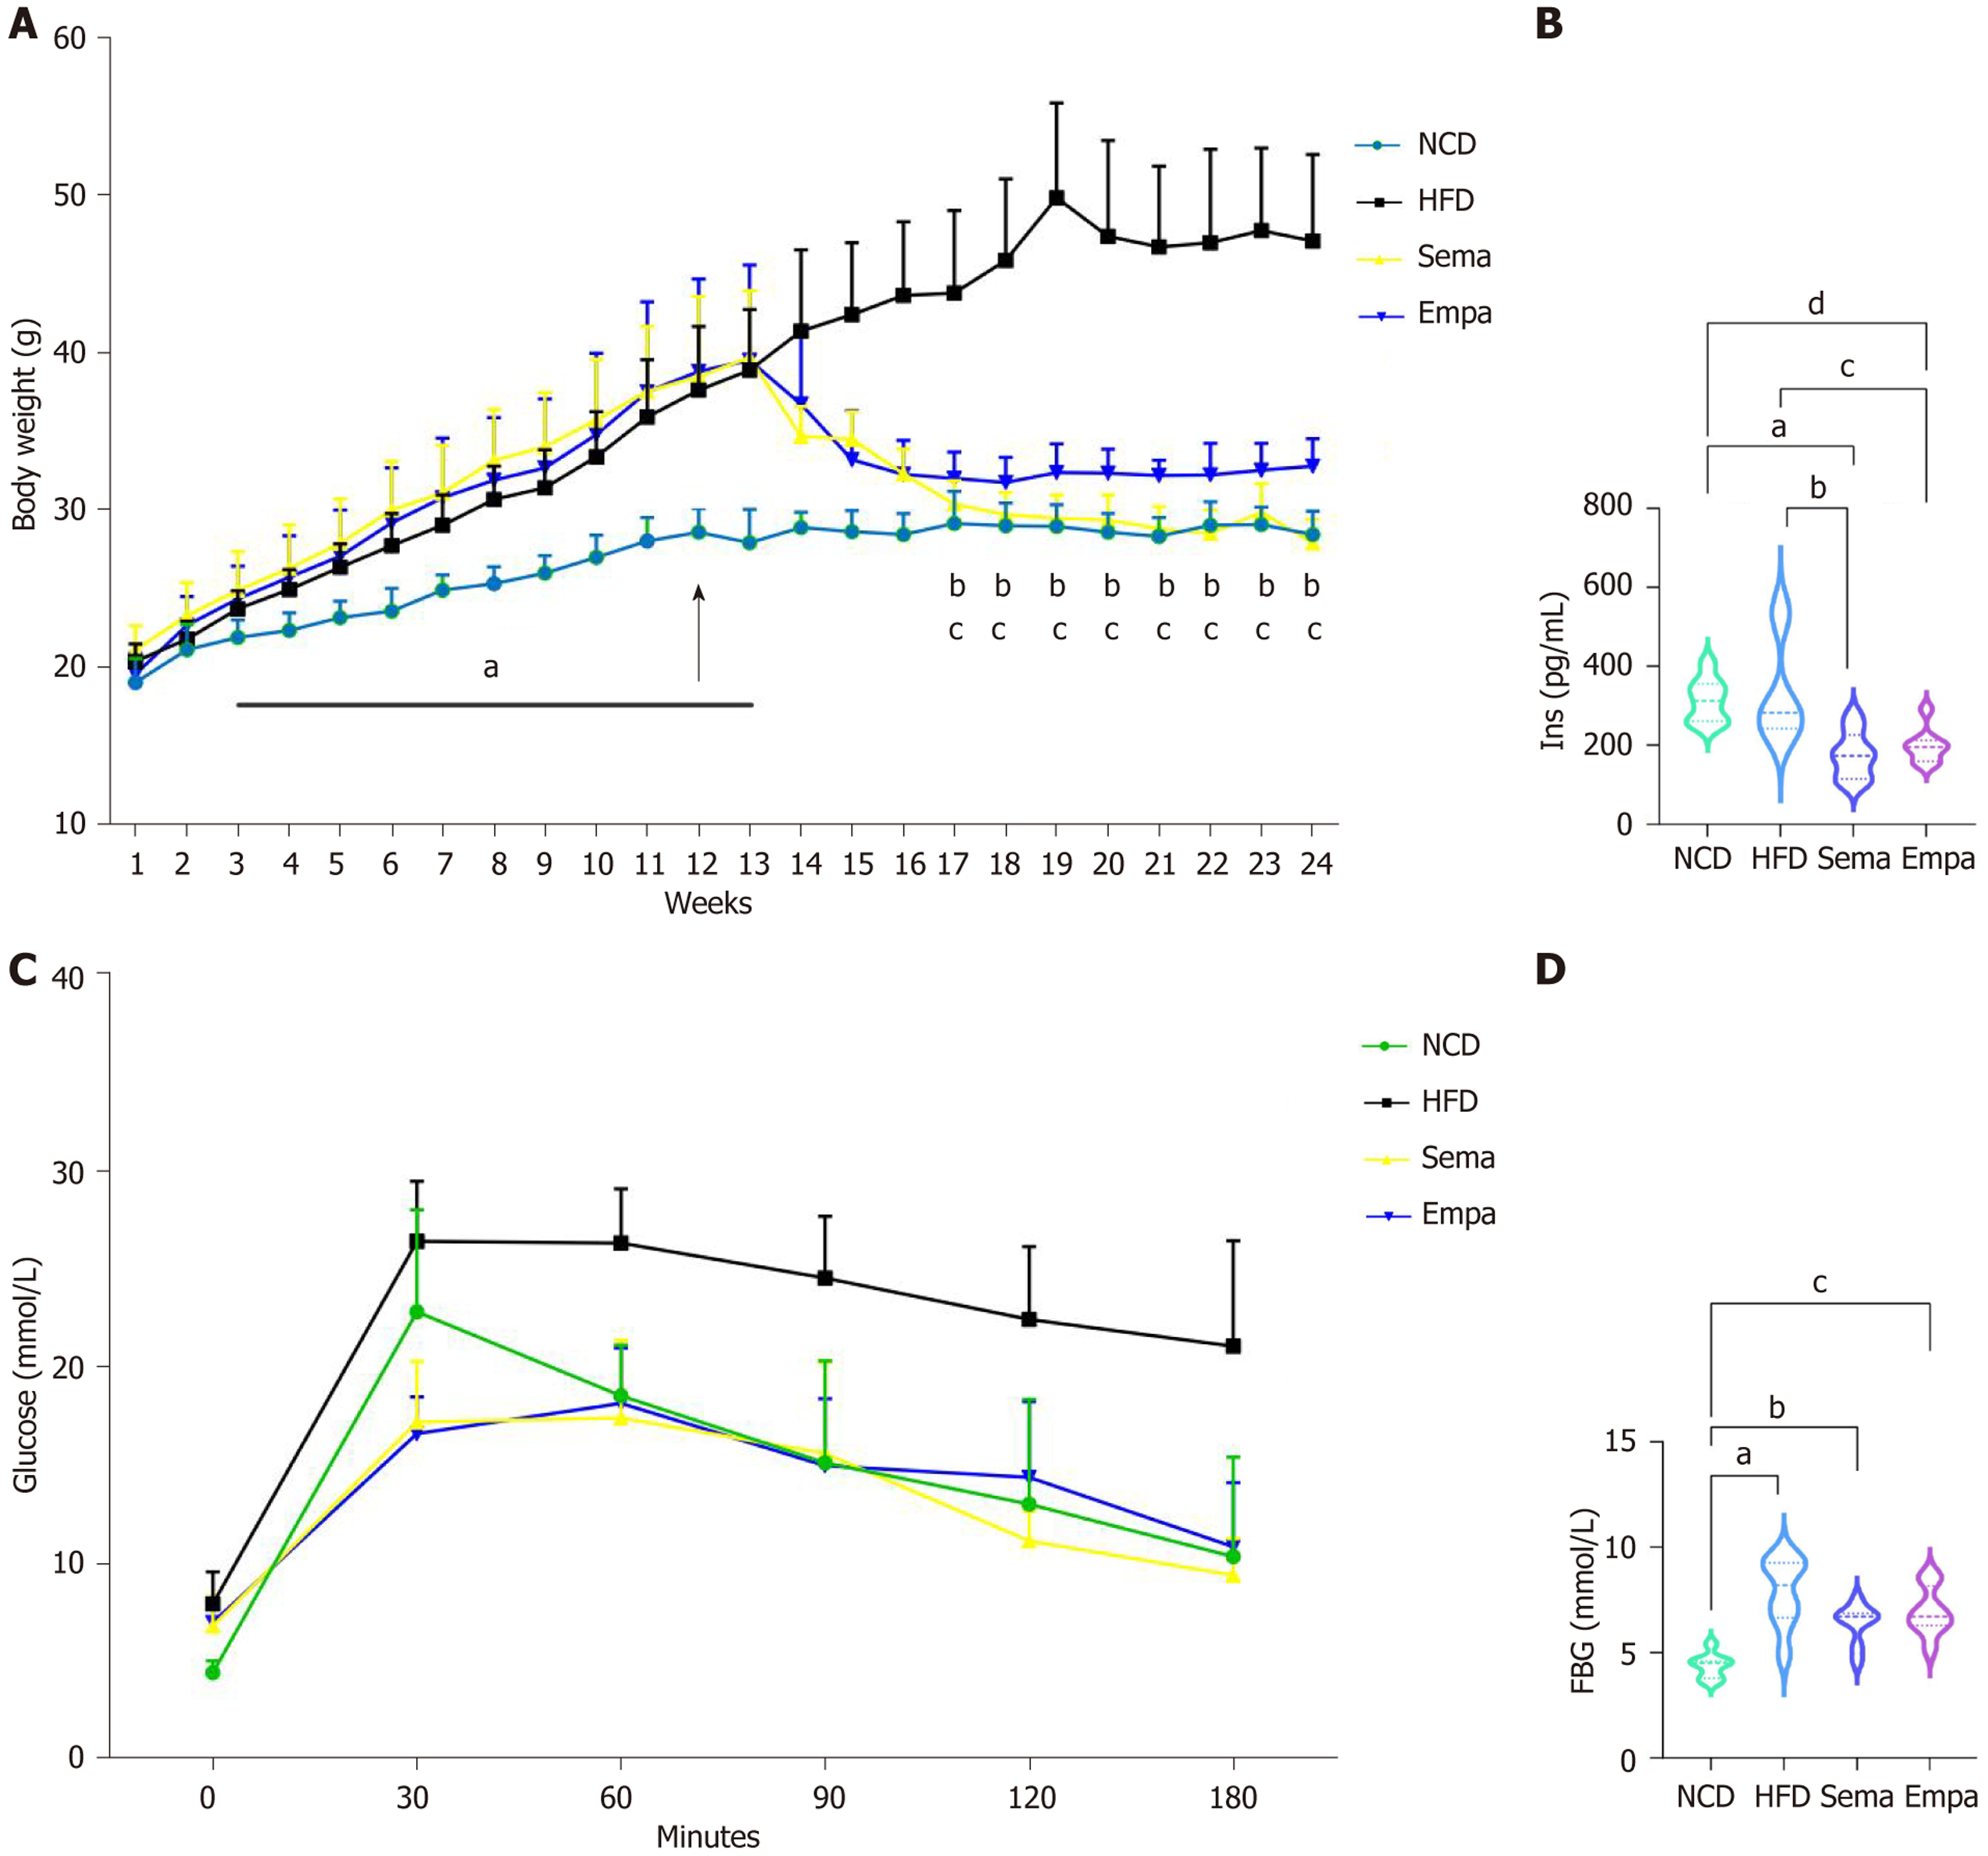
Figure 1 Changes in body weight and glucose metabolism.
A: Folding line graph of body weight change over time for each group of mice (n = 8). The black arrow indicates the point in time when semaglutide and empagliflozin intervened. The aP < 0.01 on the first straight line indicates high-fat group (HFD group) vs control group (NCD group); bP < 0.01 indicates HFD vs Sema; cP < 0.01 indicates HFD vs Empa; B: Comparison of insulin levels in four groups of mice (n = 8). aP < 0.01 indicates NCD vs Sema, bP < 0.01 indicates HFD vs Sema, cP < 0.01 indicates HFD vs Empa, dP < 0.01 indicates NCD vs Empa; C: Intraperitoneal glucose tolerance results. aP < 0.01 indicates HFD vs NCD, Sema and Empa; D: Comparison of fasting blood glucose levels in the four groups of mice (n = 8). aP < 0.01 indicates NCD vs HFD, bP < 0.01 indicates NCD vs Sema, cP < 0.01 indicates NCD vs Empa. FBG: Fasting blood glucose; HFD: A high-fat group; NCD: A control group.
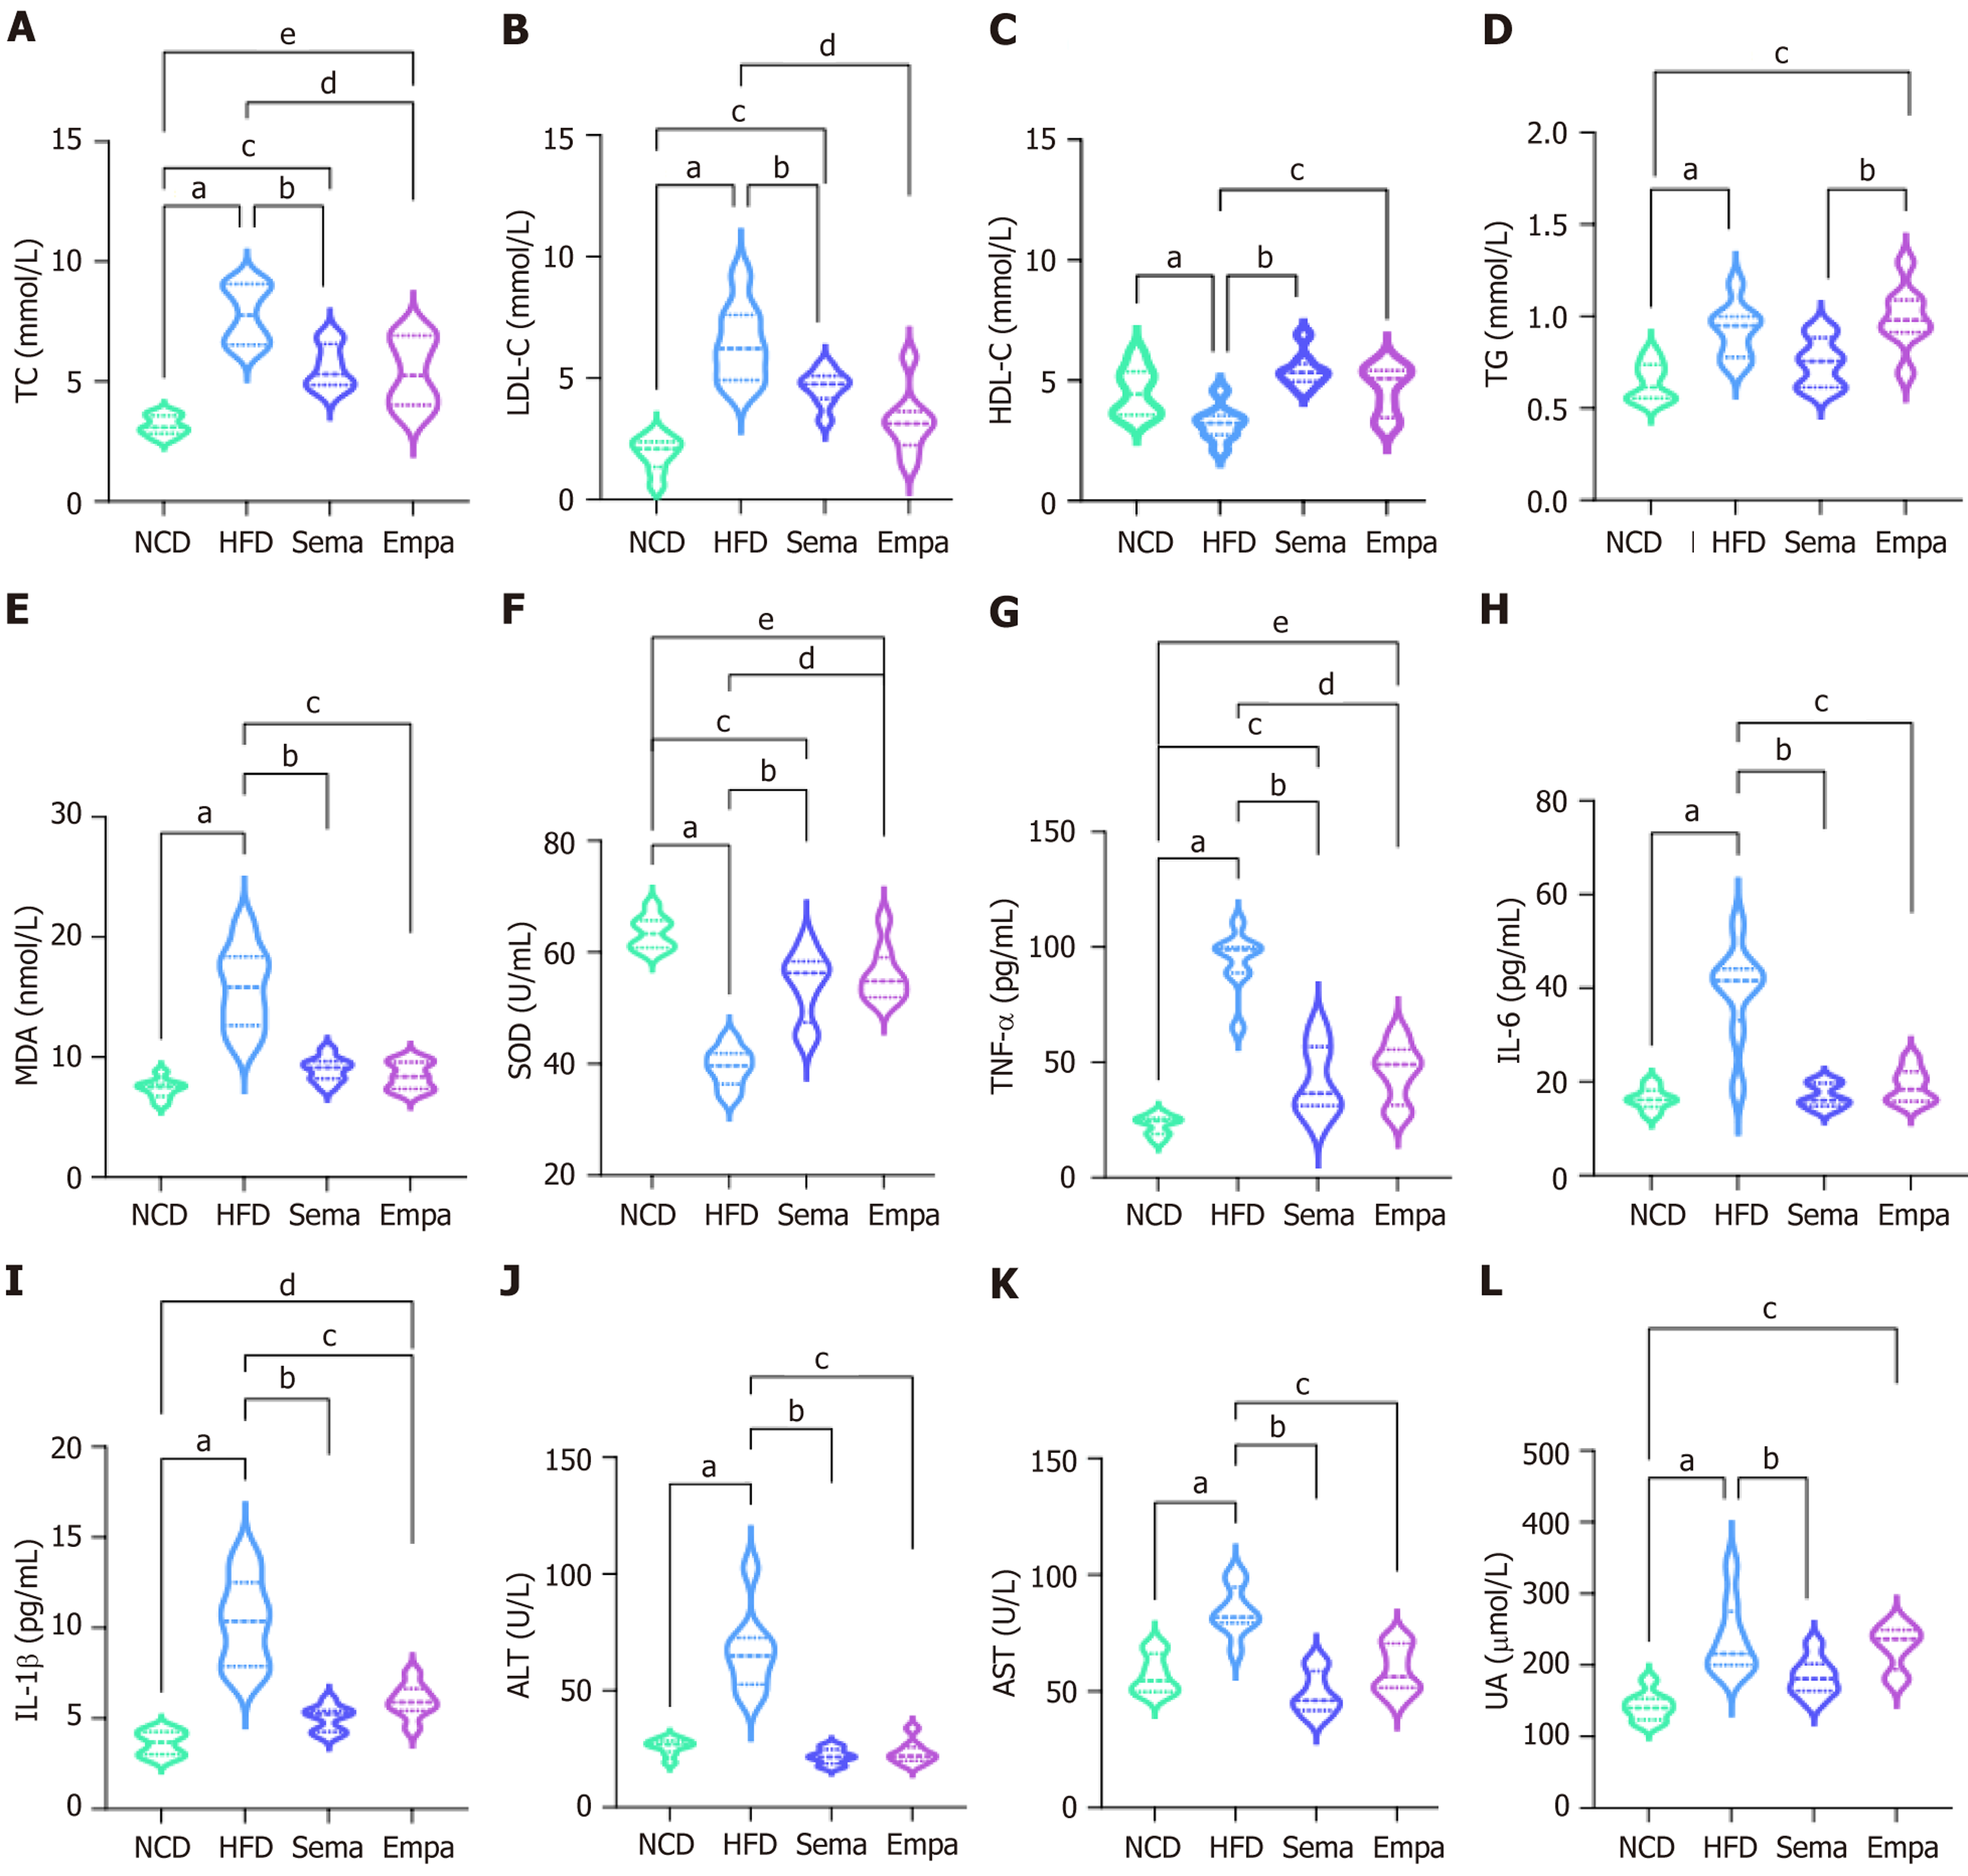
Figure 2 Changes in serological indicators.
A: Total cholesterol. aP < 0.01 indicates high-fat group (HFD group) vs control group (NCD group), bP < 0.01 indicates HFD vs Sema, cP < 0.01 indicates NCD vs Sema, dP < 0.01 indicates HFD vs Empa, eP < 0.01 indicates NCD vs Empa; B: Low-density lipoprotein cholesterol. aP < 0.01 indicates HFD vs NCD, bP < 0.01 indicates HFD vs Sema, cP < 0.01 indicates HFD vs Empa; C: High-density lipoprotein cholesterol. aP < 0.01 indicates HFD vs NCD, bP < 0.01 indicates HFD vs Sema, cP < 0.01 indicates HFD vs Empa; D: Triglycerides. aP < 0.01 indicates HFD vs NCD, bP < 0.01 indicates Sema vs Empa, cP < 0.01 indicates NCD vs Empa; E: Malondialdehyde. aP < 0.01 indicates HFD vs NCD, bP < 0.01 indicates HFD vs Sema, cP < 0.01 indicates HFD vs Empa; F: Superoxide dismutase. aP < 0.01 indicates HFD vs NCD, bP < 0.01 indicates HFD vs Sema, cP < 0.01 indicates NCD vs Sema, dP < 0.01 indicates HFD vs Empa, eP < 0.01 indicates NCD vs Empa; G: Tumour necrosis factor-α. aP < 0.01 indicates HFD vs NCD, bP < 0.01 indicates HFD vs Sema, cP < 0.01 indicates NCD vs Sema, dP < 0.01 HFD vs Empa, eP < 0.01 indicates NCD vs Empa; H: Interleukin (IL)-6; aP < 0.01 indicates HFD vs NCD, bP < 0.01 indicates HFD vs Sema, cP < 0.01 indicates HFD vs Empa; I: IL-1β. aP < 0.01 indicates HFD vs NCD, bP < 0.01 indicates HFD vs Sema, cP < 0.01 indicates HFD vs Empa, dP < 0.01 indicates NCD vs Empa; J: Alanine aminotransferase. aP < 0.01 indicates HFD vs NCD, bP < 0.01 indicates HFD vs Sema, cP < 0.01 HFD vs Empa; K: Aspartate aminotransferase. aP < 0.01 indicates HFD vs NCD, bP < 0.01 indicates HFD vs Sema, cP < 0.01 indicates HFD vs Empa; L: Uric acid. aP < 0.01 indicates HFD vs NCD, bP < 0.01 indicates HFD vs Sema, cP < 0.01 indicates NCD vs Empa; n = 4/group. ALT: Alanine aminotransferase; AST: Aspartate aminotransferase; HDL-C: High-density lipoprotein cholesterol; HFD: A high-fat group; IL: Interleukin; LDL-C: Low-density lipoprotein cholesterol; MDA: Malondialdehyde; NCD: A control group; SOD: Superoxide dismutase; TC: Total cholesterol; TG: Triglycerides; TNF-α: Tumour necrosis factor-α; UA: Uric acid.
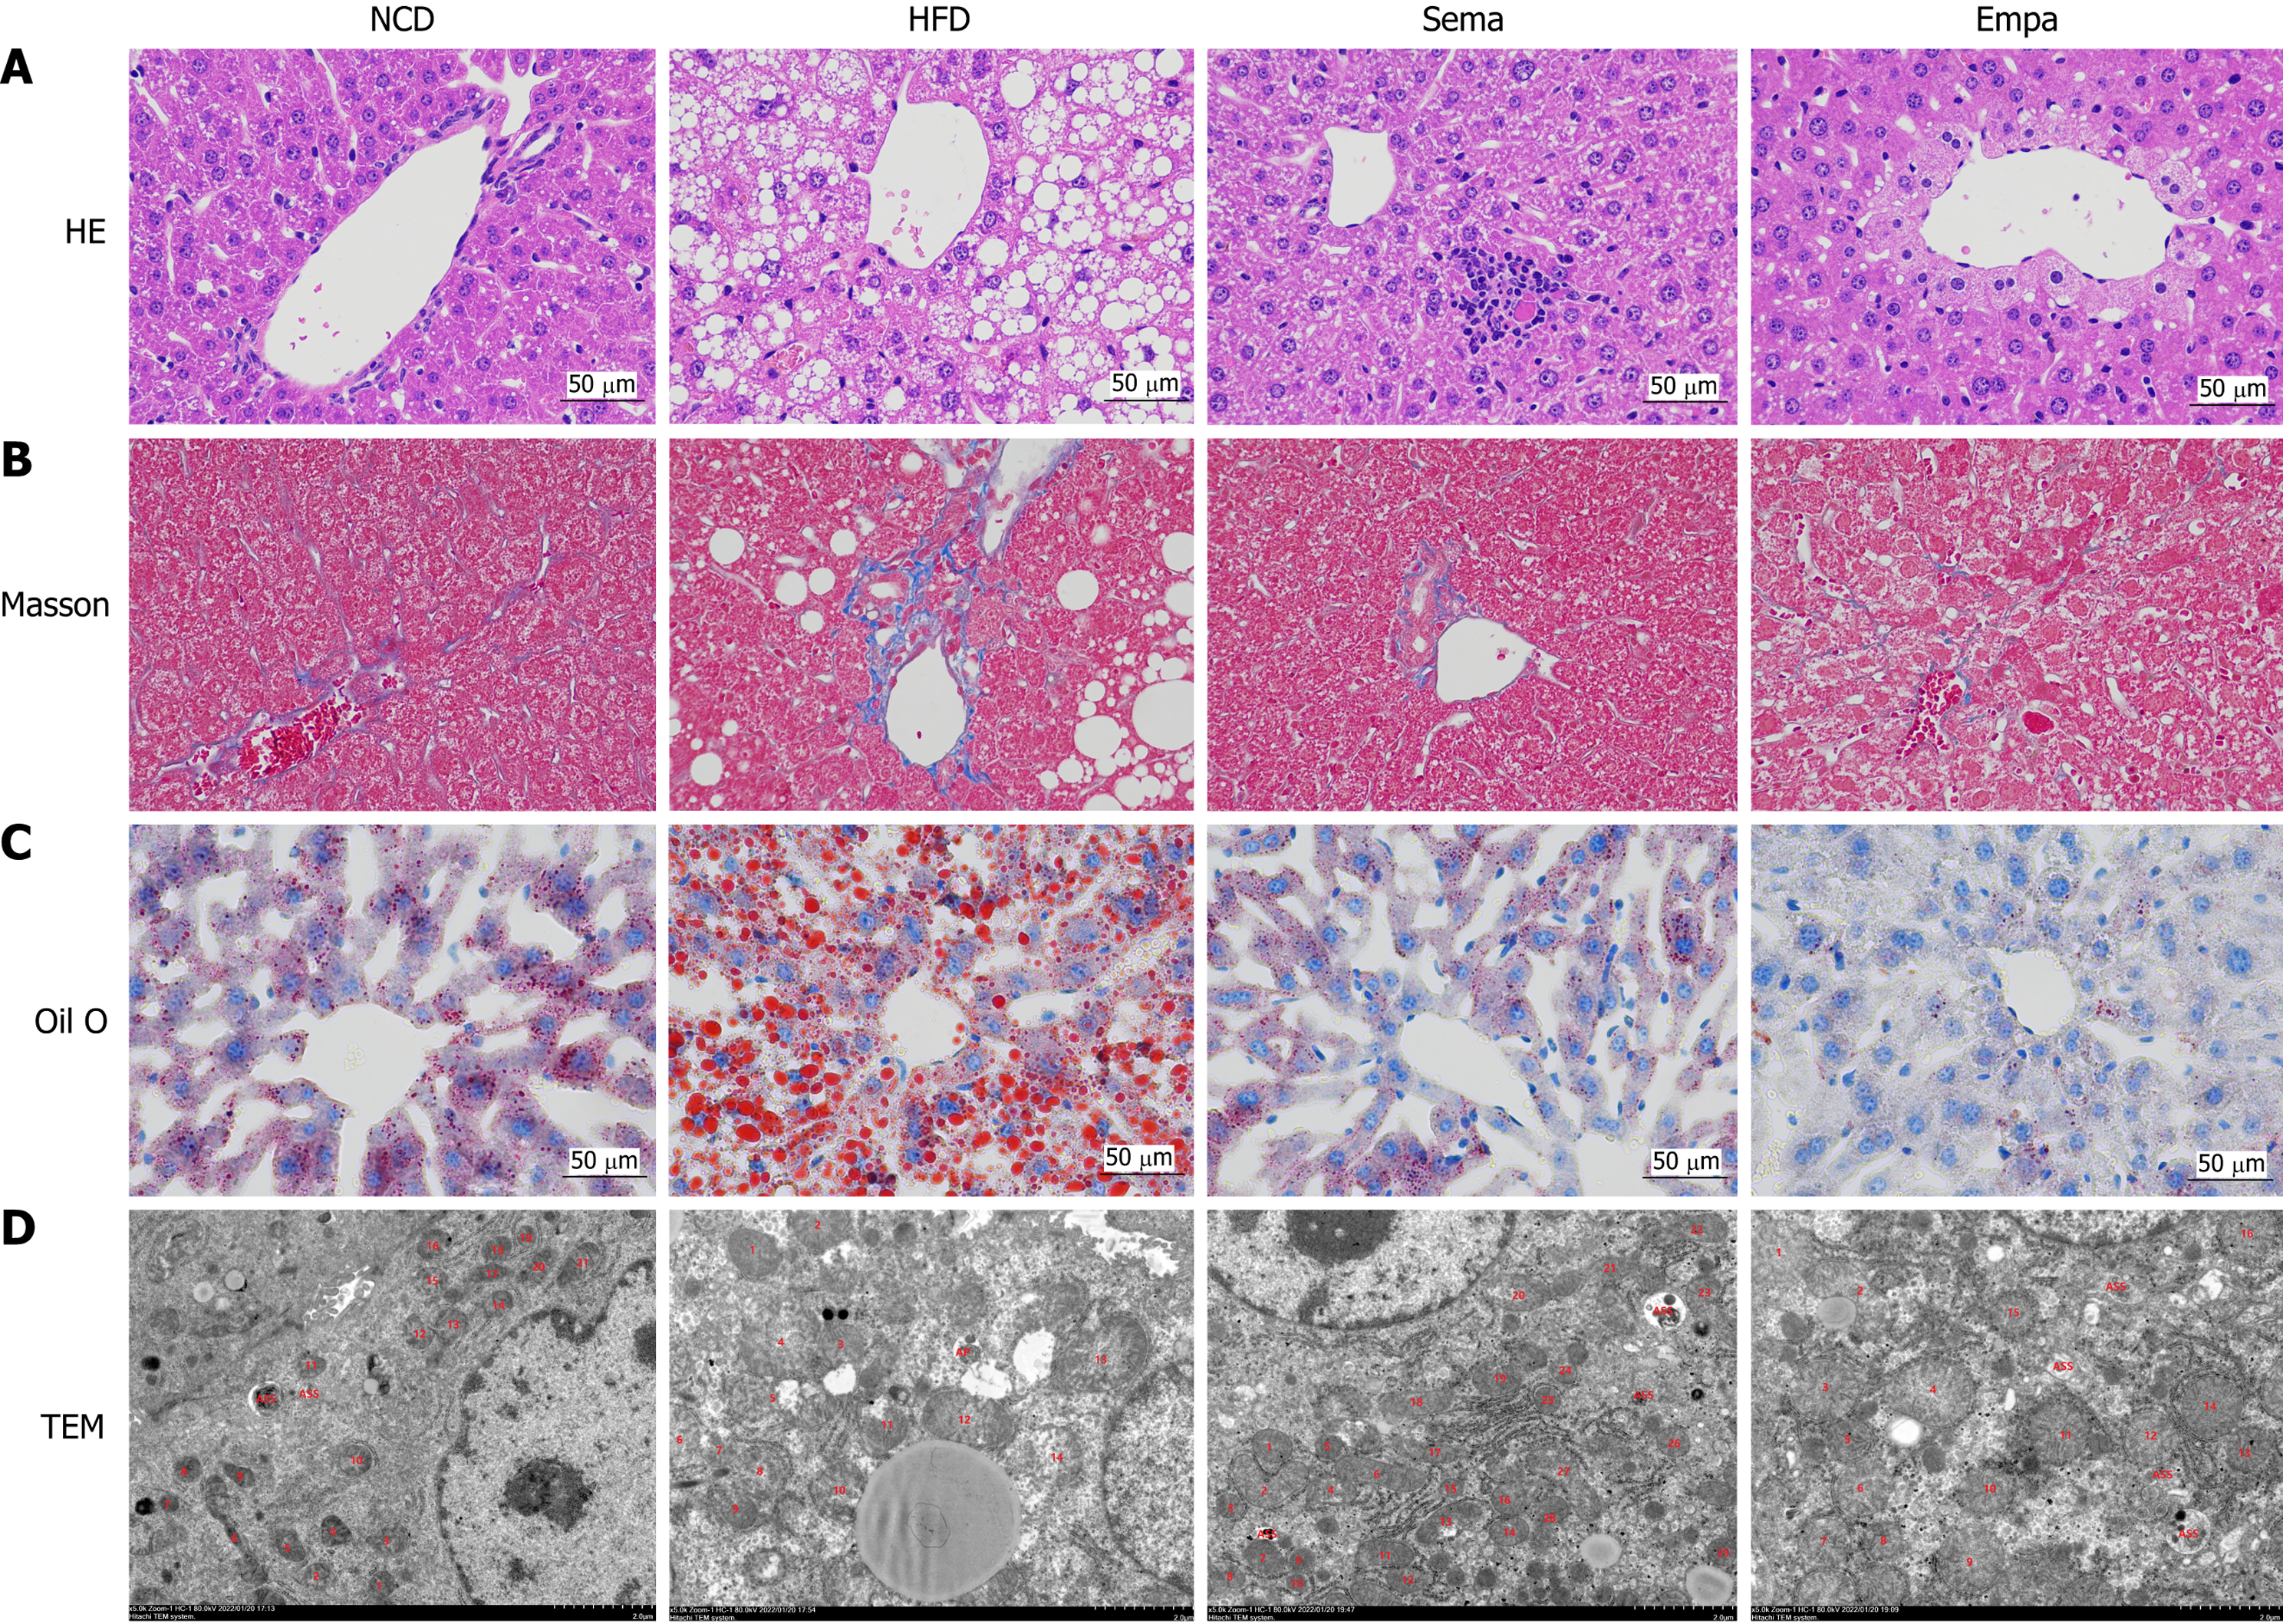
Figure 3 Changes in pathological structures.
A: Hematoxylin-eosin staining (400 ×); B: Masson staining (400 ×); C: Oil red staining (400 ×); D: Transmission electron microscopy images showed the mitochondria, mitochondrial microautophagy structure and ribosomes. HE: Hematoxylin-eosin; HFD: A high-fat group; NCD: A control group; TEM: Transmission electron microscopy.
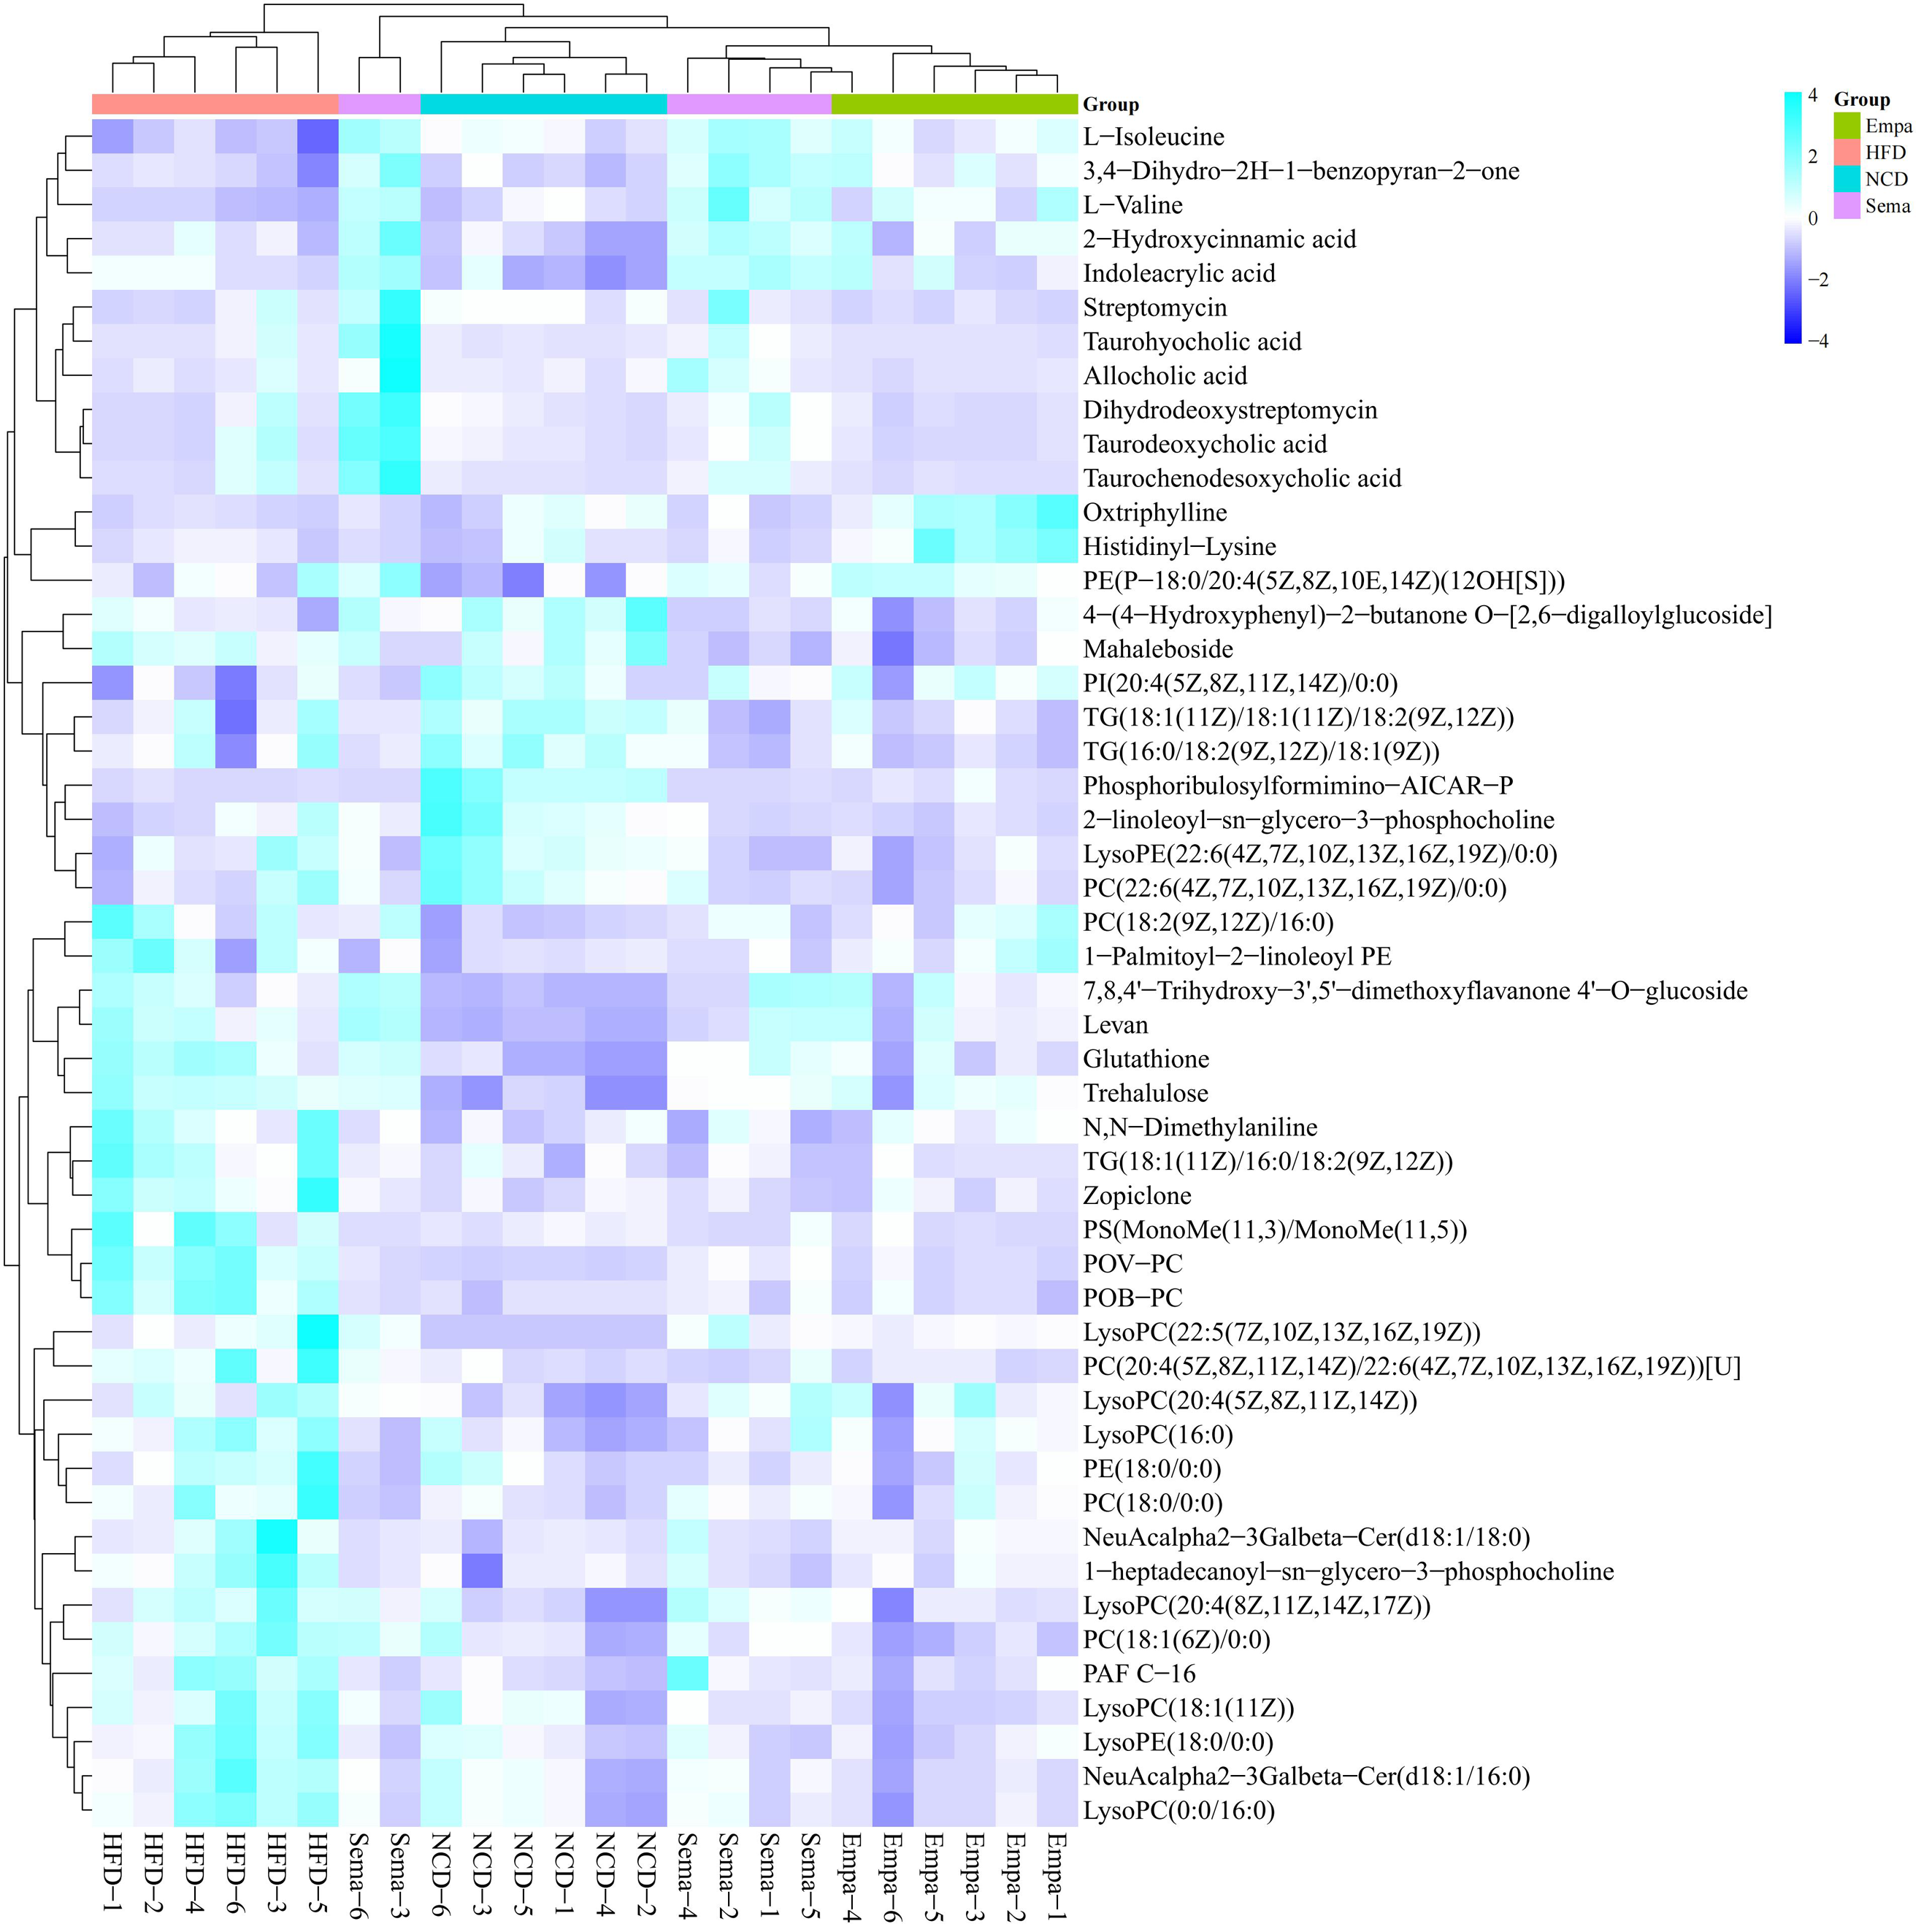
Figure 4 Heatmap of the top 50 difference metabolites.
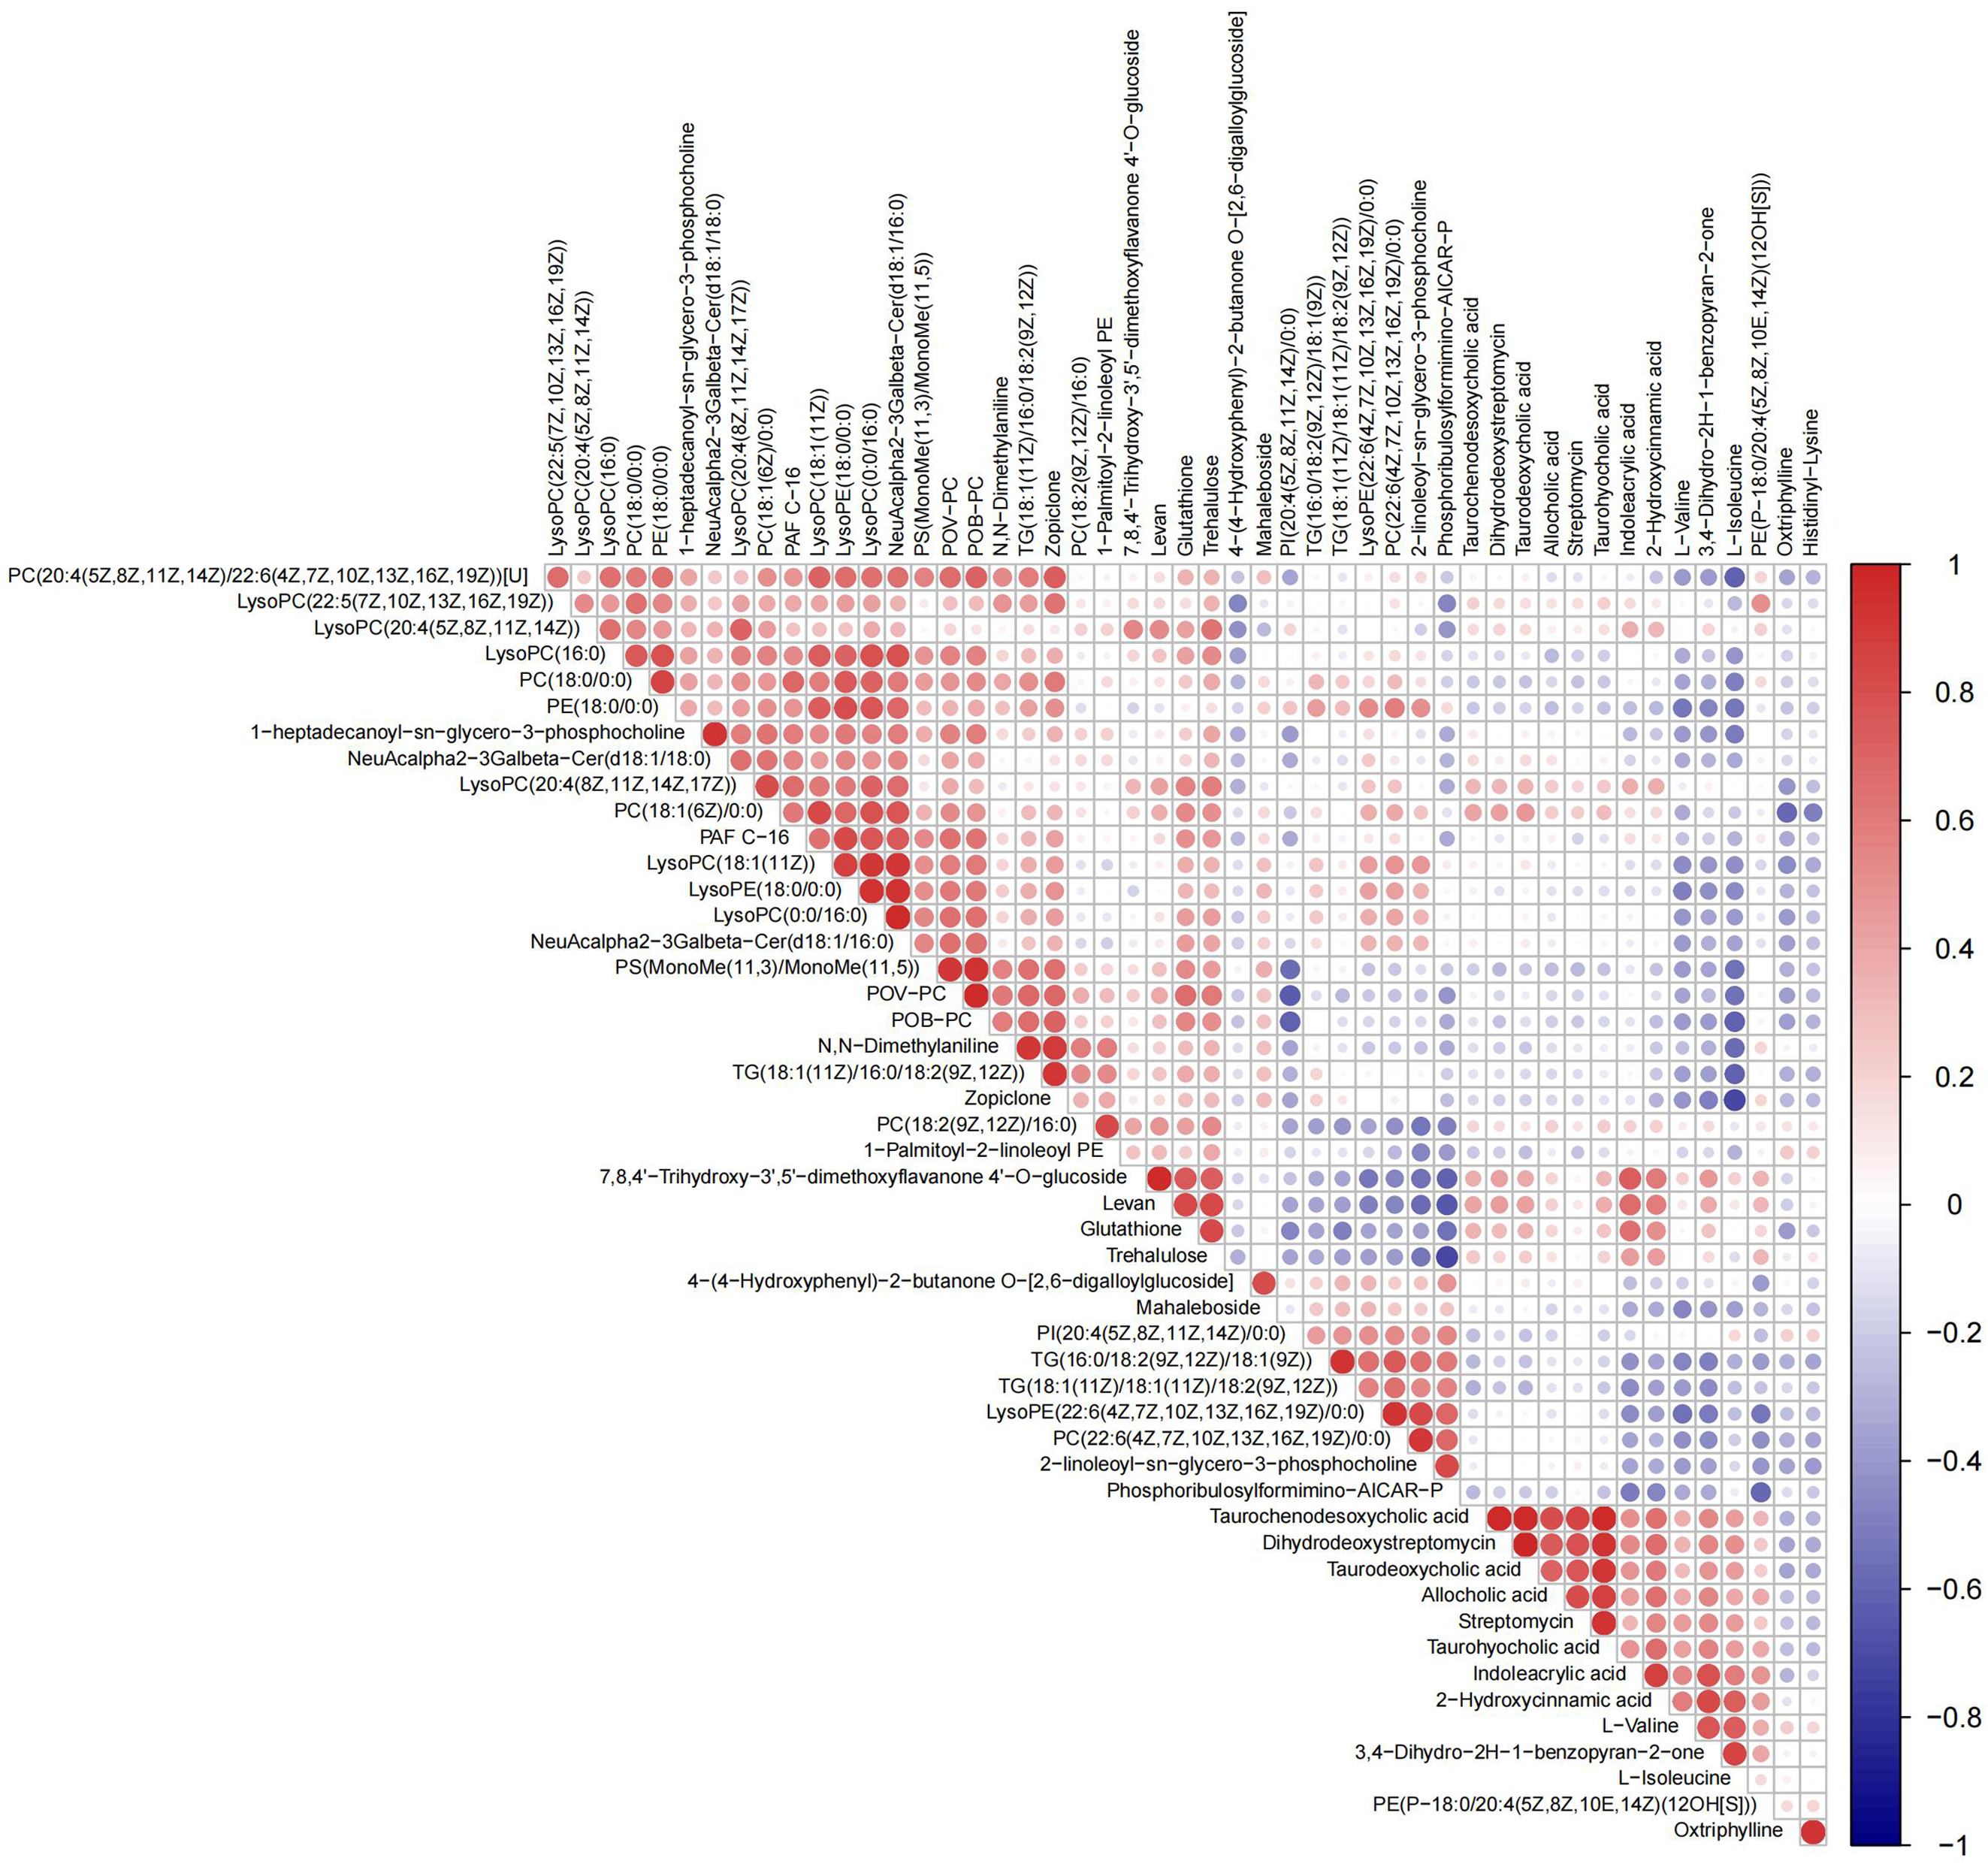
Figure 5 Heatmap pearson correlation analysis for assessing the correlation between different metabolites.
Some metabolites are negatively correlated (blue) and some are positively correlated (red). The darker the colour the stronger the correlation.
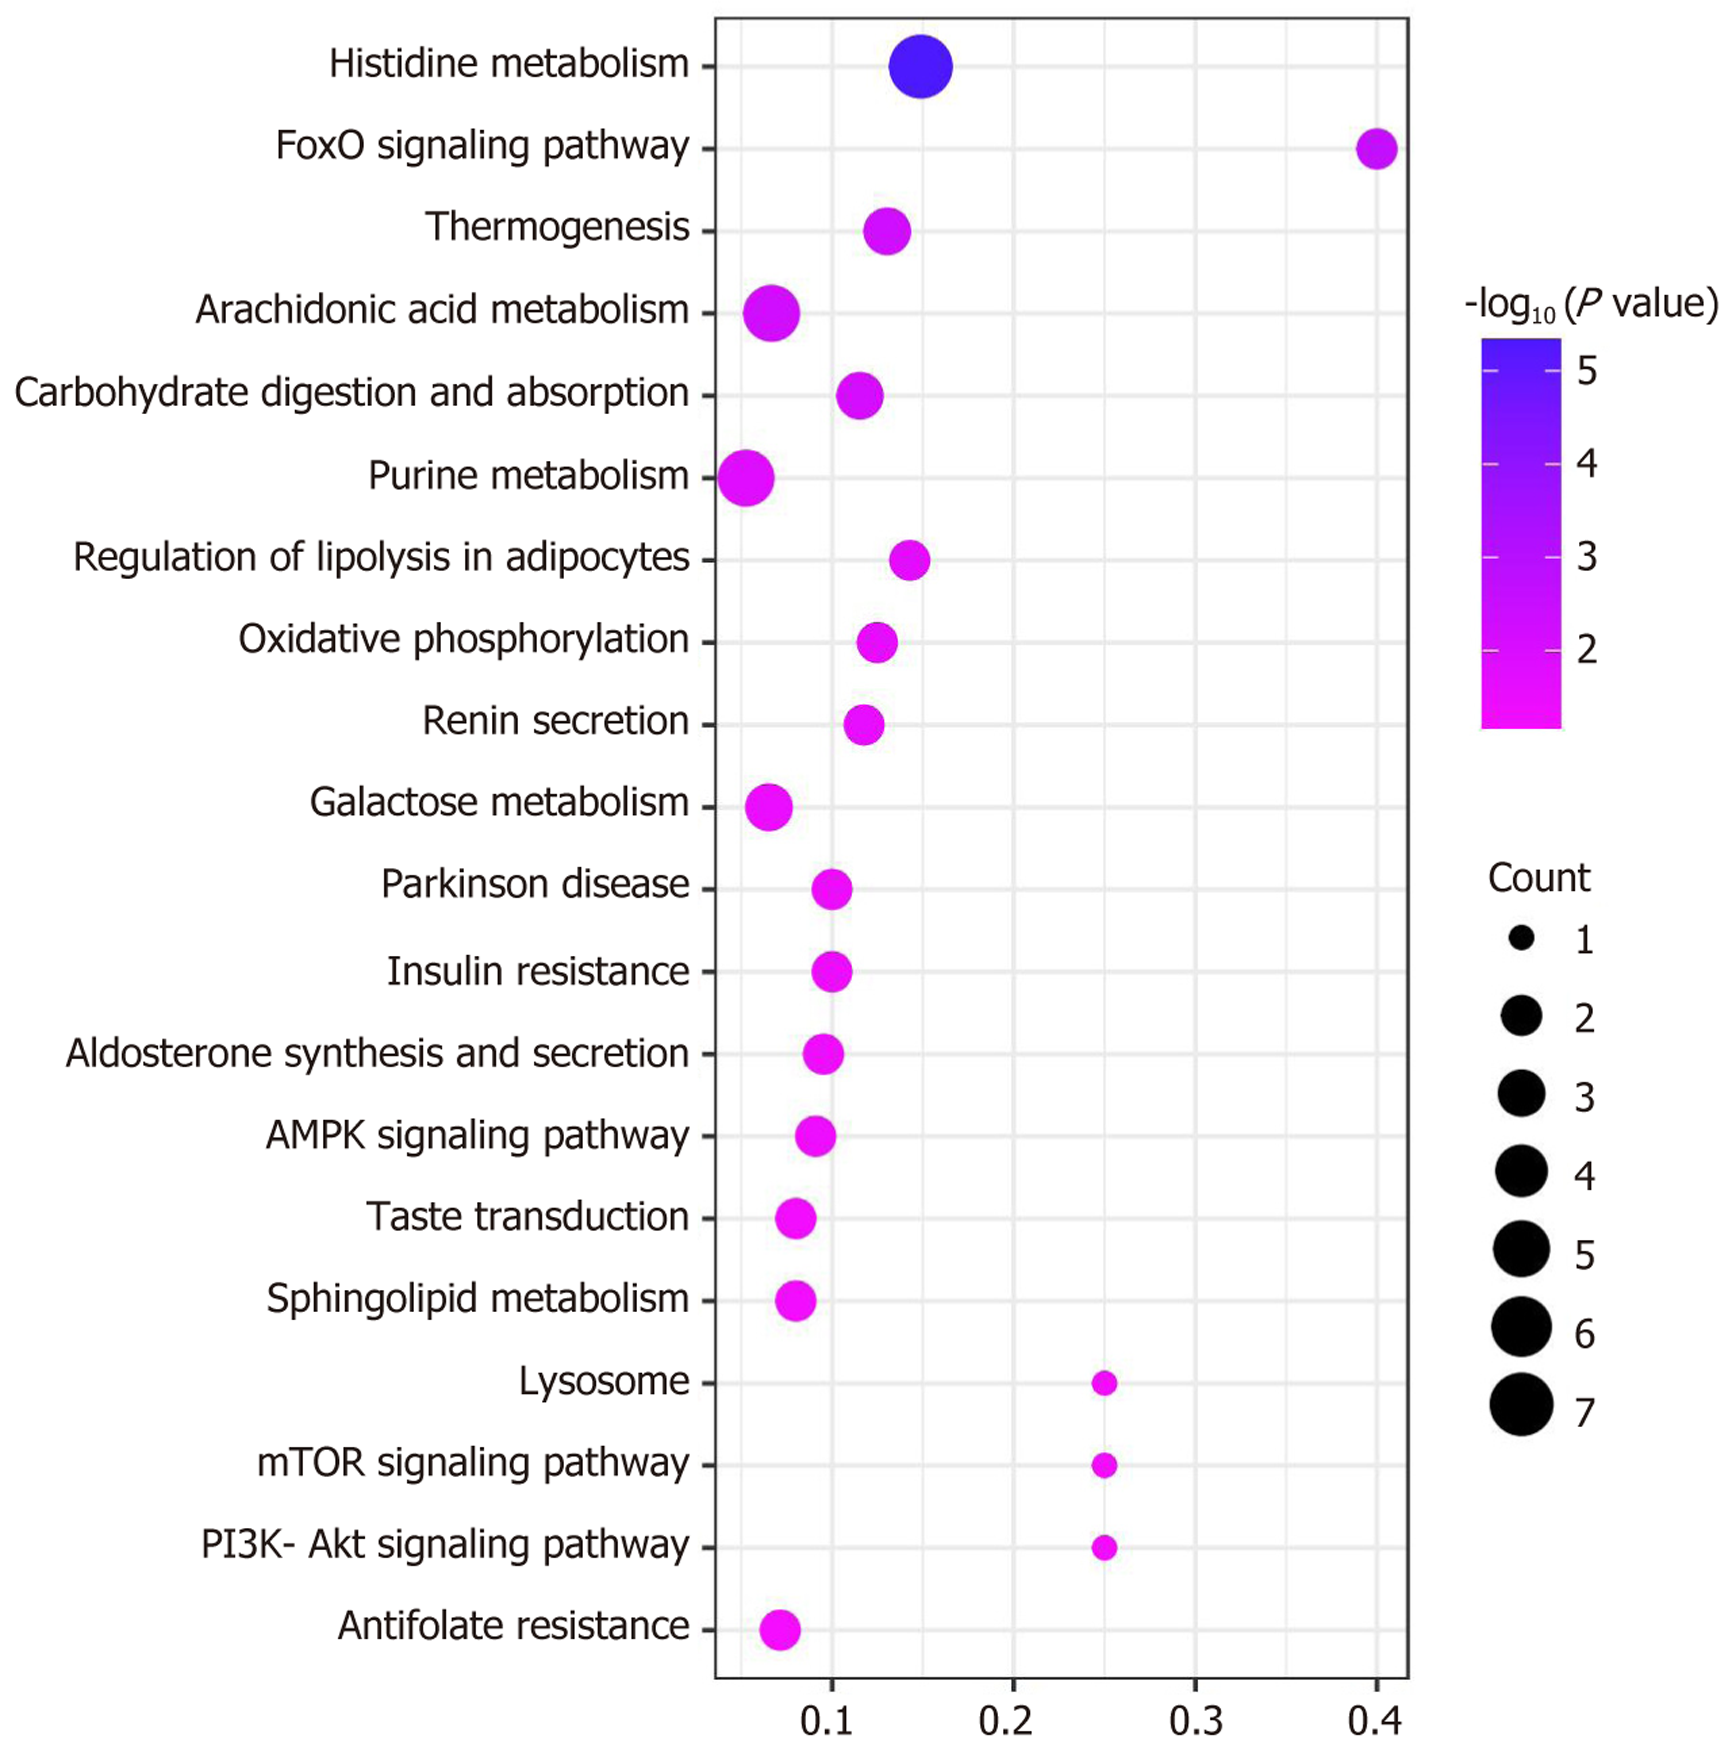
Figure 6 Kyoto Encyclopedia of Genes and Genomes enrichment analysis pointed out the top 20 hepatic pathways by bubble mapping.
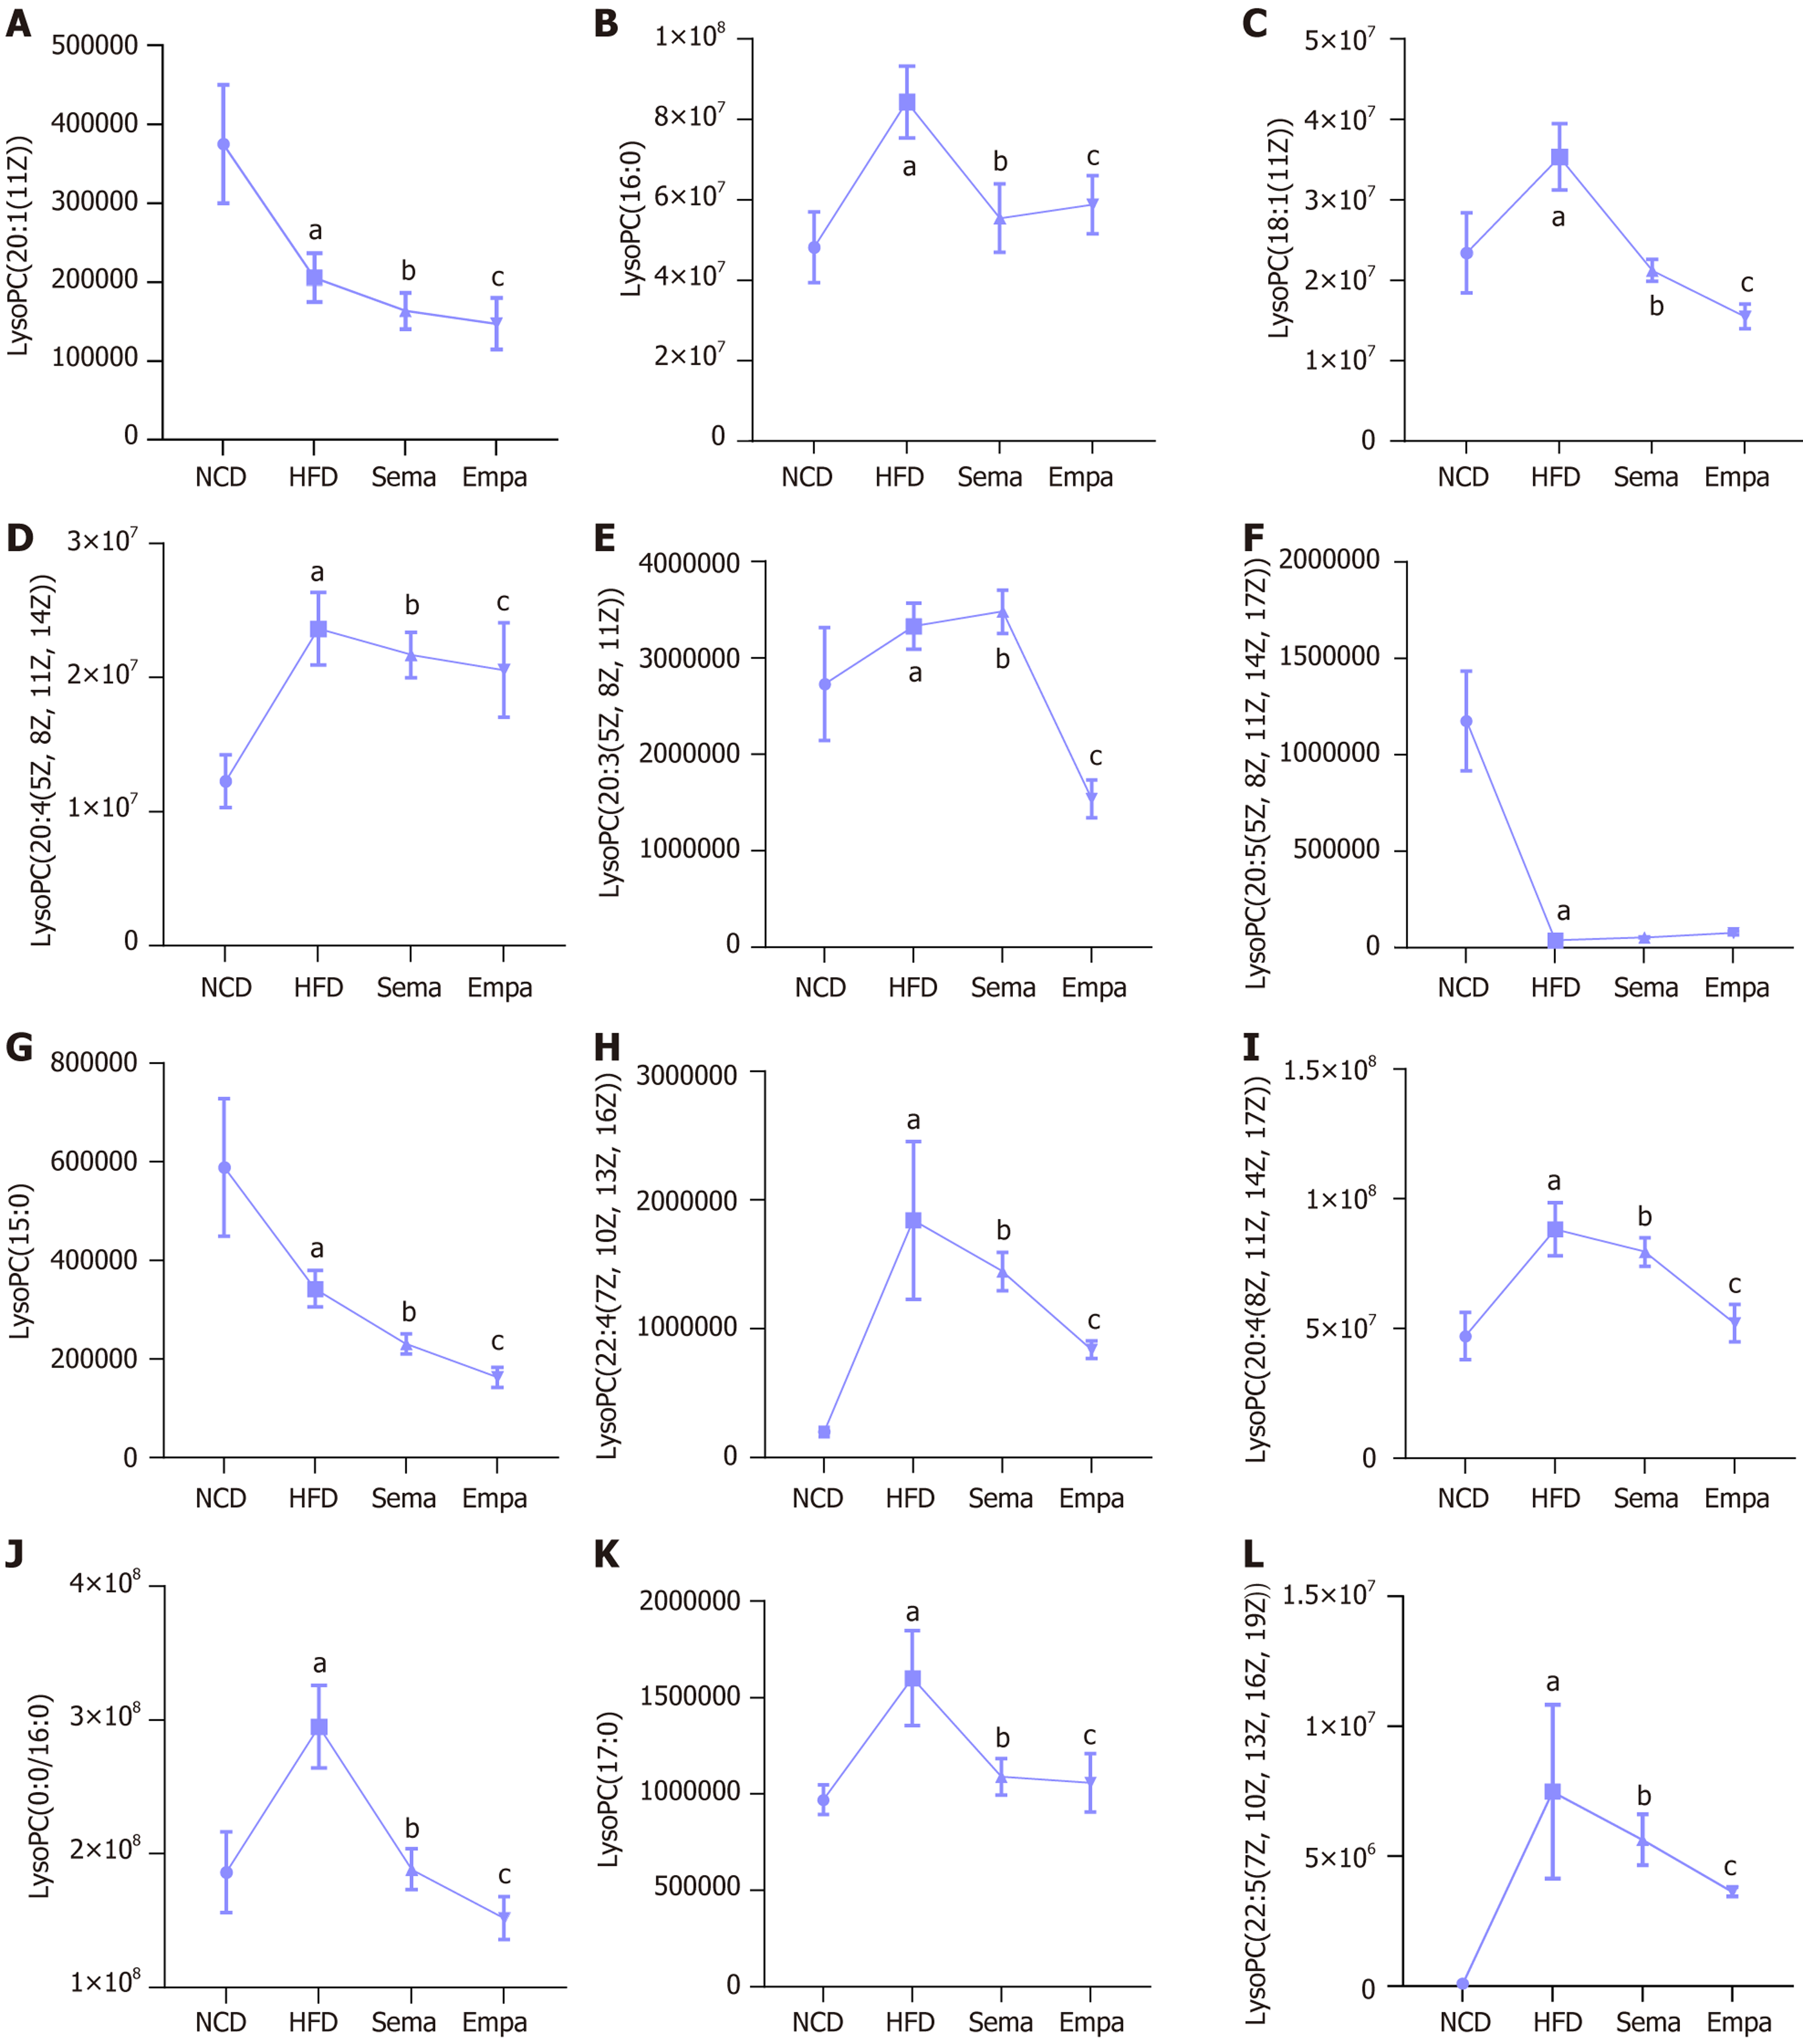
Figure 7 Line plots of the variation of several lysophosphatidylcholine between the four groups.
A: LysoPC [20:1 (11Z)]; B: LysoPC (16:0); C: LysoPC [18:1 (11Z)]; D: LysoPC [20:4 (5Z, 8Z, 11Z, 14Z)]; E: LysoPC [20:3 (5Z, 8Z, 11Z)]; F: LysoPC [20:5 (5Z, 8Z, 11Z, 14Z, 17Z)]; G: LysoPC (15:0); H: LysoPC [22:4 (7Z, 10Z, 13Z, 16Z)]; I: LysoPC [20:4 (8Z, 11Z, 14Z, 17Z)]; J: LysoPC (0:0/16:0); K: LysoPC (17:0); L: LysoPC [22:5 (7Z, 10Z, 13Z, 16Z, 19Z)]. aP < 0.01 indicates high-fat group (HFD group) vs control group, bP < 0.05 Sema vs HFD, cP < 0.05 indicates Empa vs HFD. HFD: A high-fat group; NCD: A control group.
- Citation: Niu S, Chen SC, Wang CX, Yue L, Wang SQ. Metabolic and hepatic effects of semaglutide and empagliflozin on metabolic dysfunction-associated steatotic liver disease mice. World J Hepatol 2025; 17(10): 110402
- URL: https://www.wjgnet.com/1948-5182/full/v17/i10/110402.htm
- DOI: https://dx.doi.org/10.4254/wjh.v17.i10.110402


