Copyright
©The Author(s) 2025.
World J Hepatol. Jan 27, 2025; 17(1): 101704
Published online Jan 27, 2025. doi: 10.4254/wjh.v17.i1.101704
Published online Jan 27, 2025. doi: 10.4254/wjh.v17.i1.101704
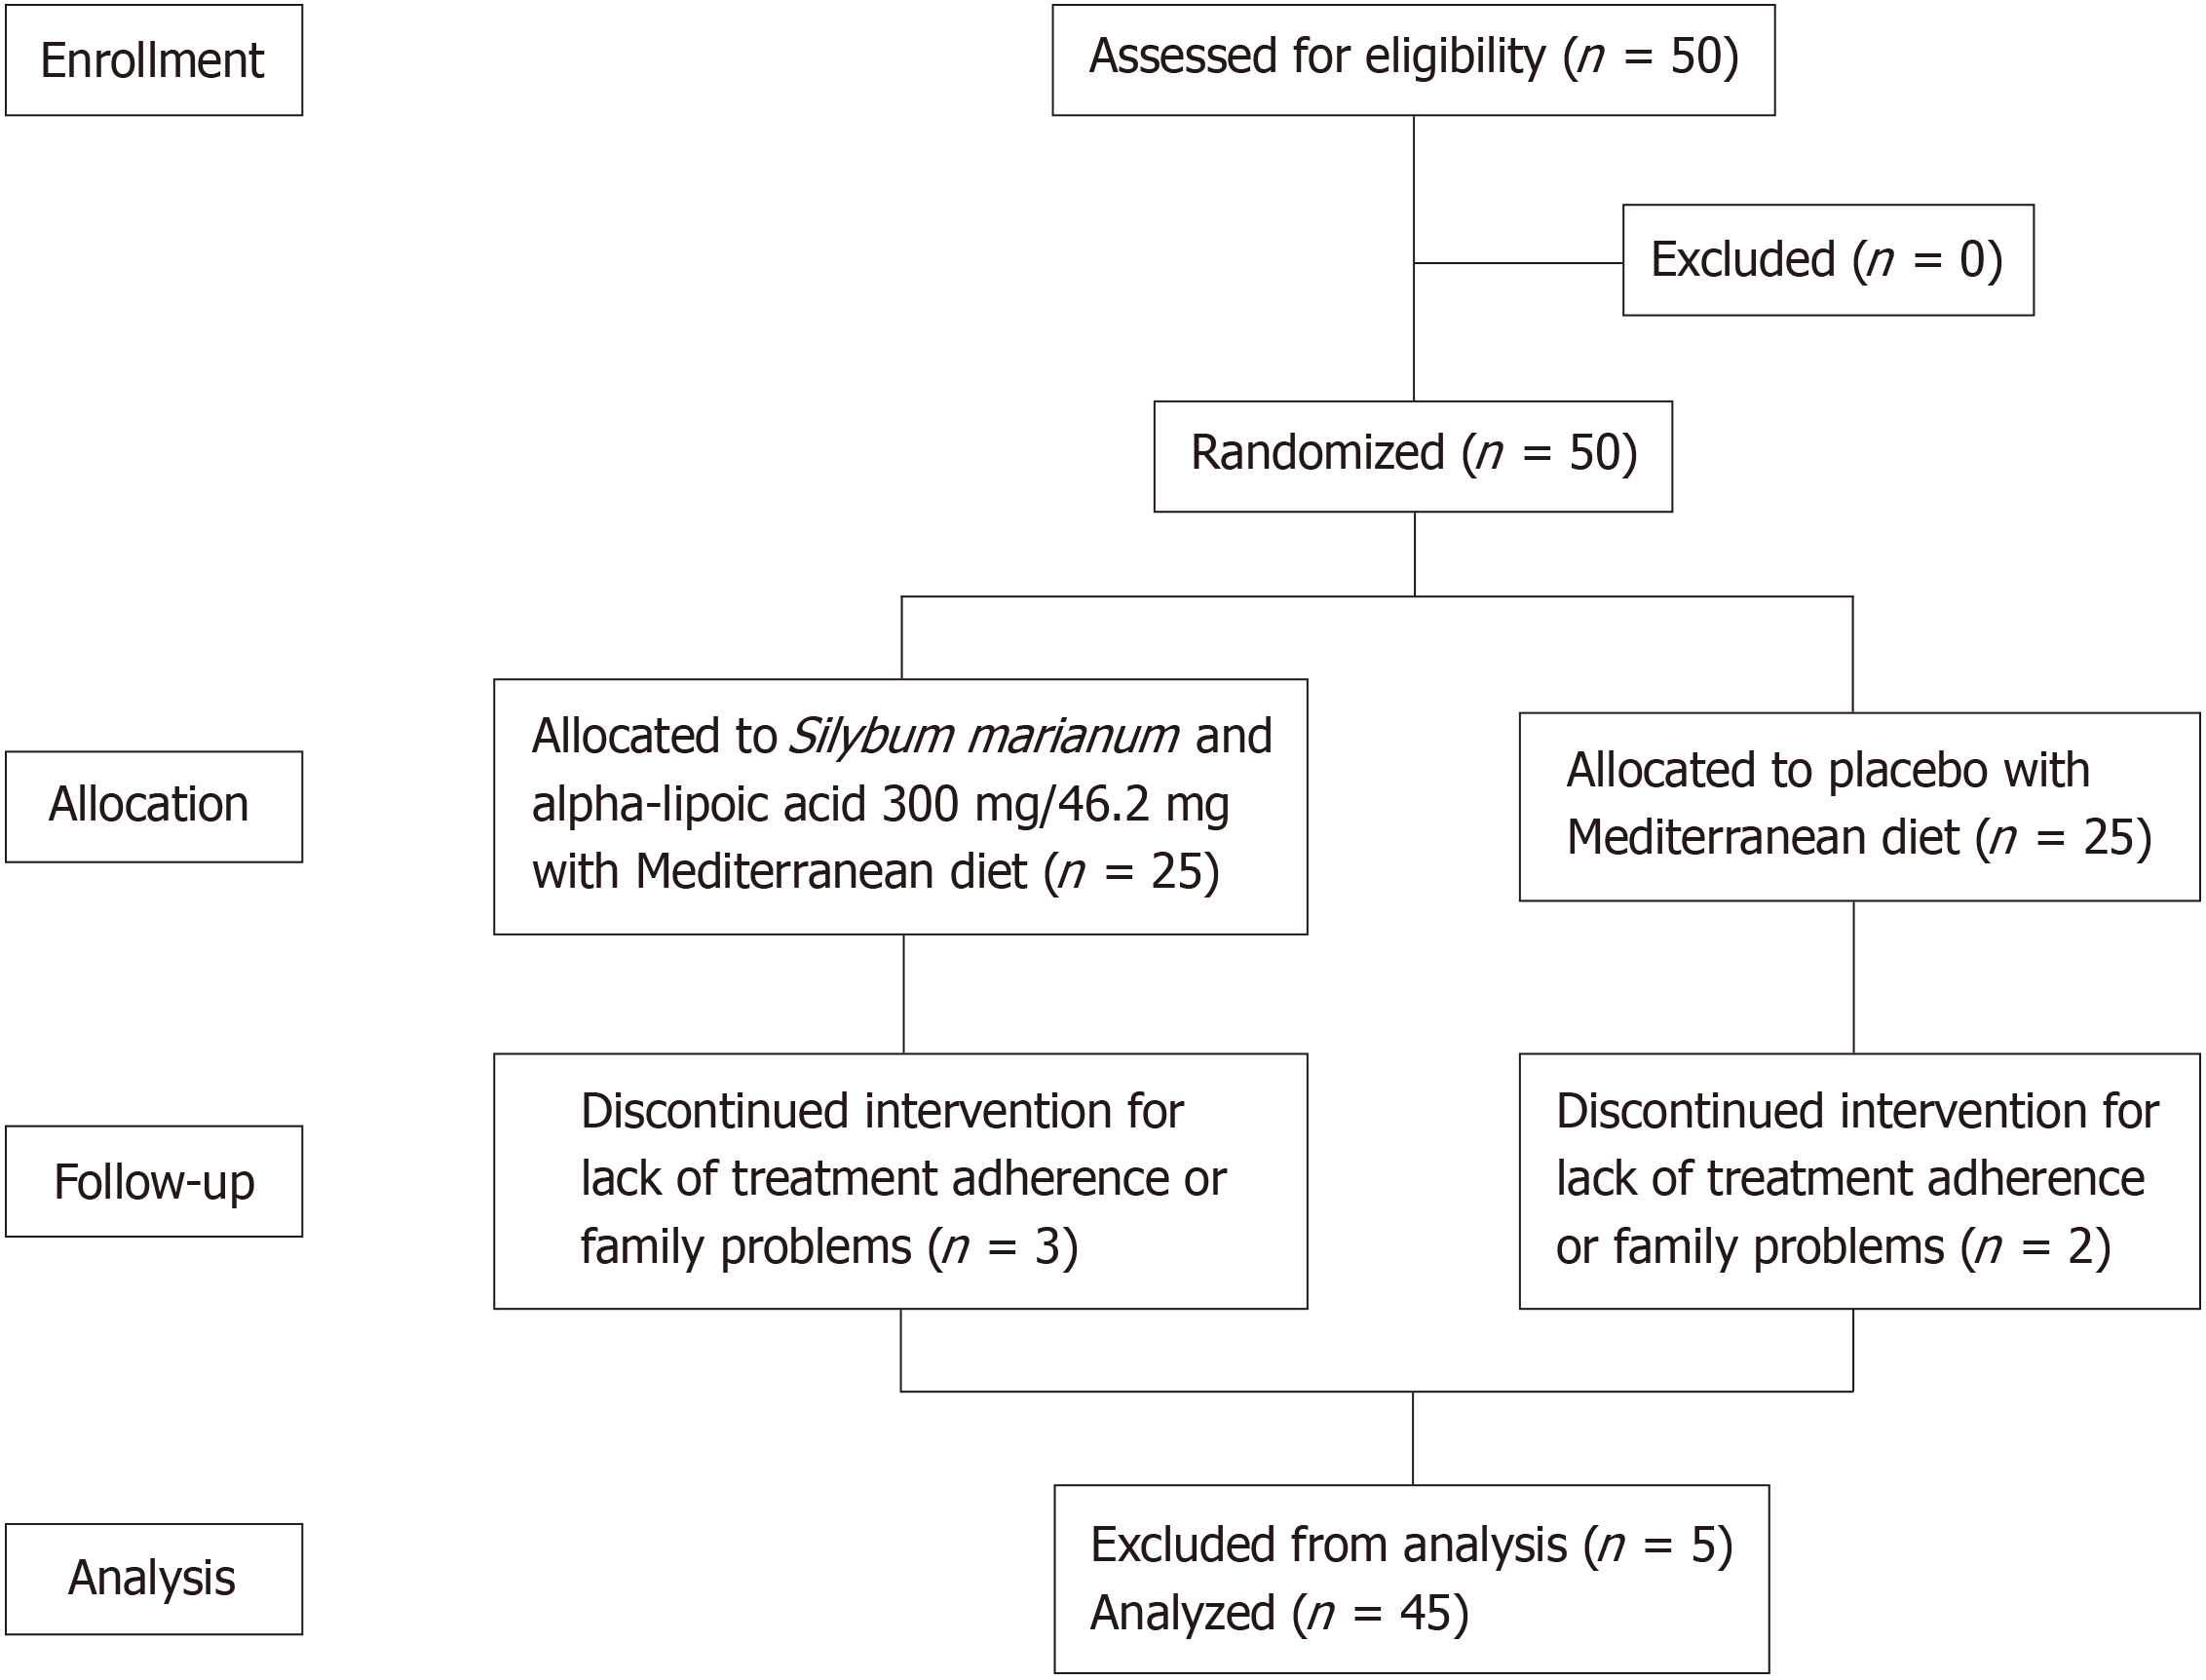
Figure 1
Flow diagram of the study.
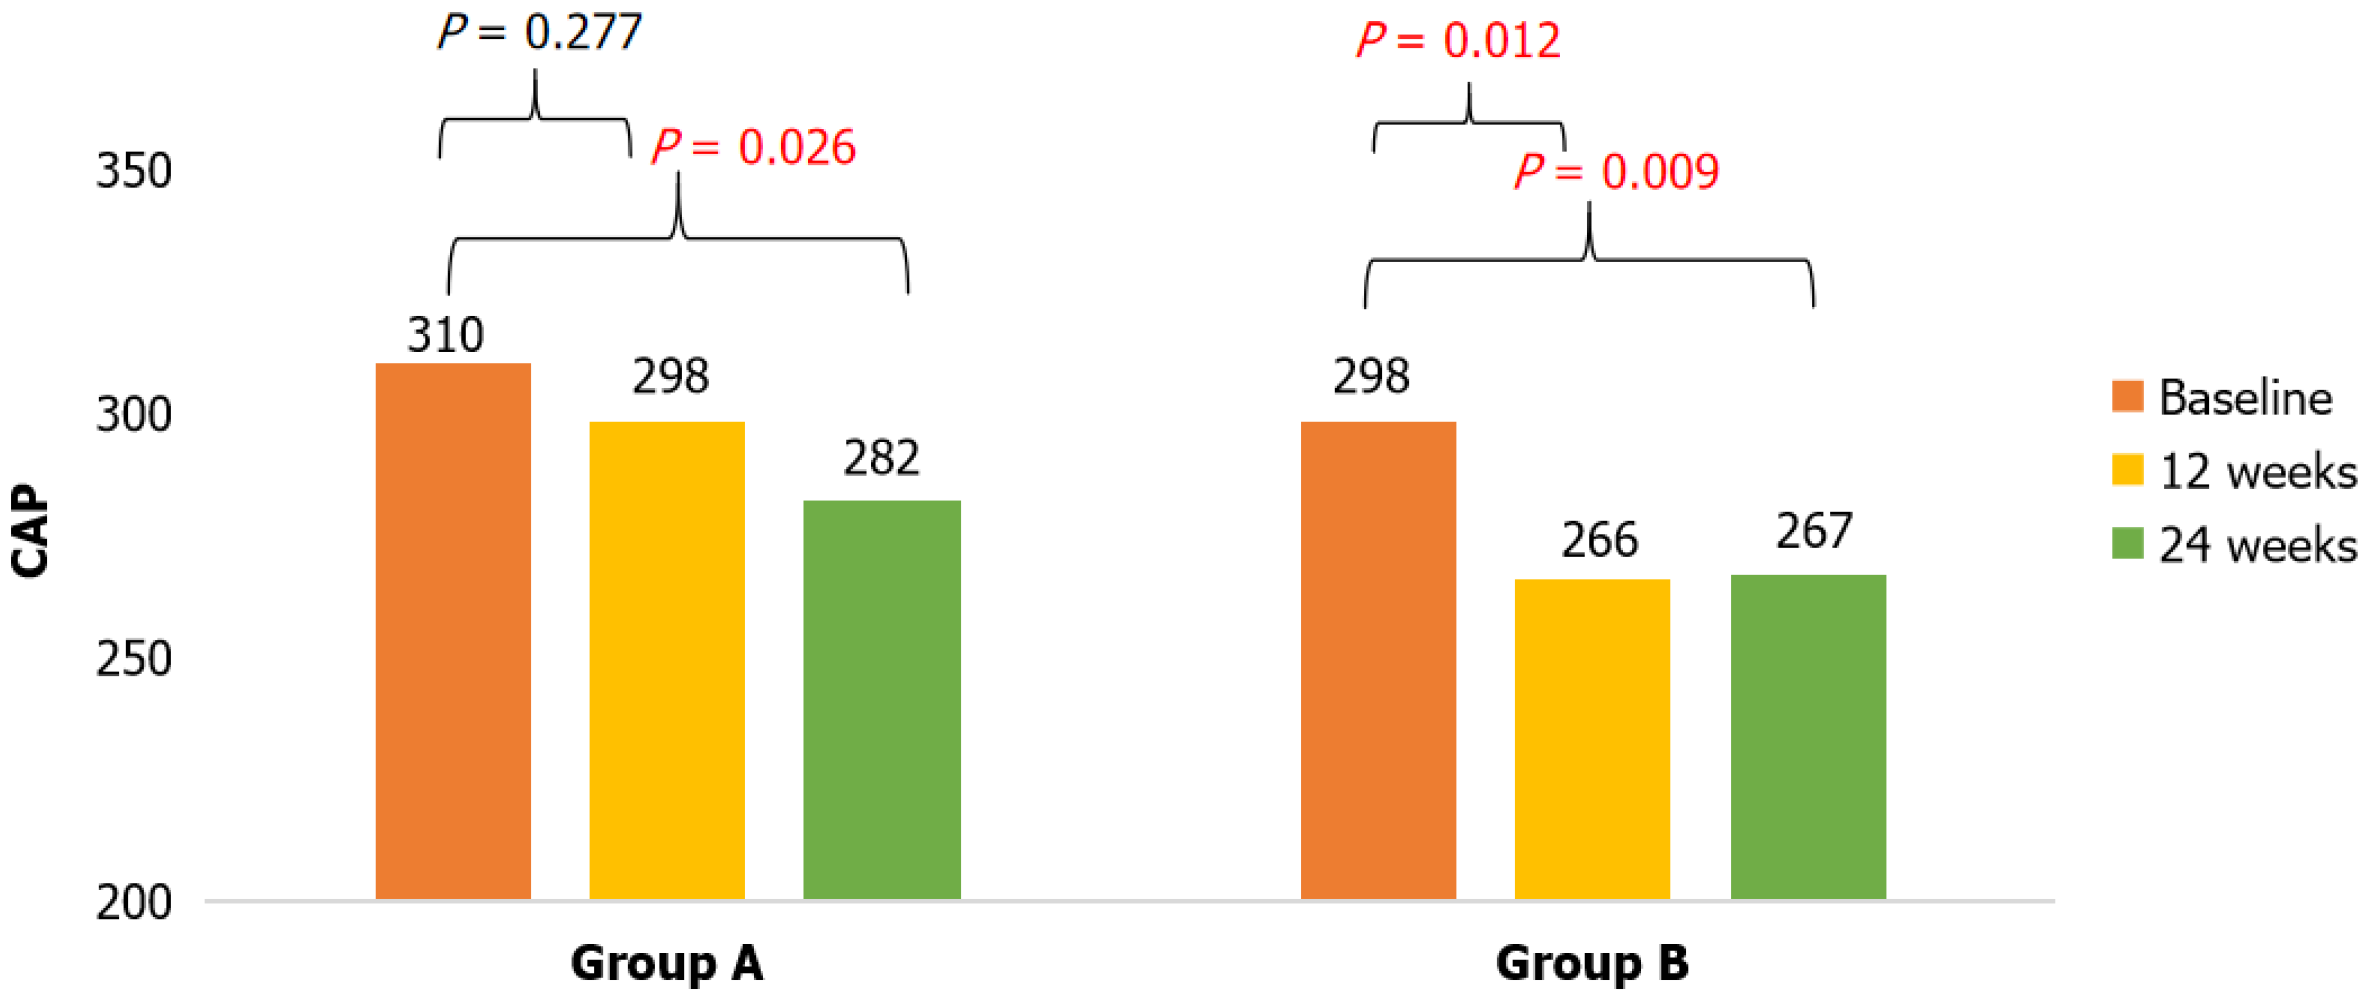
Figure 2 Mean controlled attenuation parameter at baseline and weeks 12 and 24 in the intervention and control groups with metabolic dysfunction-associated steatotic liver disease.
P values are from repeated measures analysis of variance. CAP: Controlled attenuation parameter. Group A: Silybum marianum and alpha-lipoic acid + Mediterranean diet; Group B: Placebo + Mediterranean diet.
- Citation: Cano Contreras AD, Del Rocío Francisco M, Vargas Basurto JL, Gonzalez-Gomez KD, Amieva-Balmori M, Roesch Dietlen F, Remes-Troche JM. Effect of alpha-lipoic acid and Silybum marianum supplementation with a Mediterranean diet on metabolic dysfunction-associated steatosis. World J Hepatol 2025; 17(1): 101704
- URL: https://www.wjgnet.com/1948-5182/full/v17/i1/101704.htm
- DOI: https://dx.doi.org/10.4254/wjh.v17.i1.101704


