Copyright
©The Author(s) 2024.
World J Hepatol. May 27, 2024; 16(5): 800-808
Published online May 27, 2024. doi: 10.4254/wjh.v16.i5.800
Published online May 27, 2024. doi: 10.4254/wjh.v16.i5.800
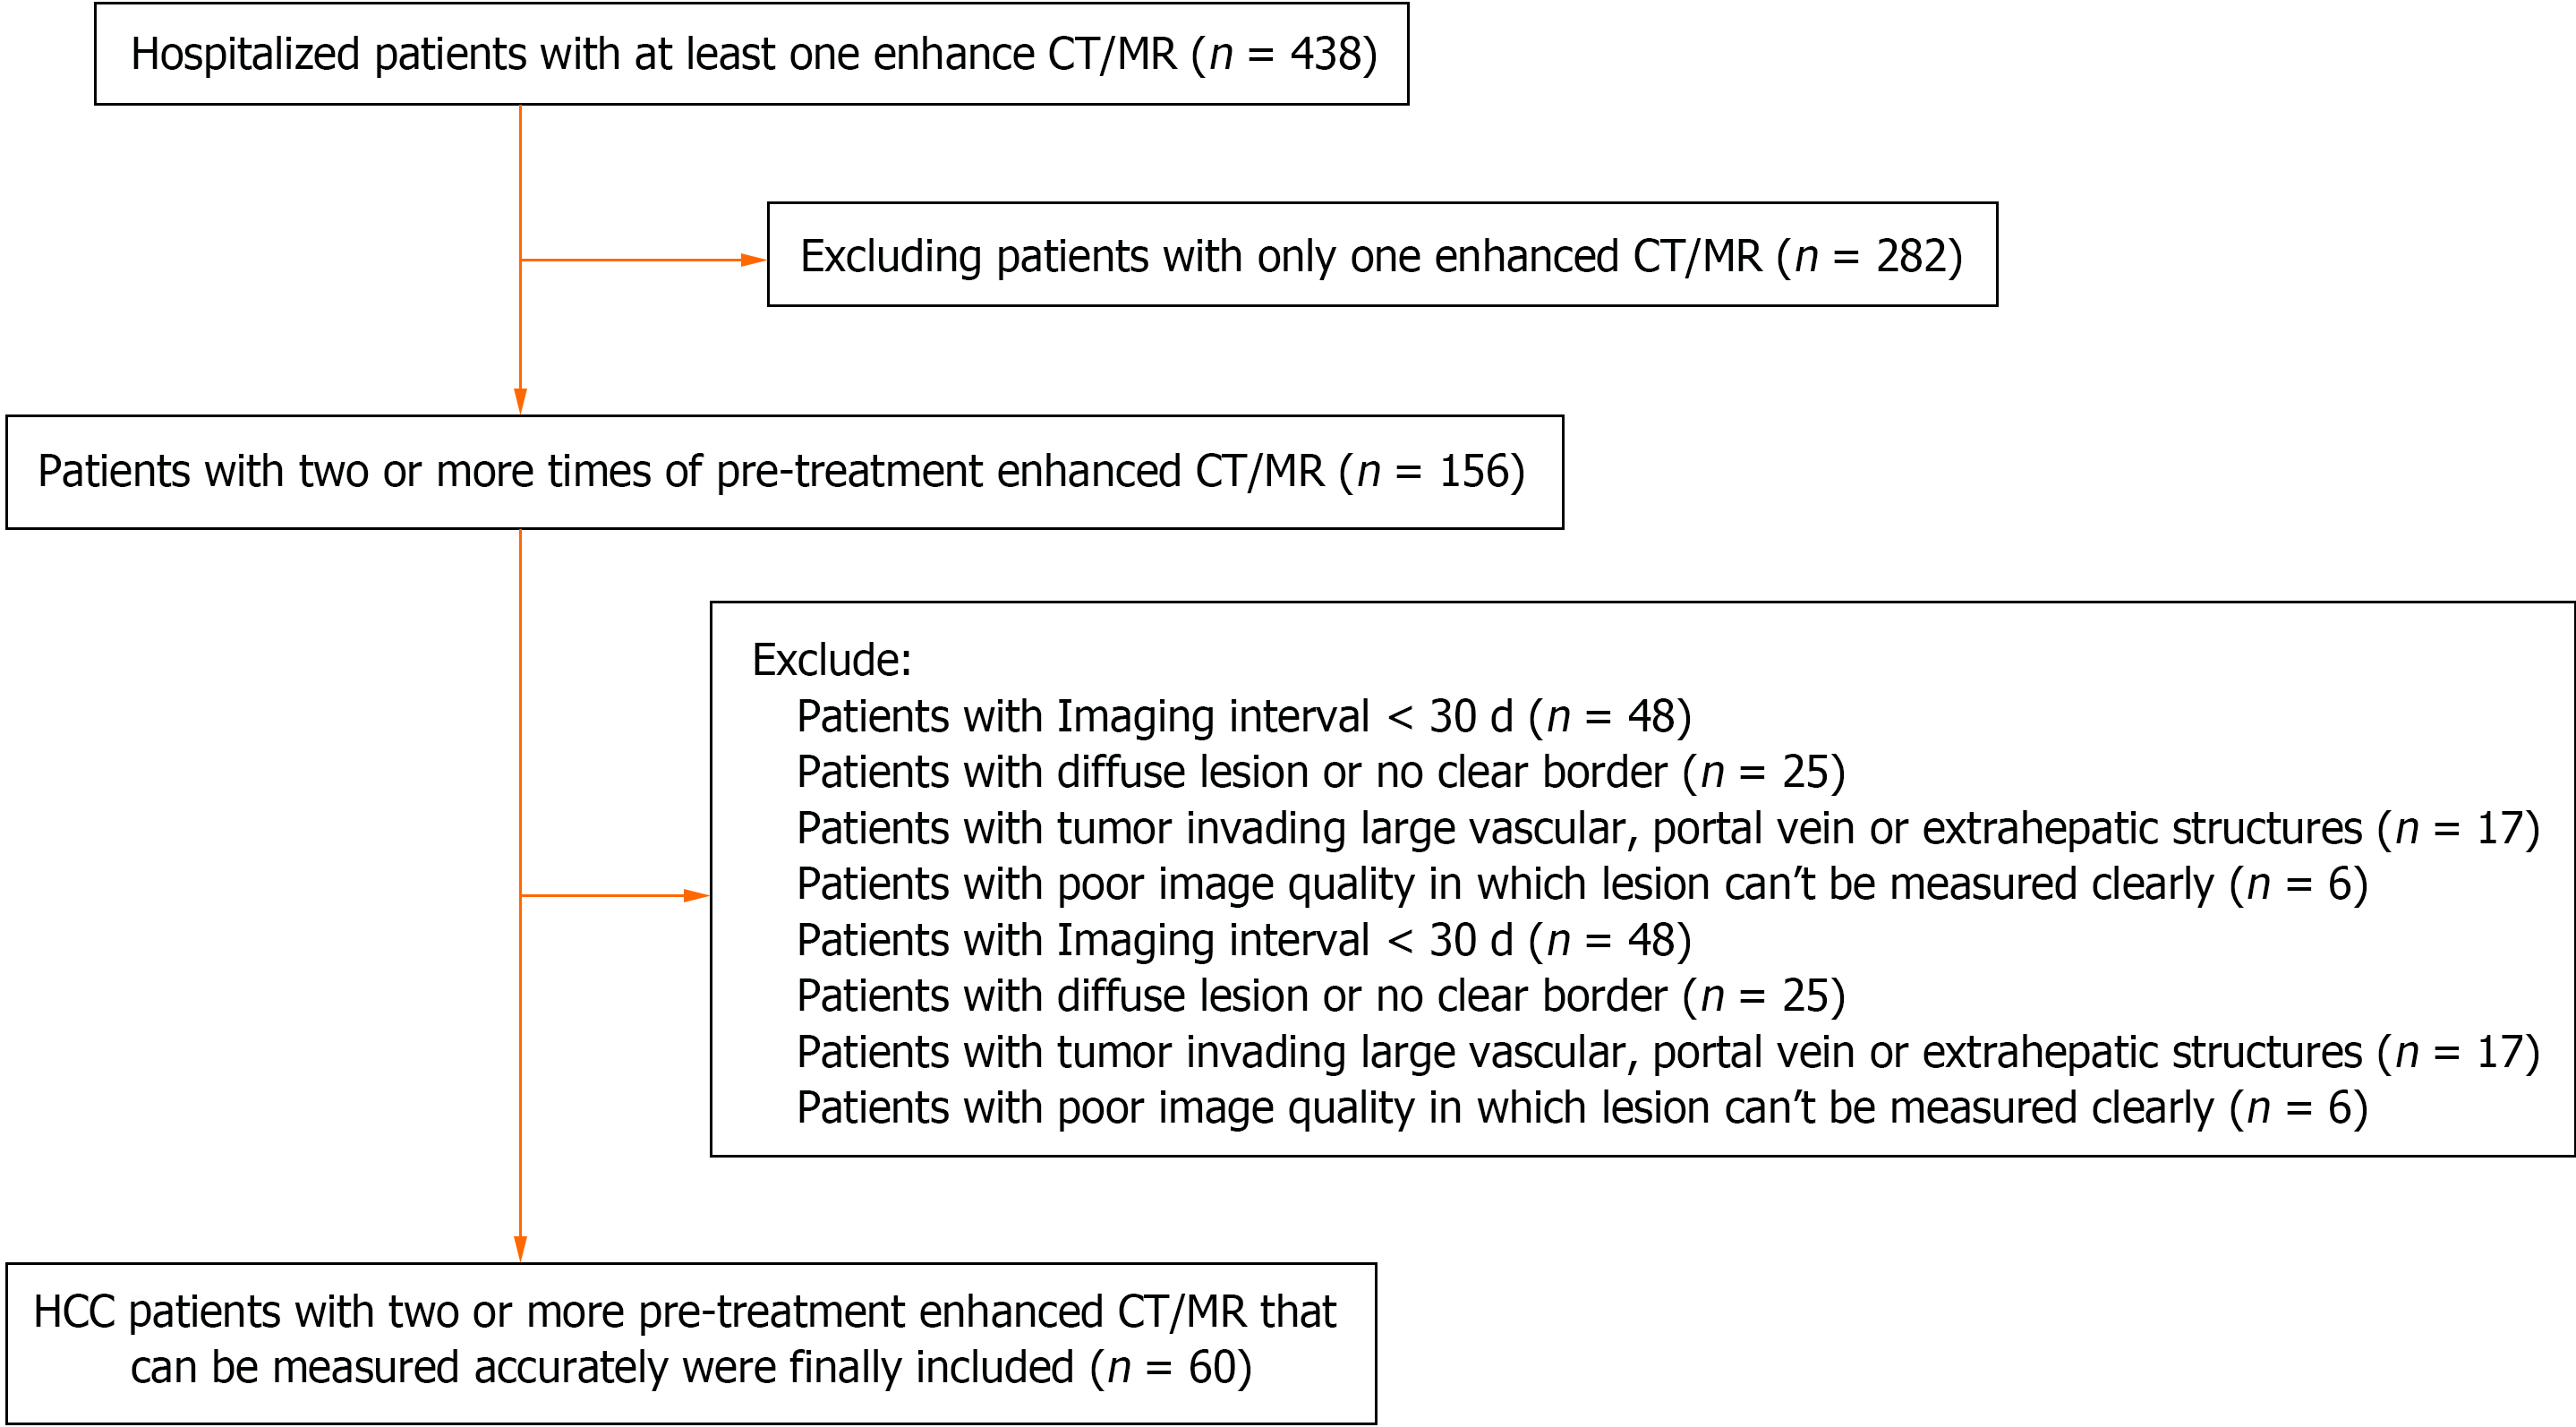
Figure 1 Flow diagram of the study.
CT: Computed tomography; MR: Magnetic resonance.
Figure 2 Contrast enhanced computed tomography of one typical patient in this study.
A: One lesion in the right lobe shows arterial phase hyper-enhancement; B: The lesion demonstrates typical rapid washout feature; C: Capsule of the tumor can be observed. B and C also demonstrate the measuring method used in the study.
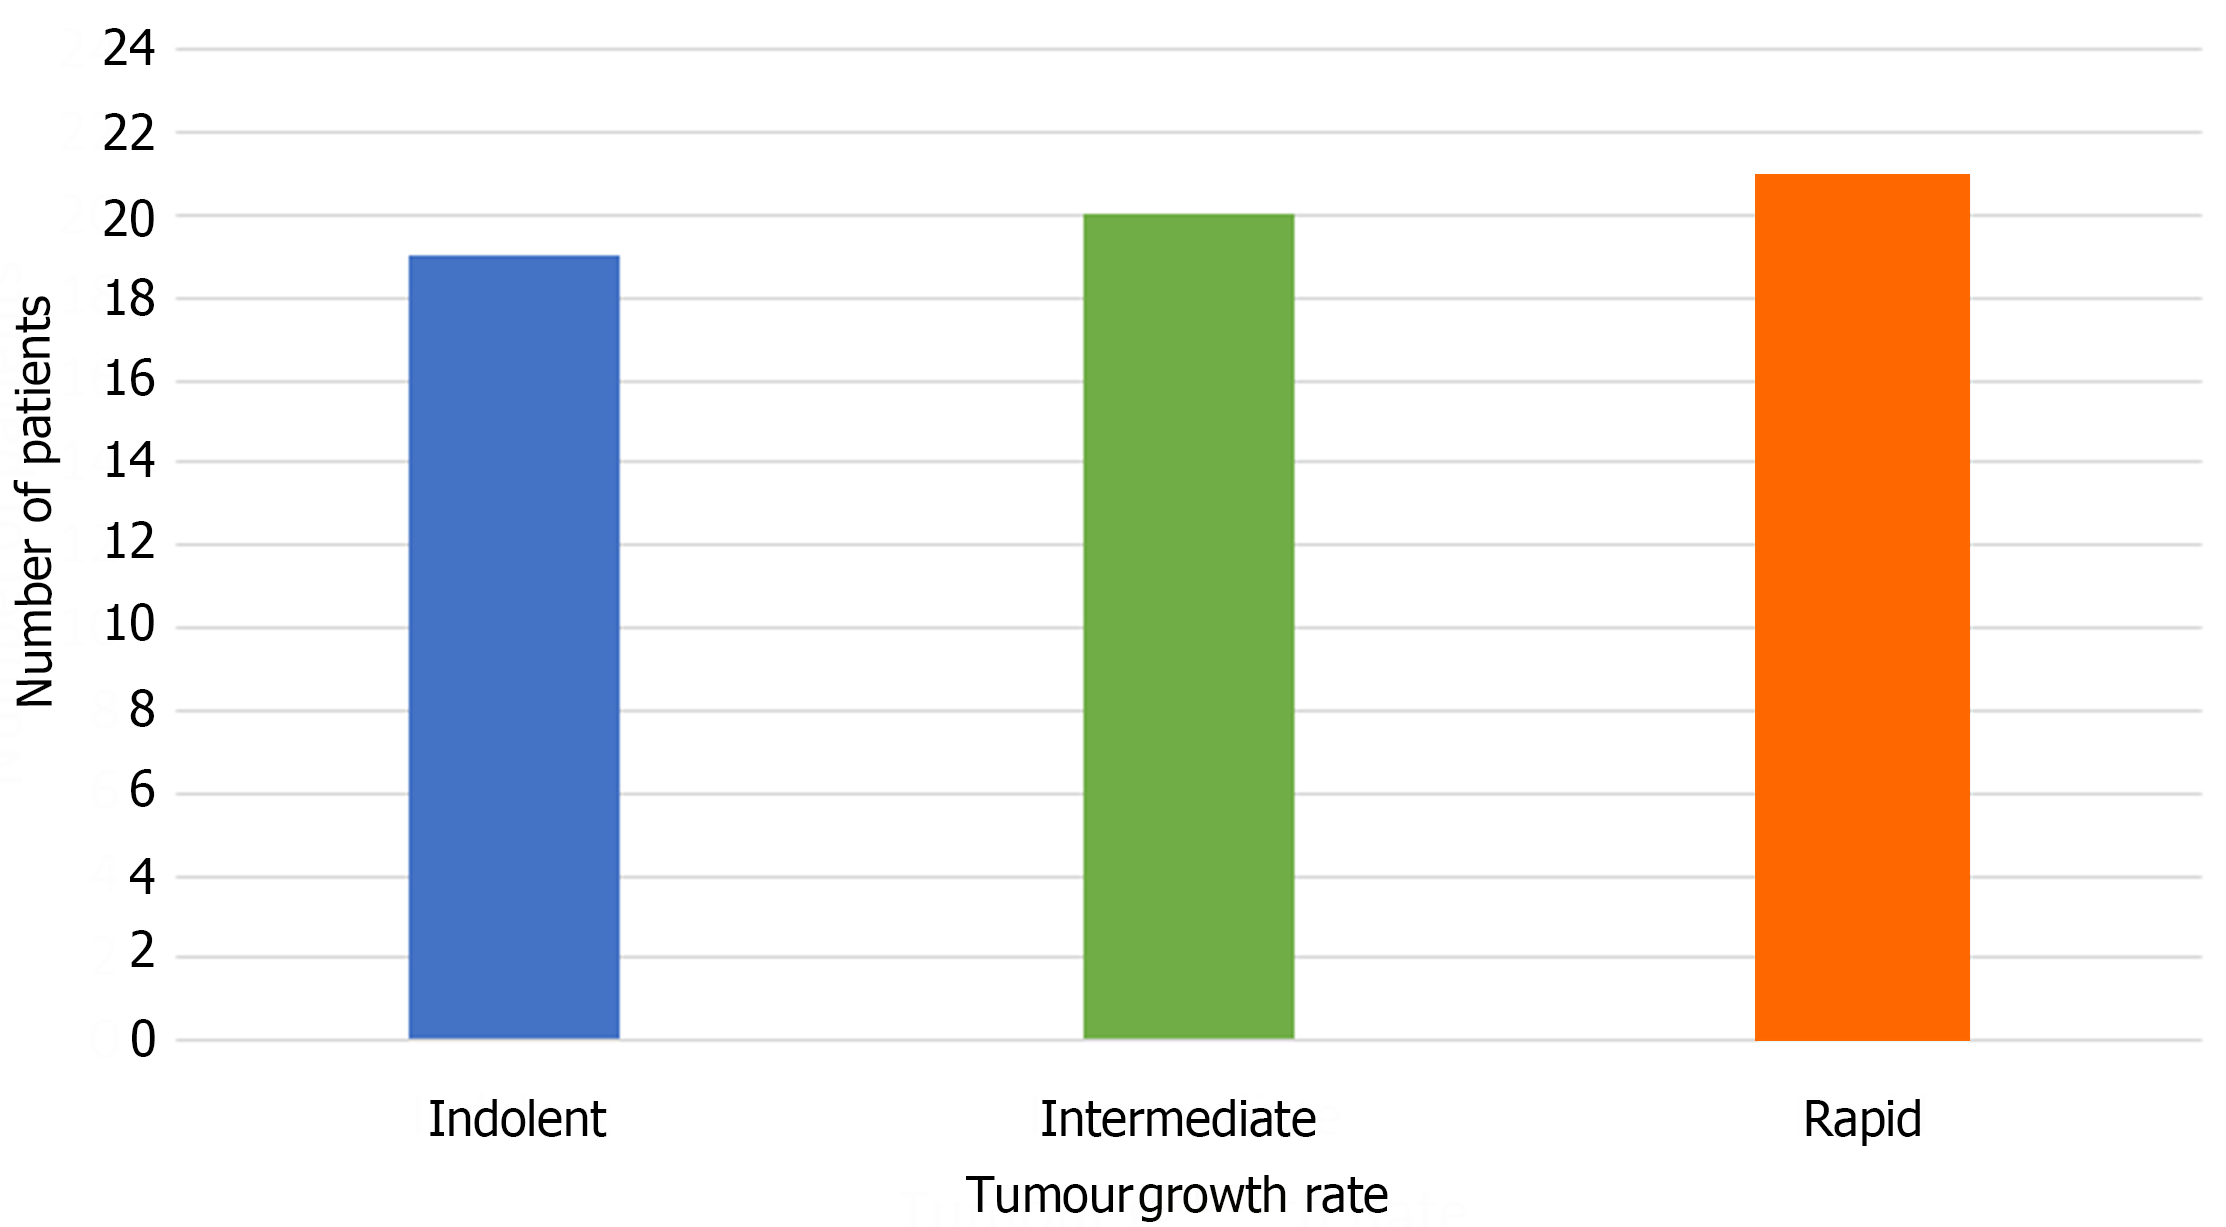
Figure 3 Distribution of patients in each group stratified by the tumor growth rate.
Each of the groups contributed to nearly one-third of the study.
- Citation: Tu L, Xie H, Li Q, Lei PG, Zhao PL, Yang F, Gong C, Yao YL, Zhou S. Quantifying the natural growth rate of hepatocellular carcinoma: A real-world retrospective study in southwestern China. World J Hepatol 2024; 16(5): 800-808
- URL: https://www.wjgnet.com/1948-5182/full/v16/i5/800.htm
- DOI: https://dx.doi.org/10.4254/wjh.v16.i5.800


