Copyright
©The Author(s) 2024.
World J Hepatol. Mar 27, 2024; 16(3): 477-489
Published online Mar 27, 2024. doi: 10.4254/wjh.v16.i3.477
Published online Mar 27, 2024. doi: 10.4254/wjh.v16.i3.477
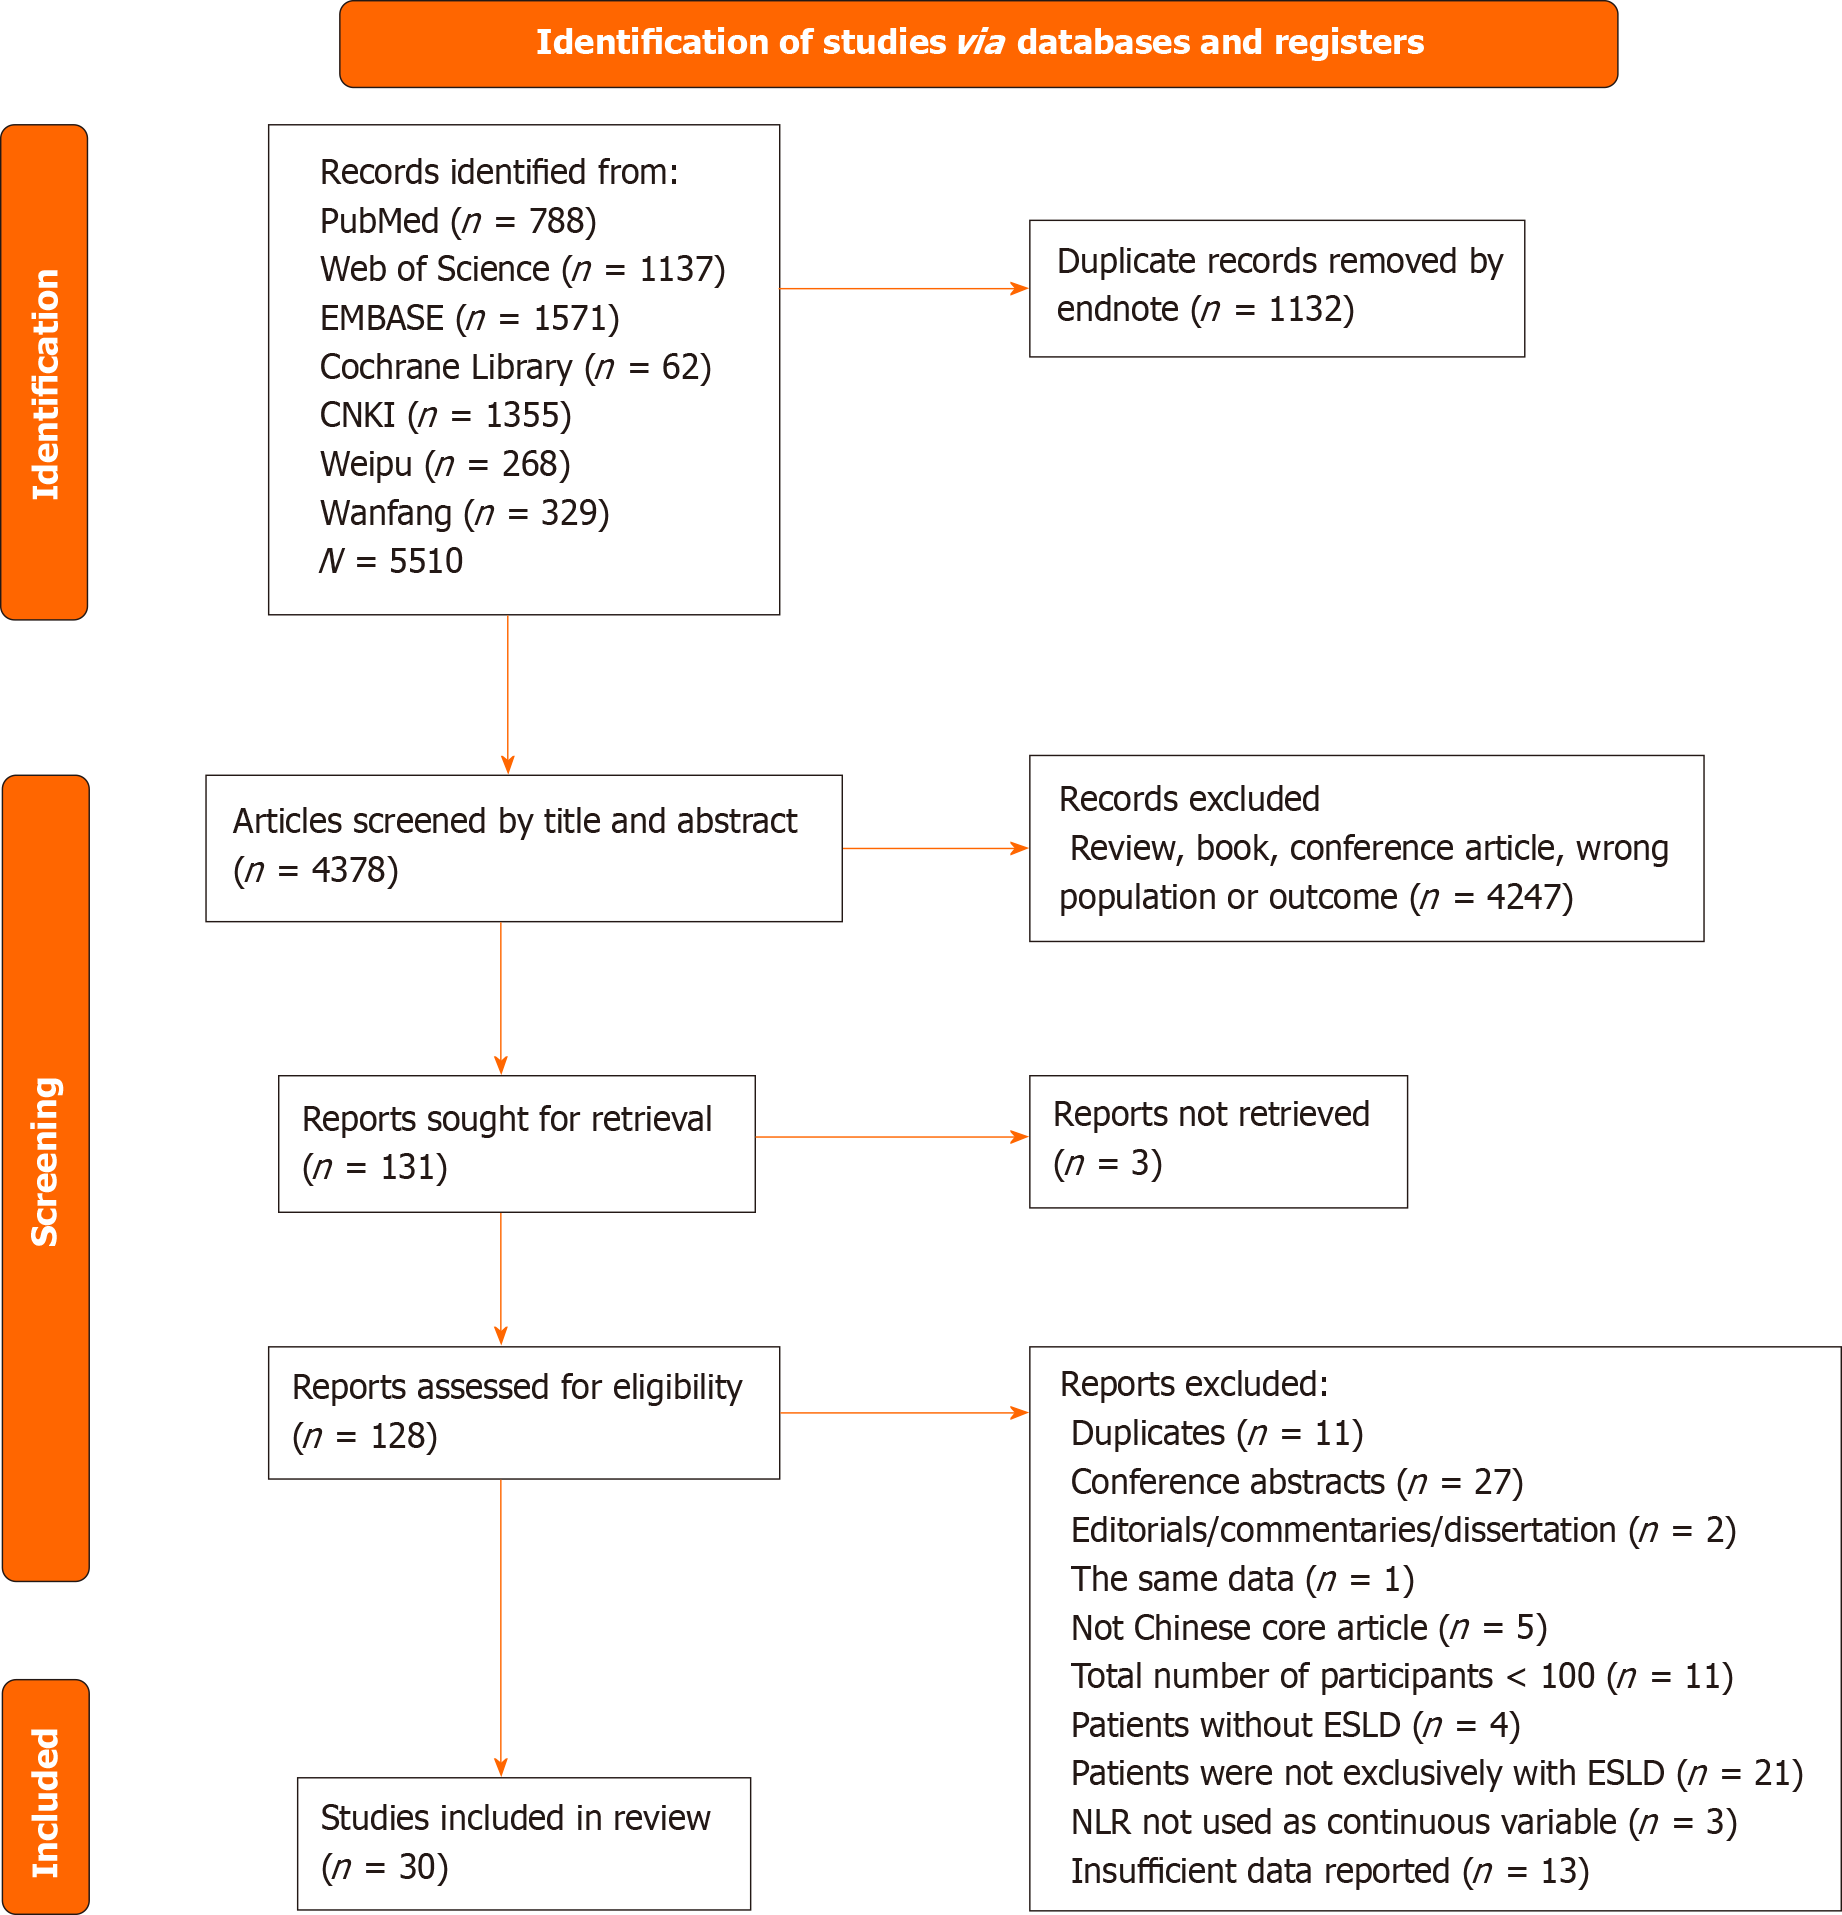
Figure 1 PRISMA flowchart outlining the study search.
NLR: Neutrophil-to-lymphocyte ratio; ESLD: End-stage liver disease.
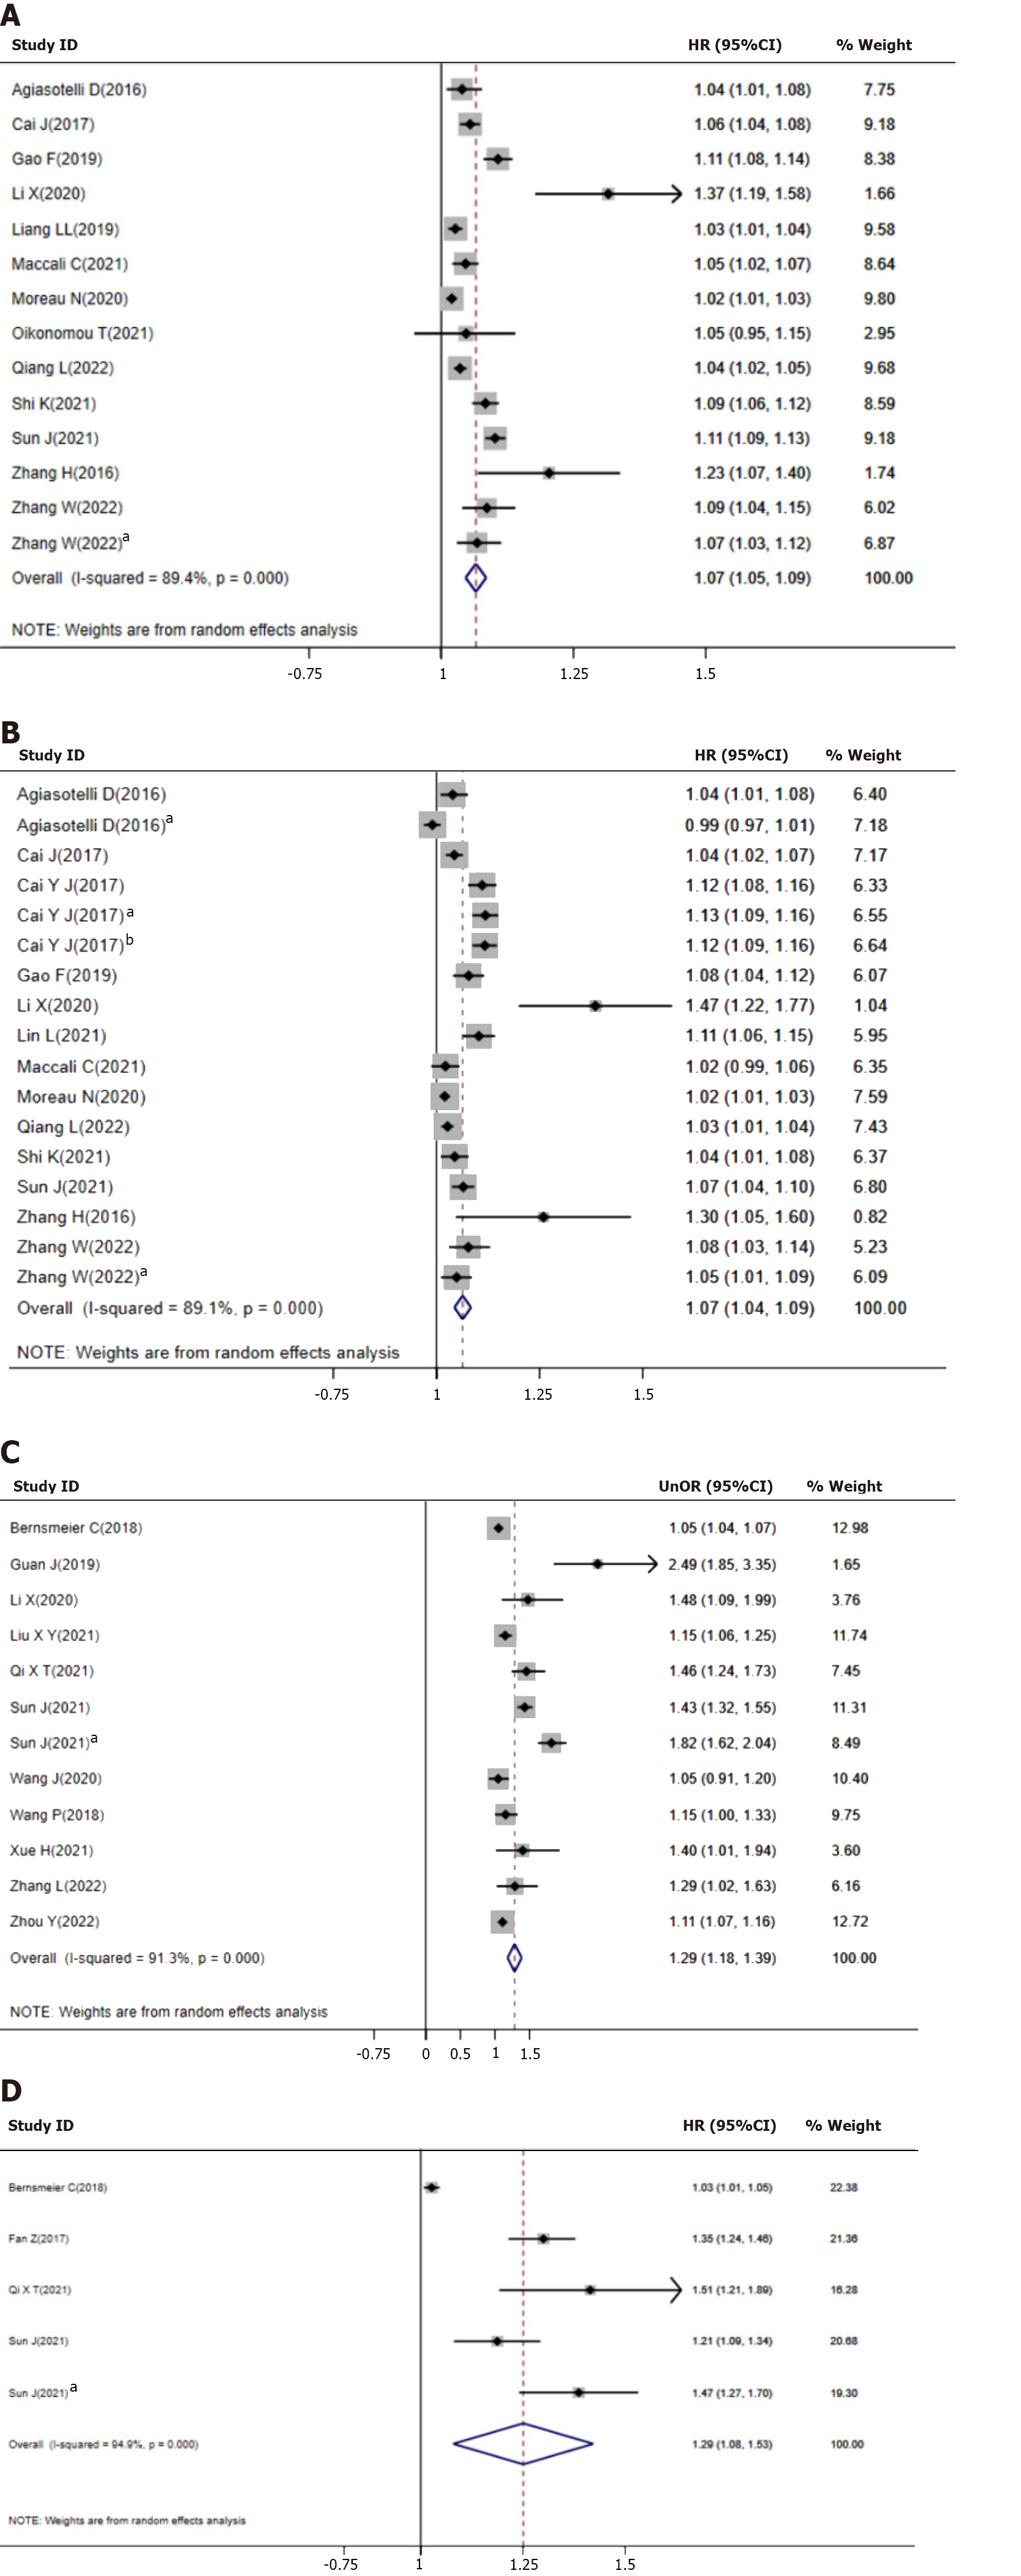
Figure 2 Forest plot of association between neutrophil-to-lymphocyte ratio and end-stage liver disease mortality.
A: Univariate hazard ratios (HR); B: Multivariate HR; C: Univariate odds ratios (OR); D: Multivariate OR. Different subgroup data extracted in the same literature were distinguished using the letter (a) and (b).
- Citation: Cai XH, Tang YM, Chen SR, Pang JH, Chong YT, Cao H, Li XH. Prognostic value of neutrophil-to-lymphocyte ratio in end-stage liver disease: A meta-analysis. World J Hepatol 2024; 16(3): 477-489
- URL: https://www.wjgnet.com/1948-5182/full/v16/i3/477.htm
- DOI: https://dx.doi.org/10.4254/wjh.v16.i3.477


