Copyright
©The Author(s) 2024.
World J Hepatol. Feb 27, 2024; 16(2): 241-250
Published online Feb 27, 2024. doi: 10.4254/wjh.v16.i2.241
Published online Feb 27, 2024. doi: 10.4254/wjh.v16.i2.241
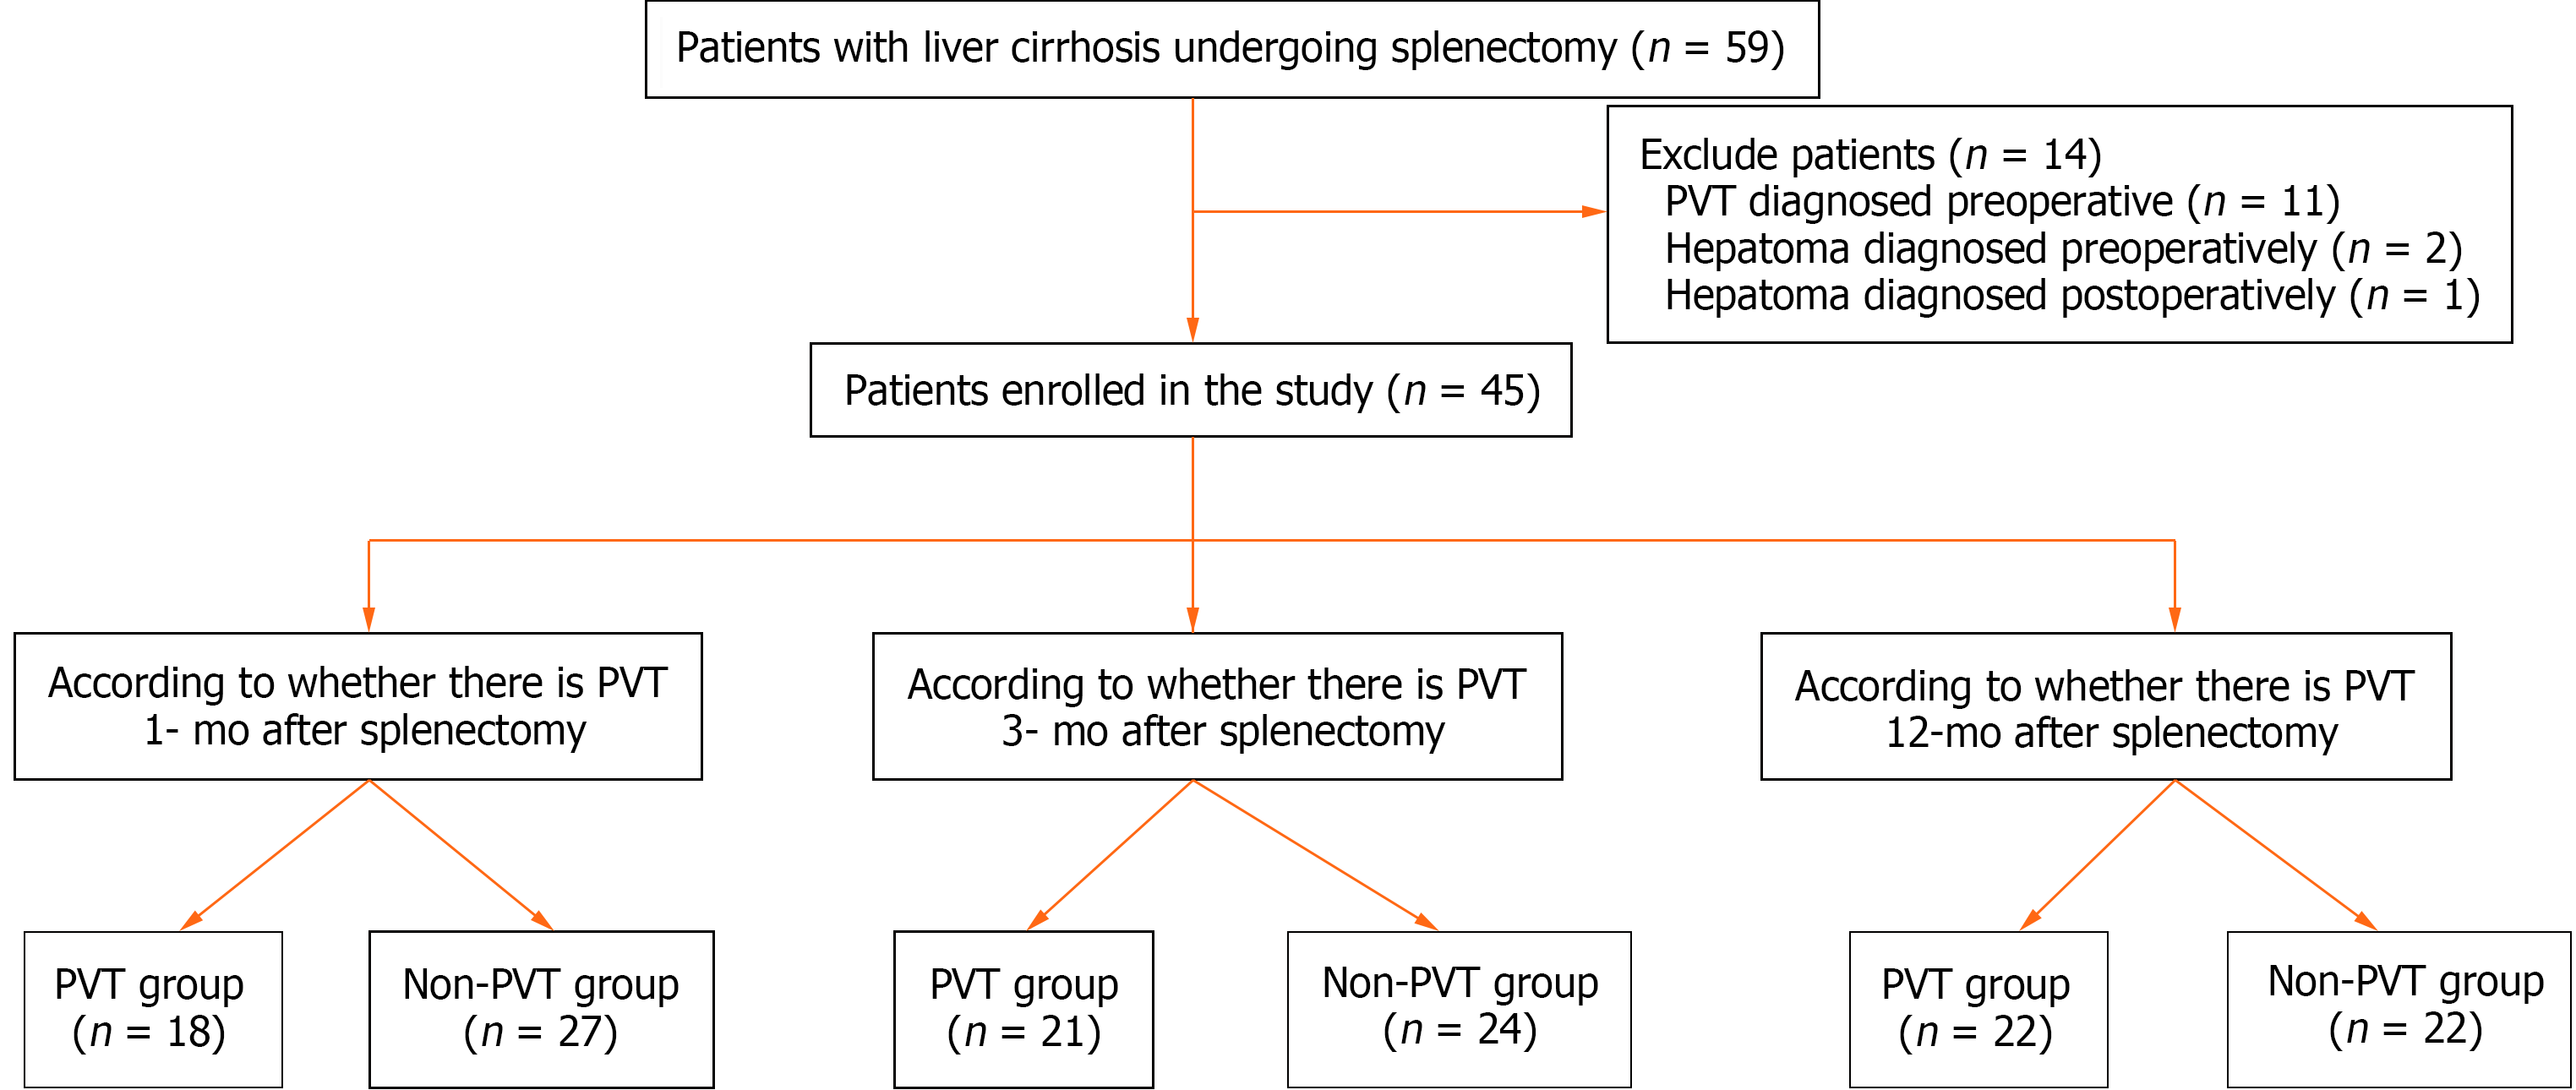
Figure 1 Flowchart of the study population.
PVT: Portal vein thrombosis.
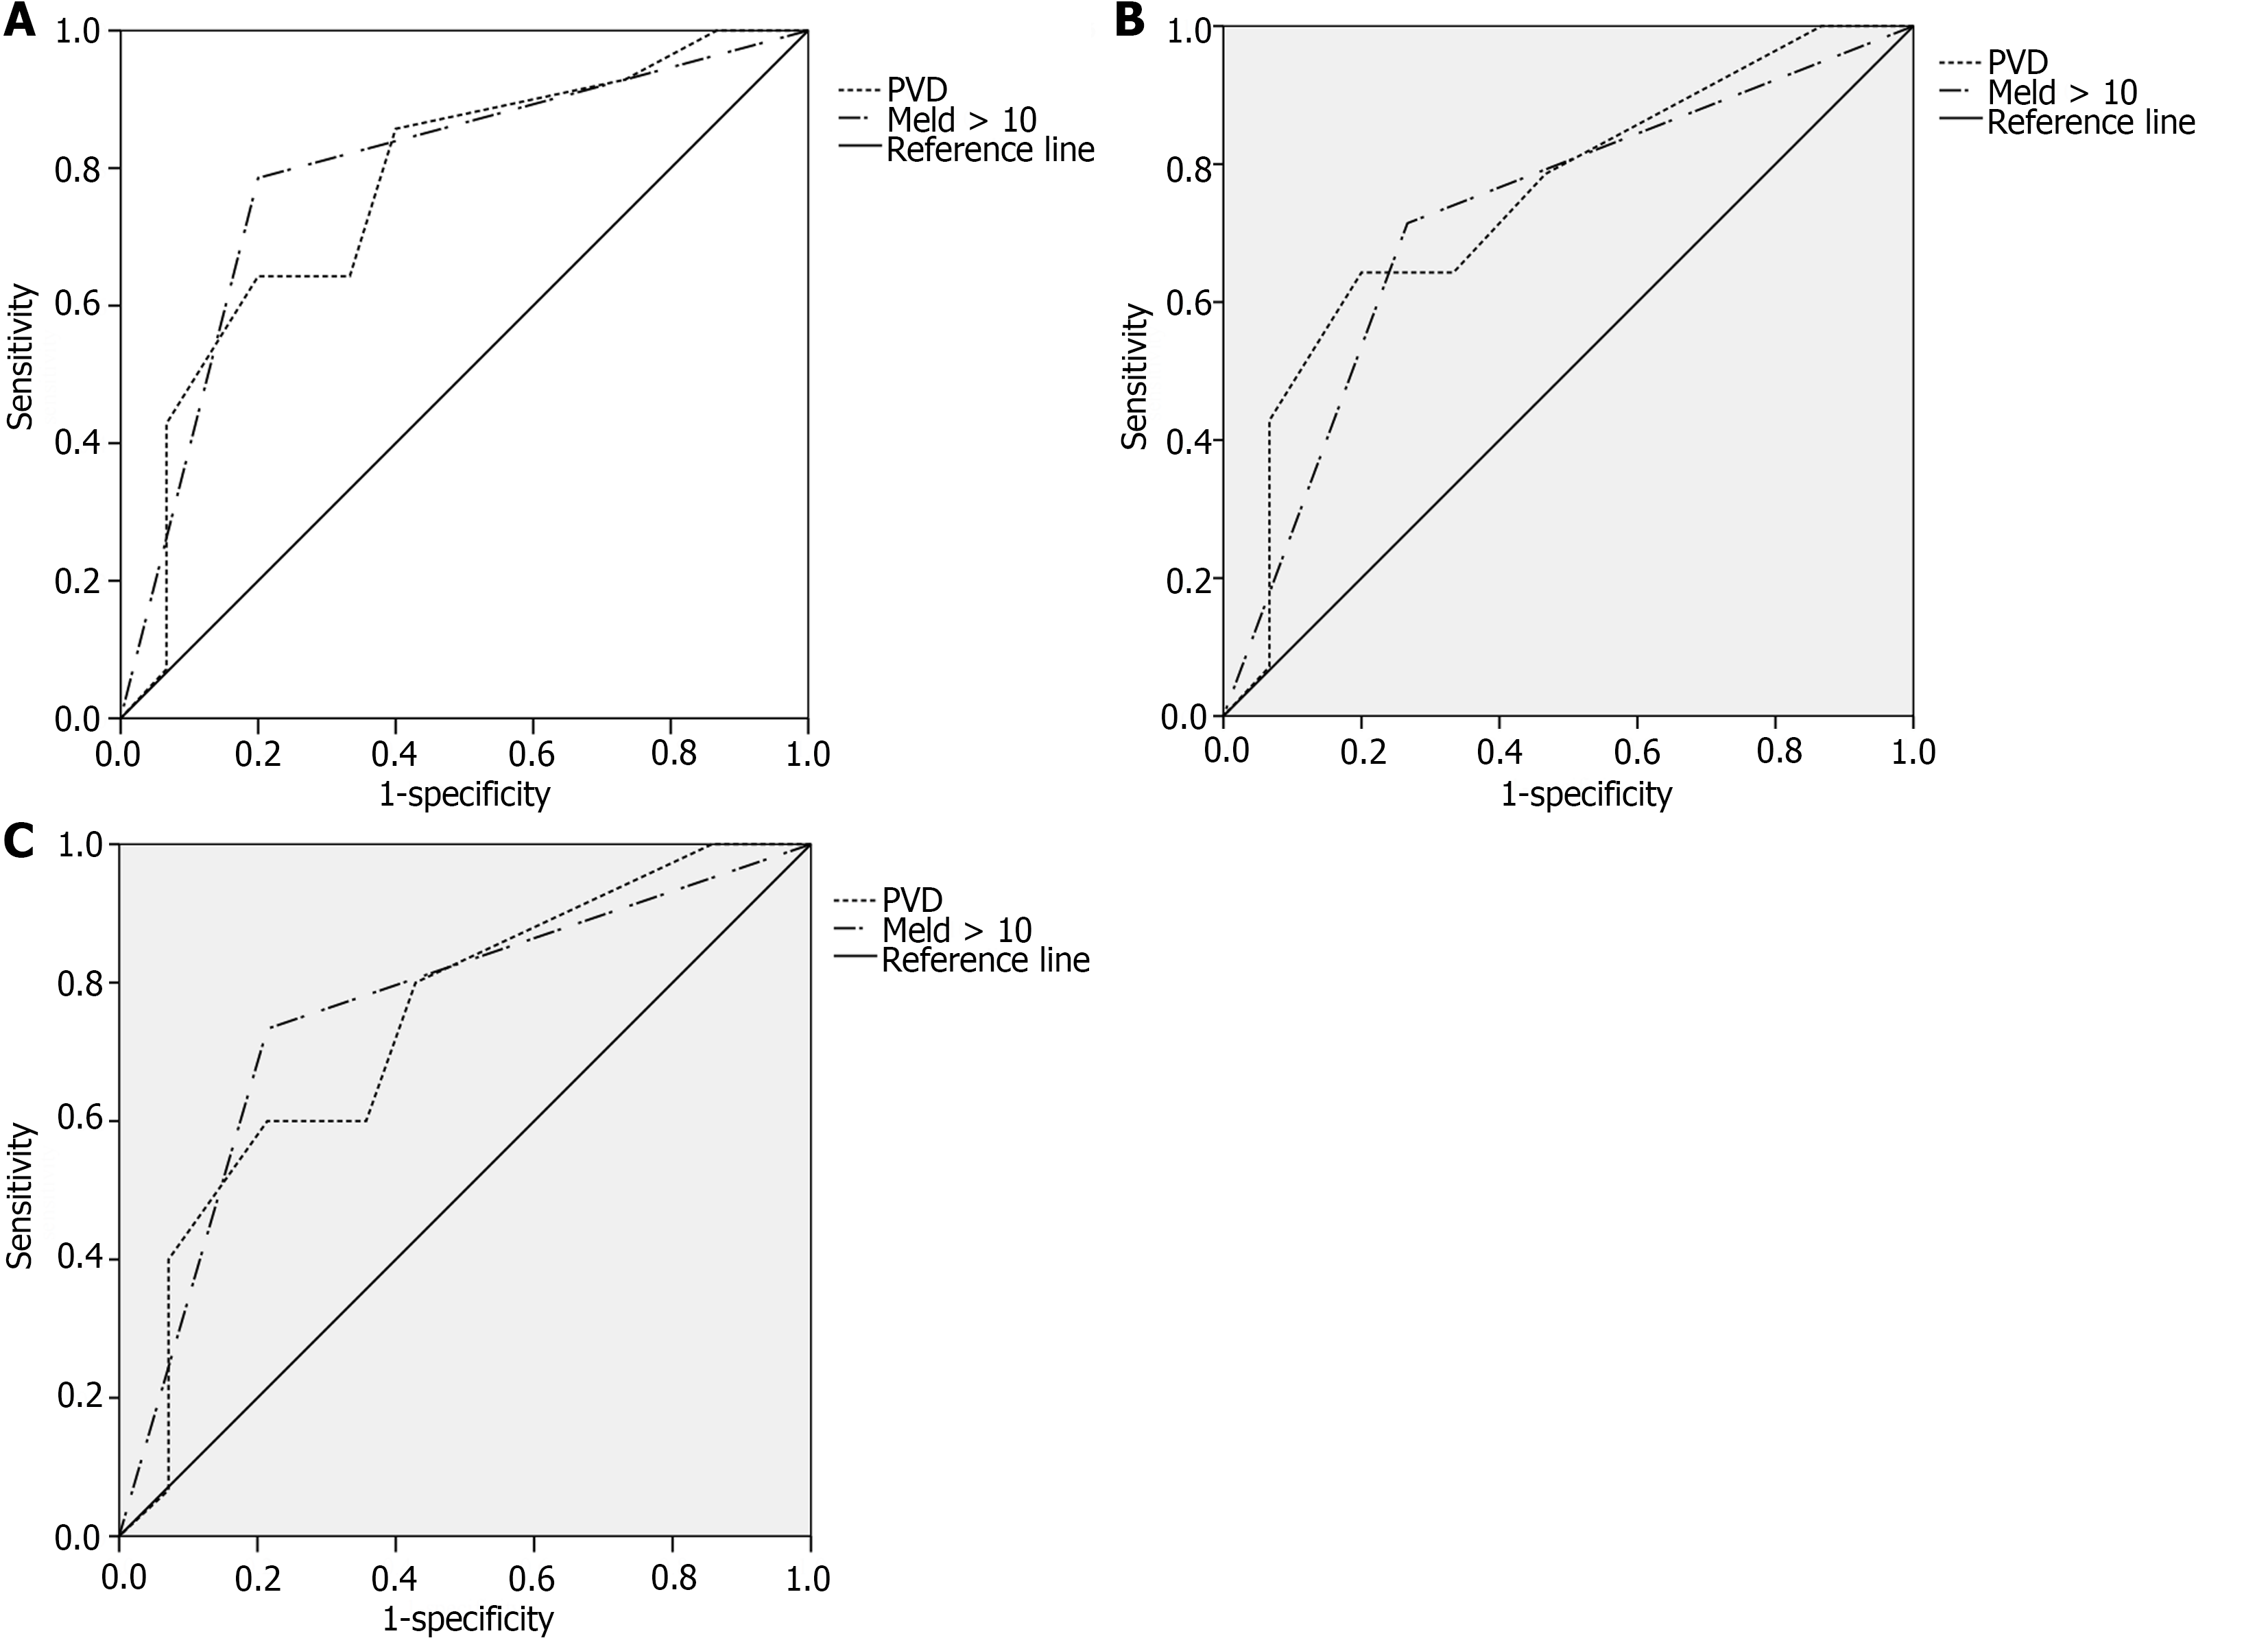
Figure 2 Receiver operating characteristic curve.
A: Receiver operating characteristic (ROC) curve of portal vein thrombosis (PVT) in patients with cirrhosis after splenectomy predicted by independent predictors (postoperative 1 months); B: ROC curve of PVT in patients with cirrhosis after splenectomy predicted by independent predictors (postoperative 3 months); C: ROC curve of PVT in patients with cirrhosis after splenectomy predicted by independent predictors (postoperative 12 months). PVT: Portal vein thrombosis; MELD: Monthsdel end-stage liver disease.
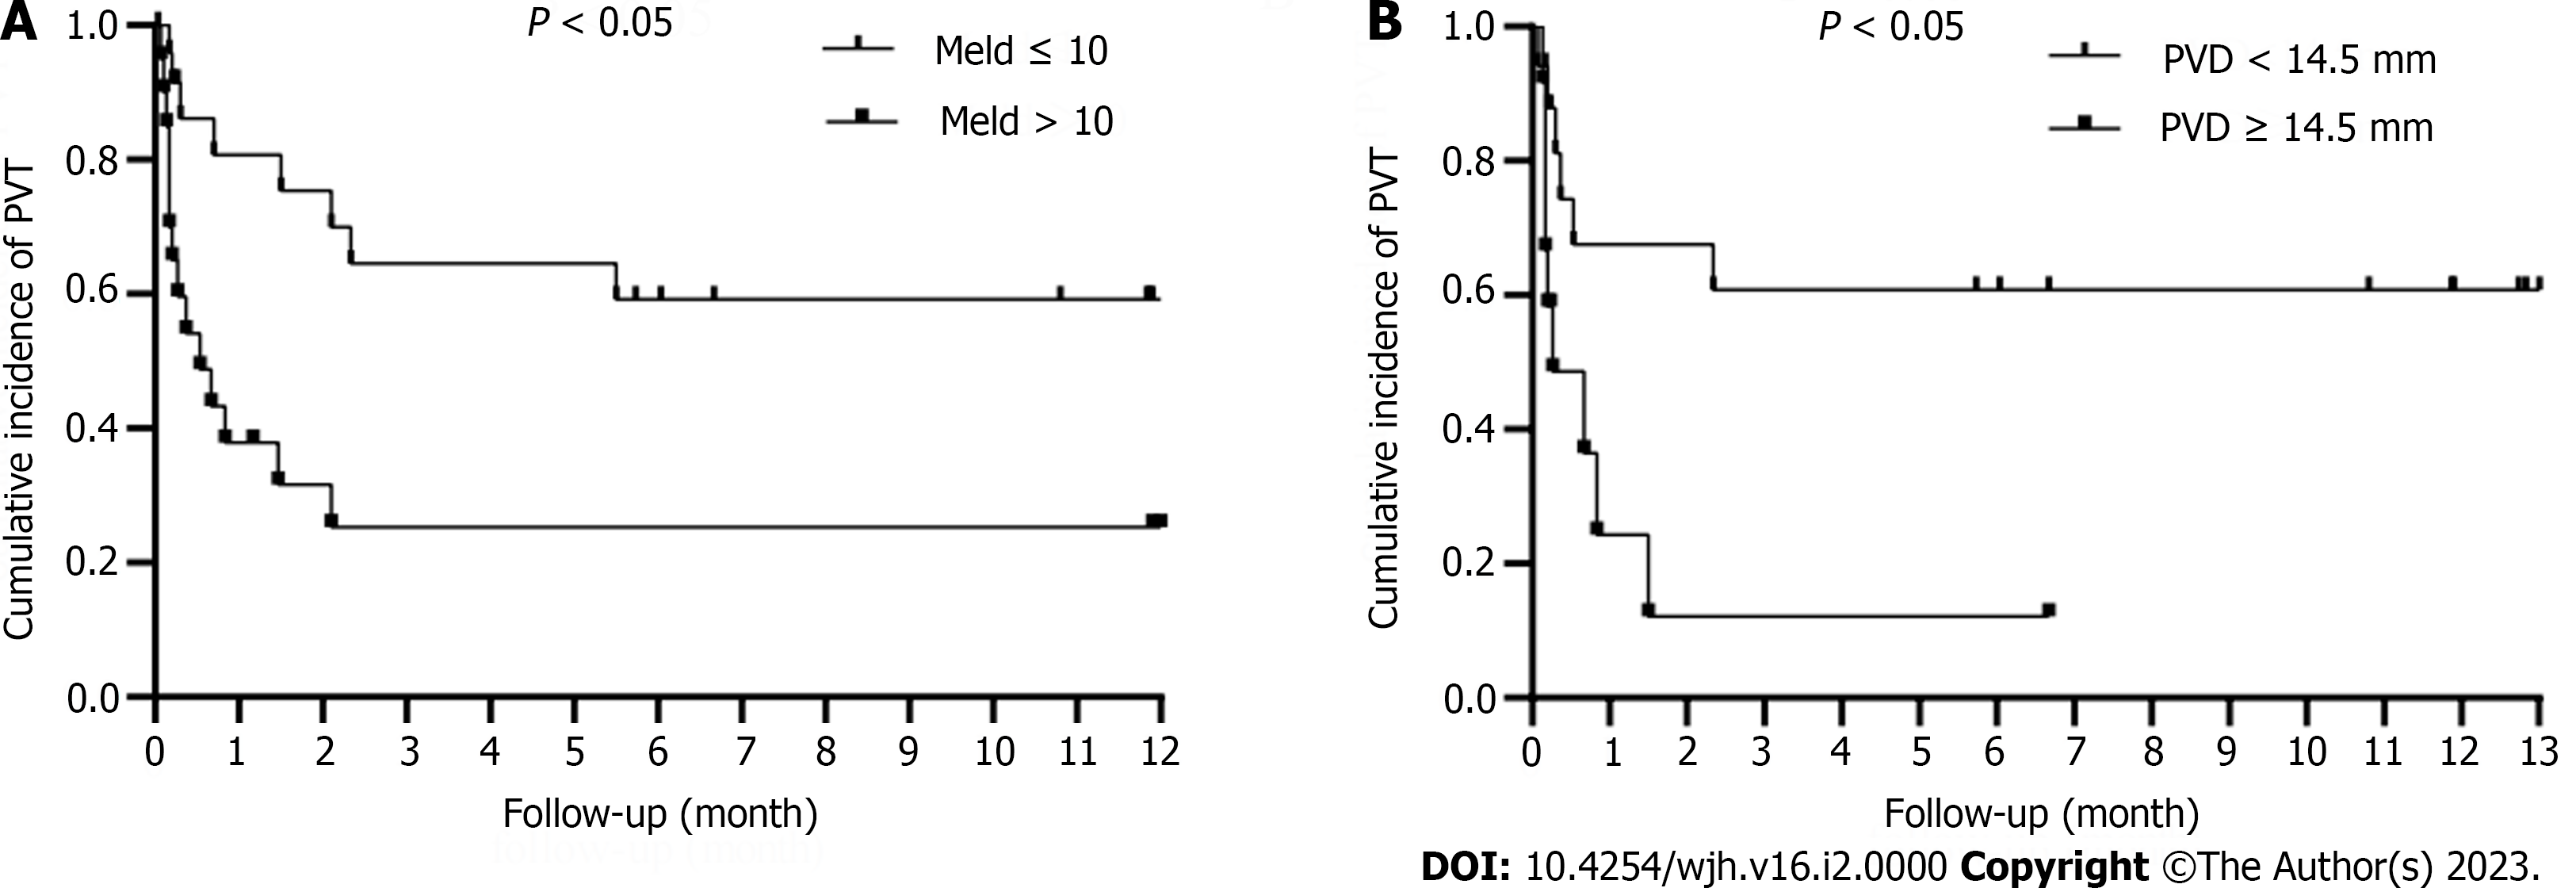
Figure 3 Time-dependent curve analysis.
A: Cumulative incidence of portal vein thrombosis in the groups with monthsdel end-stage liver disease score ≤ 10 and > 10 was significantly different (P < 0.05); B: Cumulative incidence of PVT in patients with portal vein diameter (PVD) < 14.5 mm and PVD ≥ 14.5 mm group was significantly different (P < 0.05). PVT: Portal vein thrombosis; MELD: Monthsdel end-stage liver disease.
- Citation: Li T, Wang LL, Li YP, Gan J, Wei XS, Mao XR, Li JF. Predictors of portal vein thrombosis after splenectomy in patients with cirrhosis. World J Hepatol 2024; 16(2): 241-250
- URL: https://www.wjgnet.com/1948-5182/full/v16/i2/241.htm
- DOI: https://dx.doi.org/10.4254/wjh.v16.i2.241


