Copyright
©The Author(s) 2024.
World J Hepatol. Oct 27, 2024; 16(10): 1188-1198
Published online Oct 27, 2024. doi: 10.4254/wjh.v16.i10.1188
Published online Oct 27, 2024. doi: 10.4254/wjh.v16.i10.1188
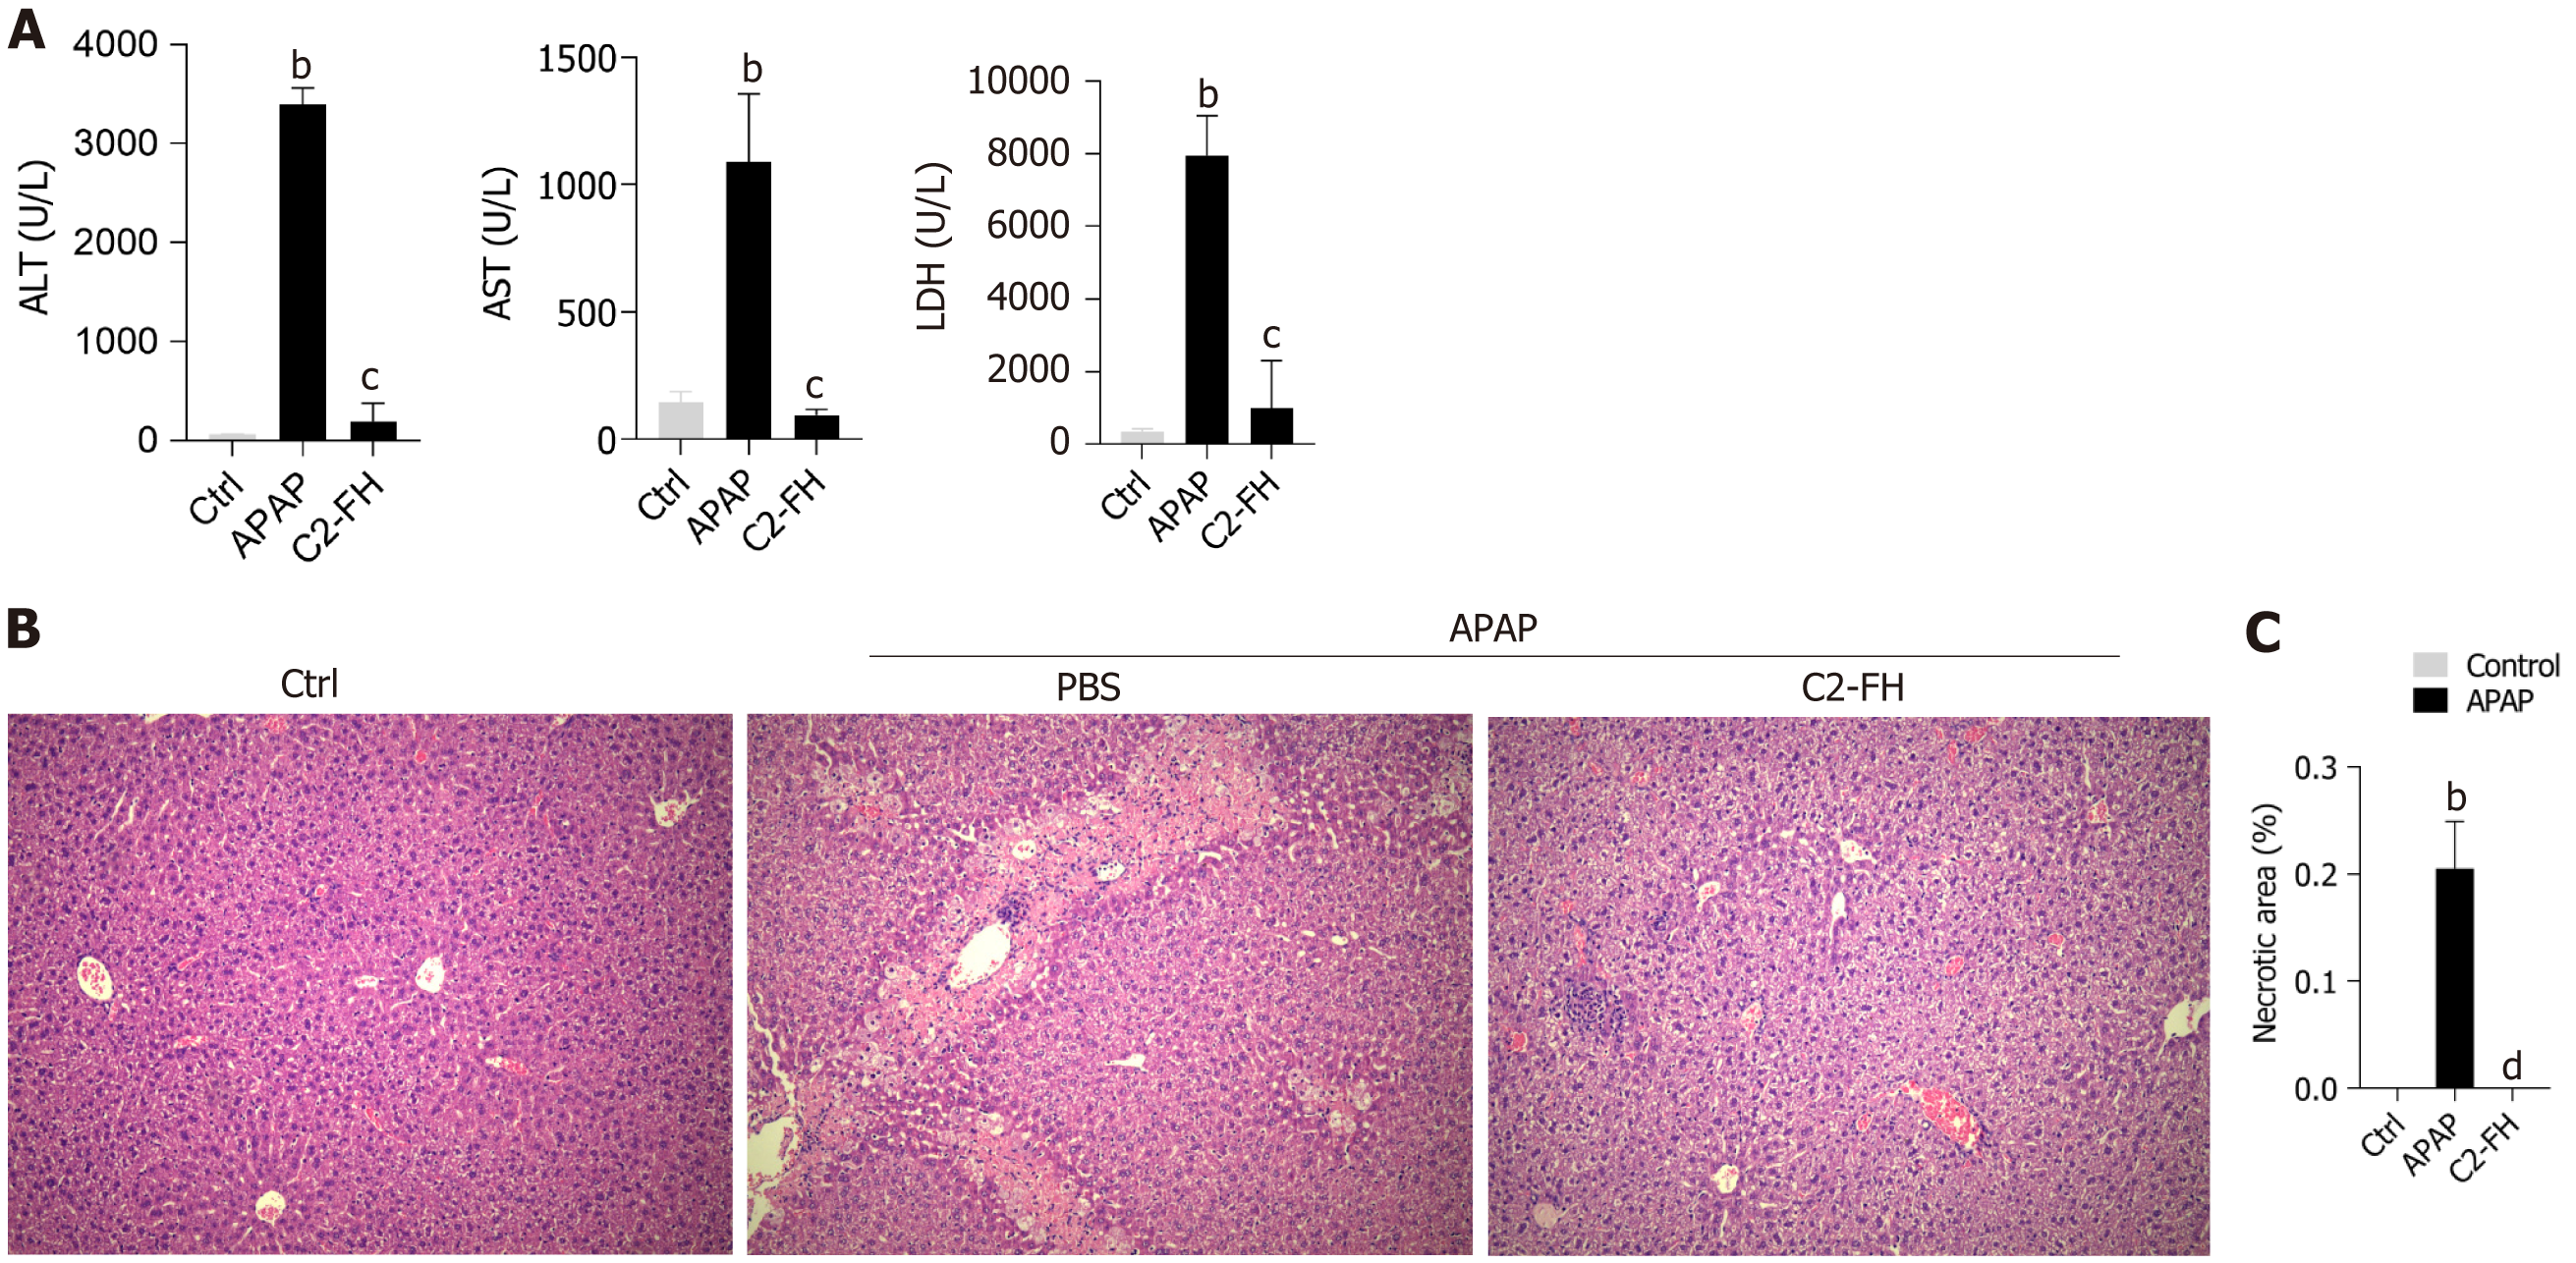
Figure 1 C2-FH protected against acetaminophen-induced liver injury.
Mice were injected with 300 mg/kg acetaminophen (APAP) intraperitoneally for 24 hours. Thirty minutes after APAP injection, 20 μg/mouse of C2-FH was administered. A: Serum alanine aminotransferase activity, aspartate aminotransferase activity and lactate dehydrogenase levels were examined; B: Liver hematoxylin and eosin staining; C: Quantification of necrotic areas in liver tissues. n = 4/5 per group, magnification, 100 ×, scale bars 100 µm. bP < 0.001 Ctrl vs APAP group. cP < 0.001, dP < 0.0001 APAP vs C2-FH group. Ctrl: Control; APAP: Acetaminophen; ALT: alanine aminotransferase; AST: aspartate aminotransferase; LDH: lactate dehydrogenase.
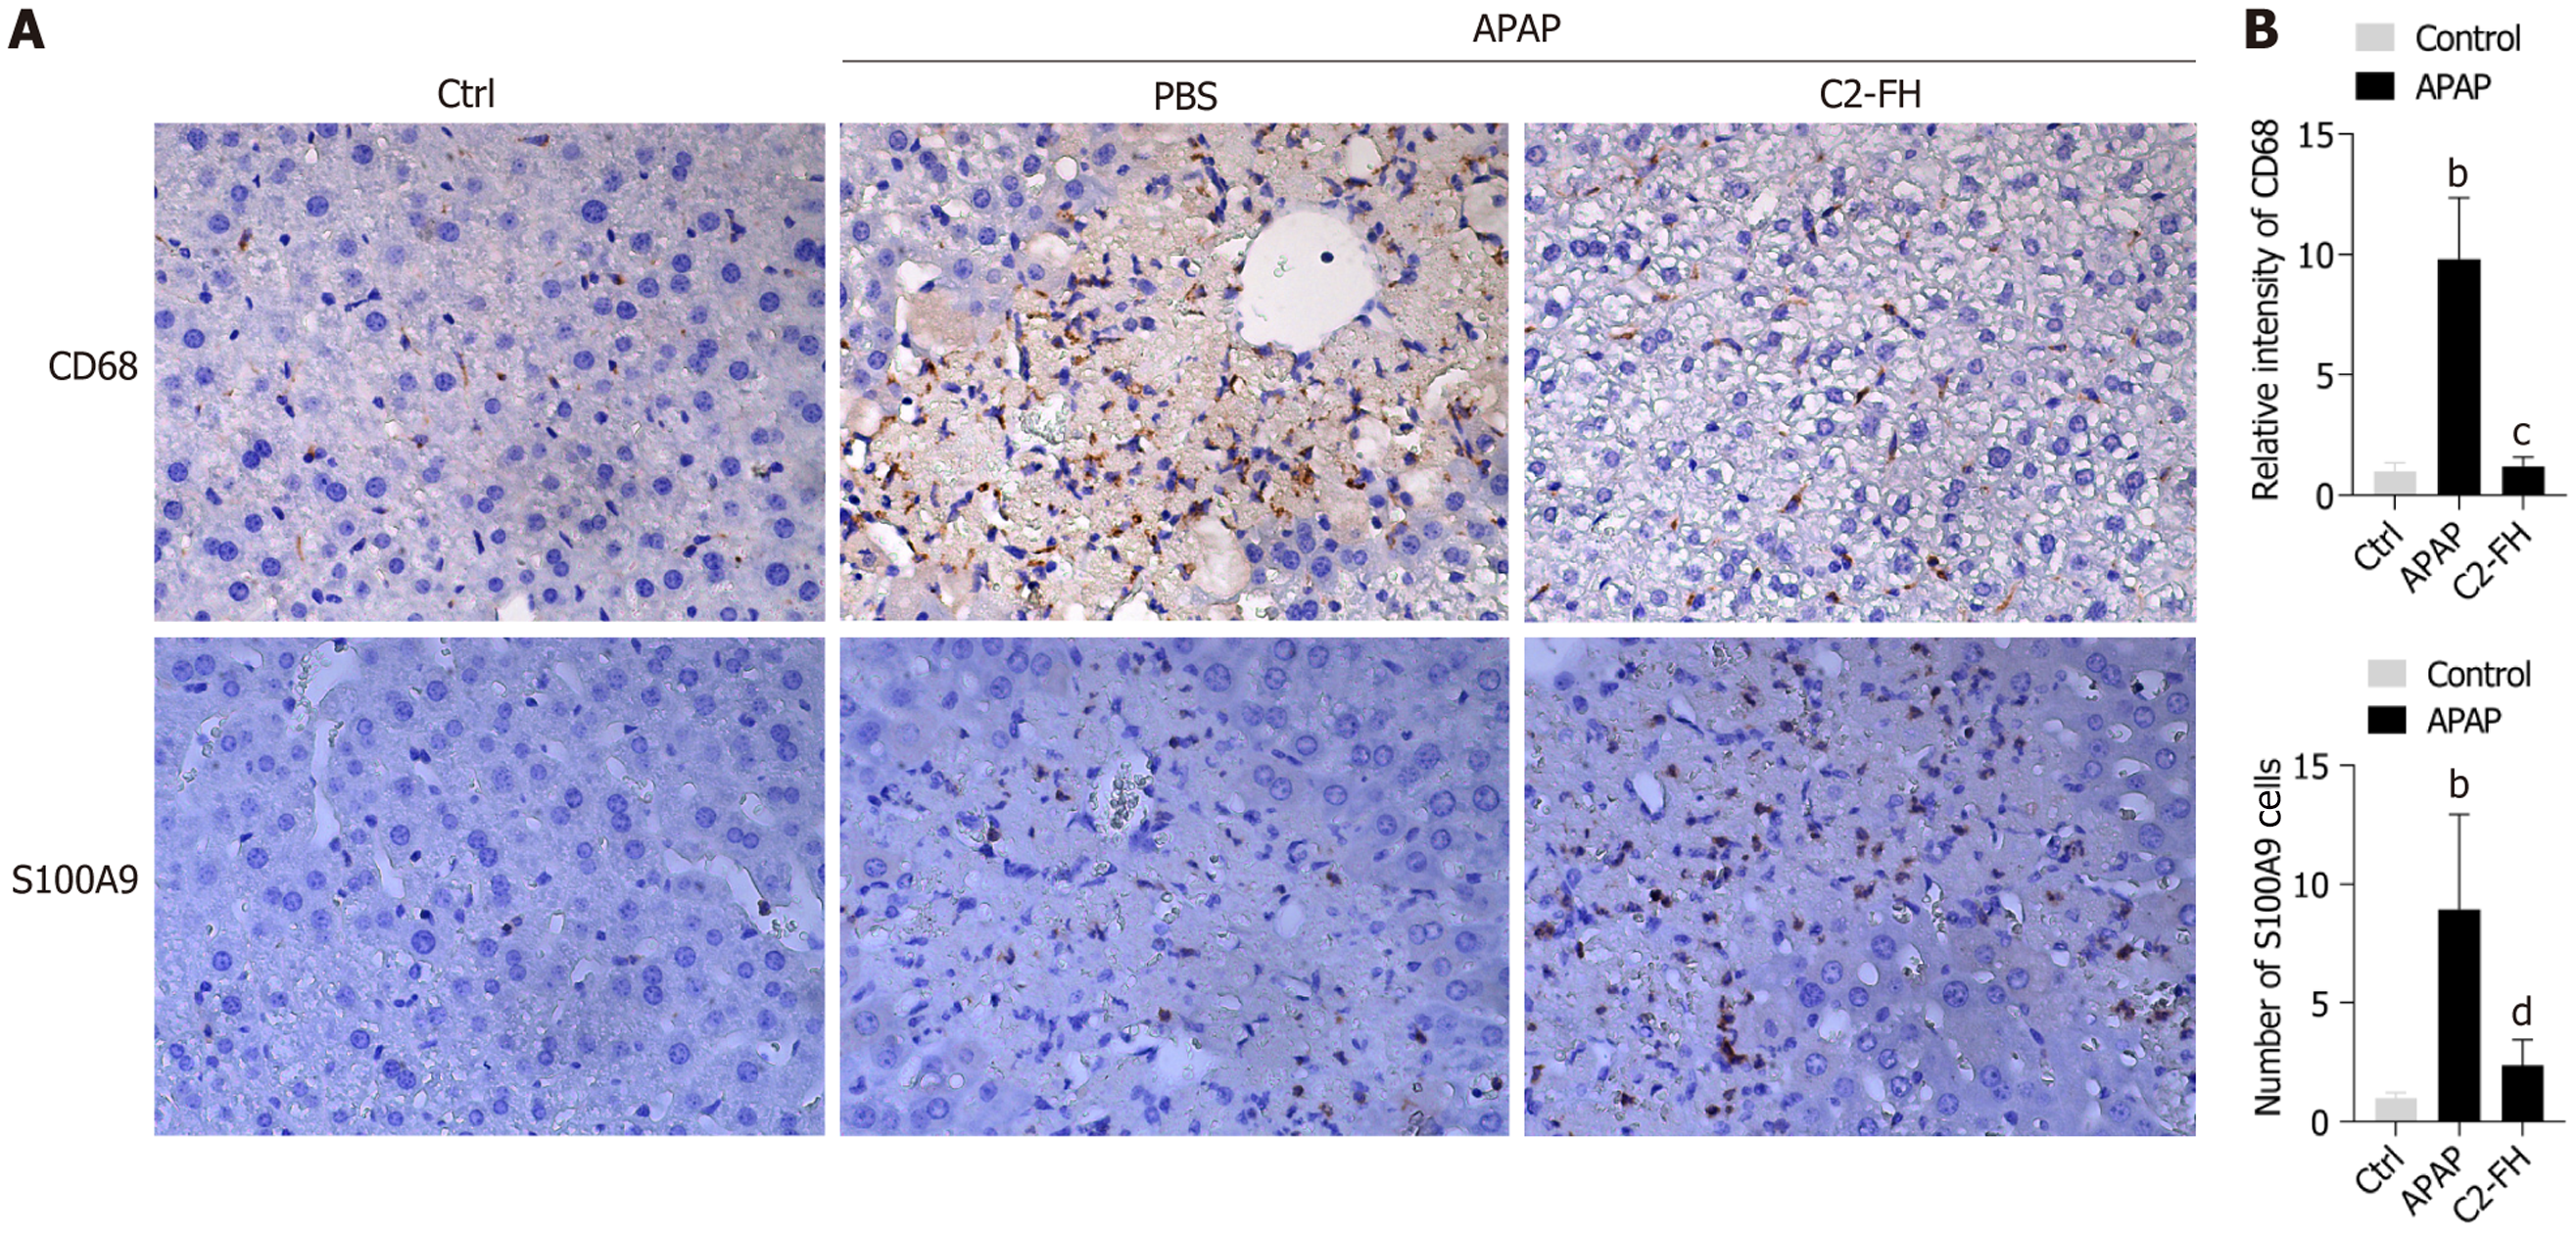
Figure 2 C2-FH improved inflammatory reaction in liver damage induced by acetaminophen.
A: Immunohistochemical staining to detect CD68+ and S100A9+ cells 1 day after acetaminophen was administered; B: Relative intensity of CD68+ cells and number of S100A9+ cells quantified using Image J software. n = 4/5 per group, magnification, 400 ×, scale bars 25 µm. bP < 0.001 Ctrl vs APAP group. cP < 0.001, dP < 0.01 APAP vs C2-FH group. APAP: Acetaminophen.
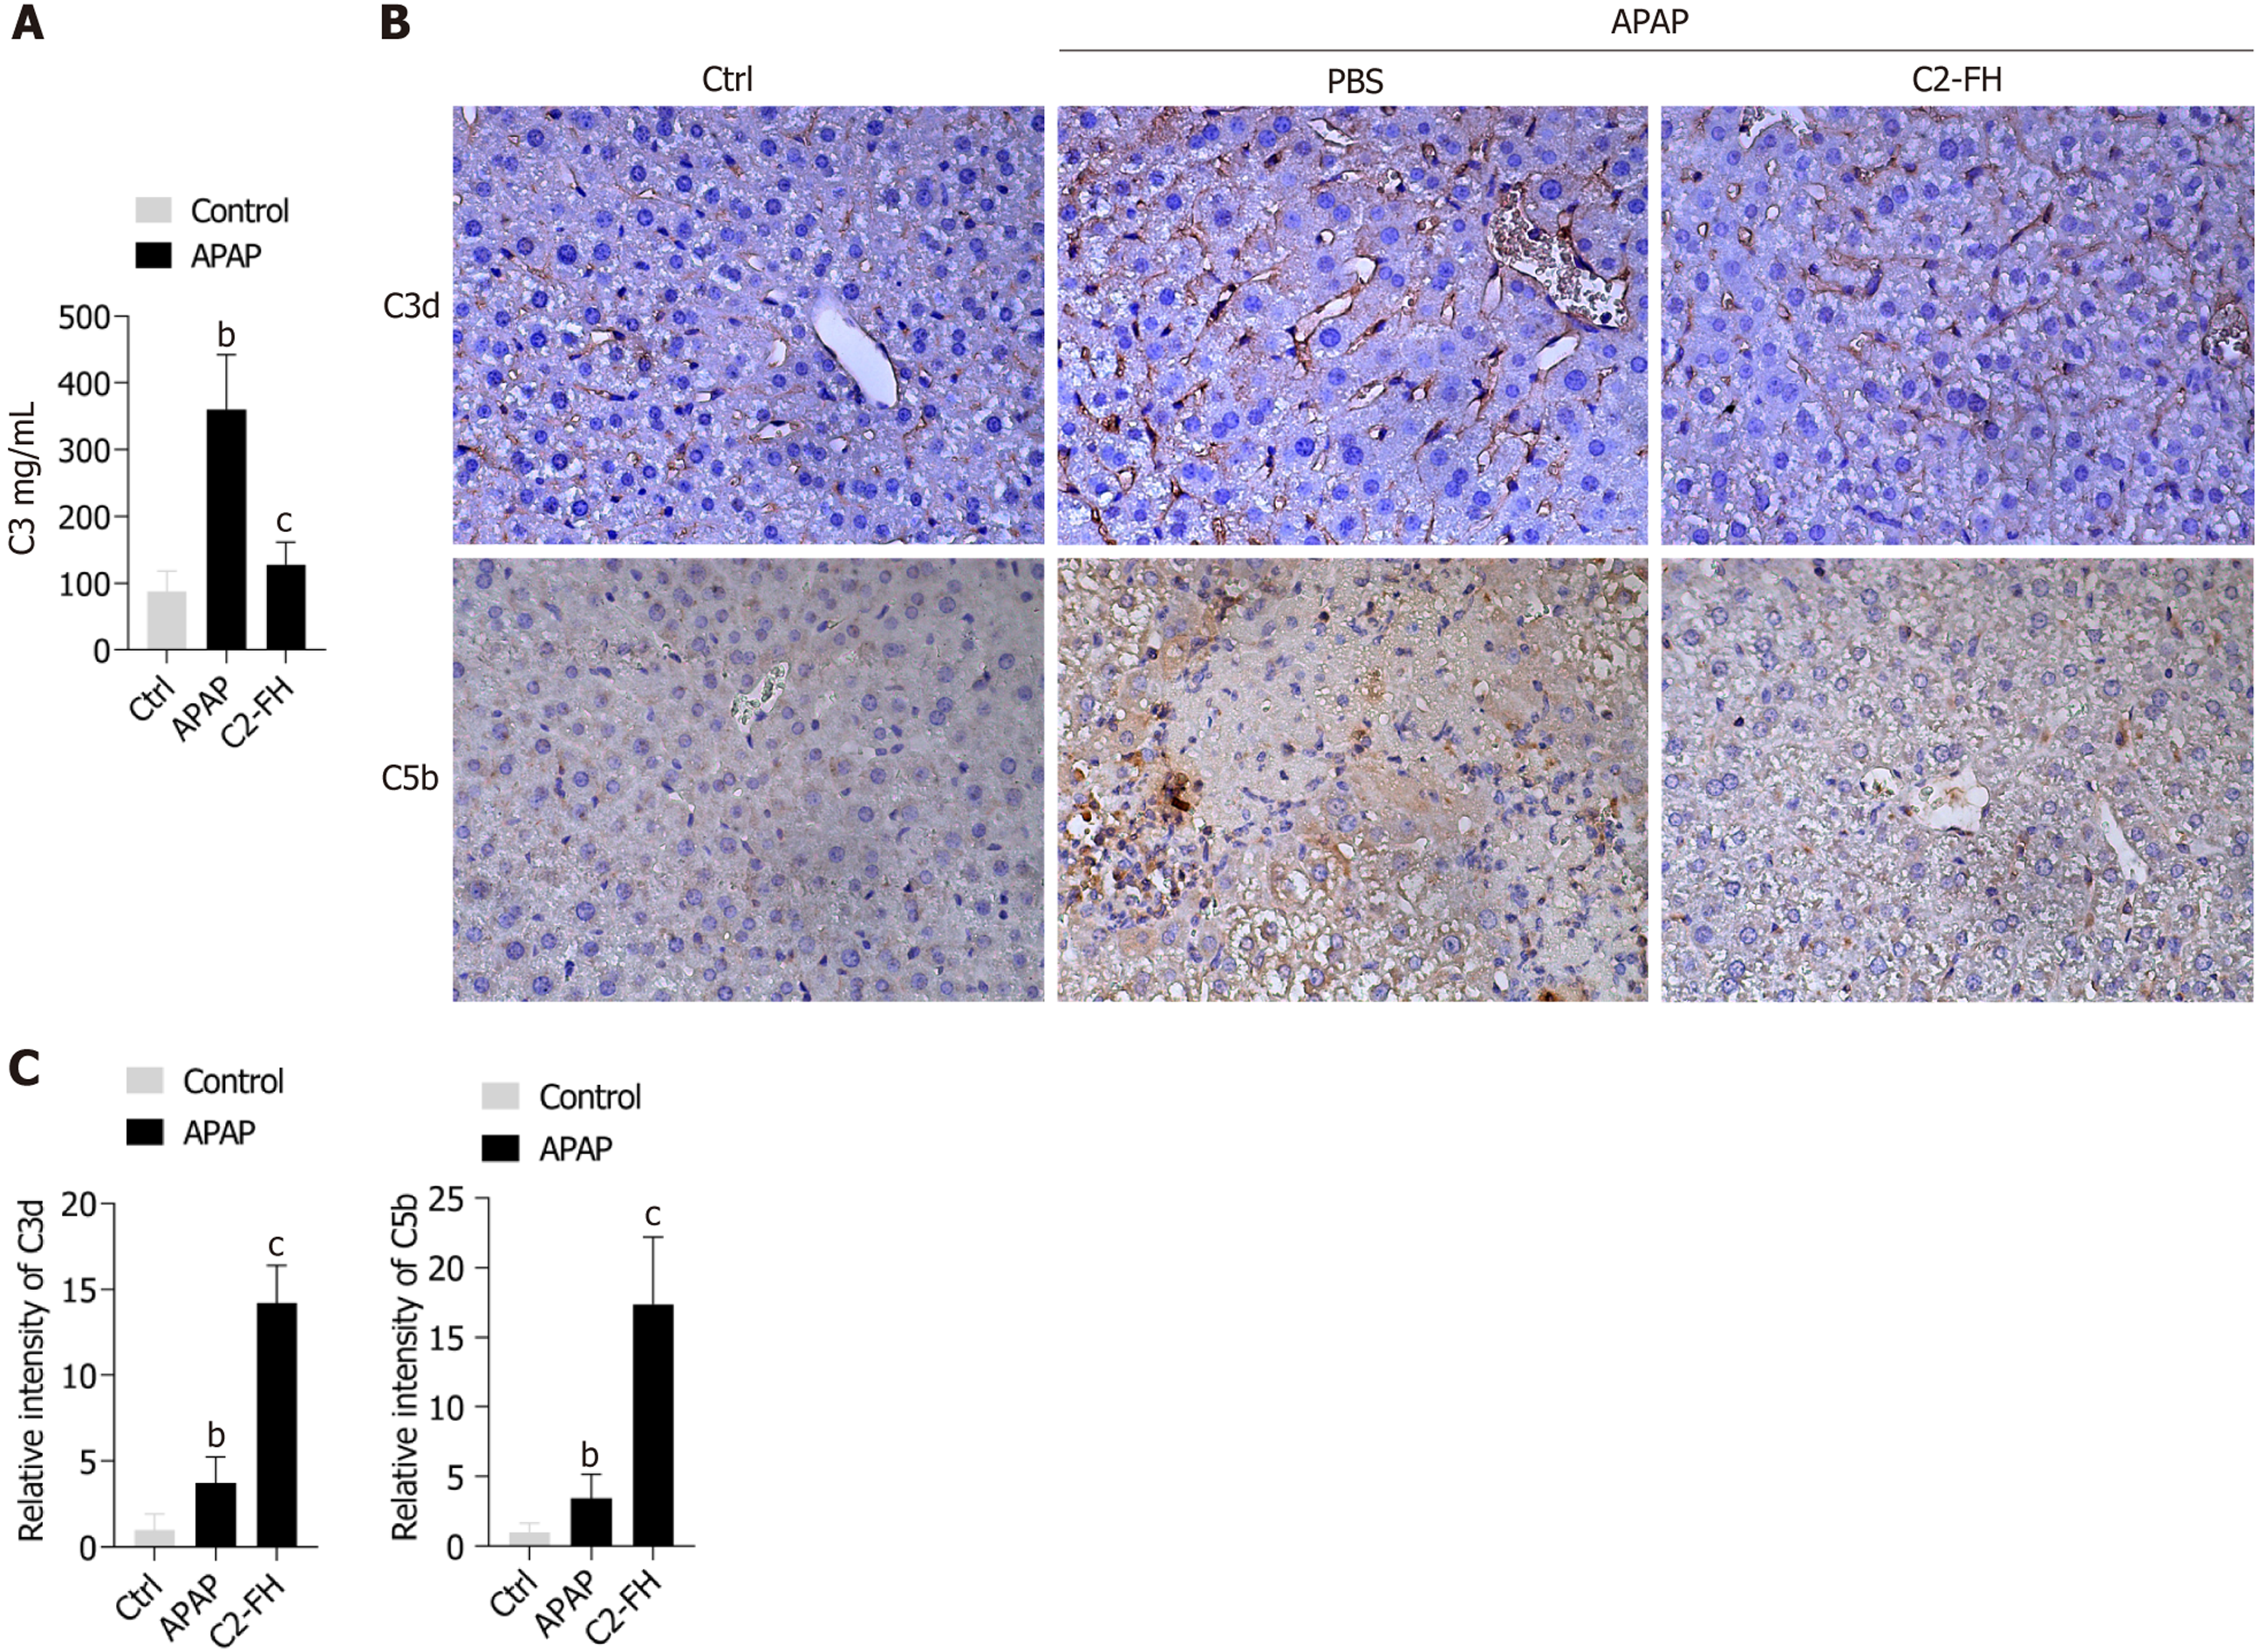
Figure 3 Impact of C2-FH on activation of complement in liver injury induced by acetaminophen.
A: Serum C3 concentration; B: Immunohistochemical analysis to detect C3d and C5b deposition at 24 hours post-acetaminophen treatment; C: Relative intensity of C3d and C5b quantified using Image J software. n = 4/5 per group, magnification, 400 ×, scale bars 25 µm. bP < 0.05 Ctrl vs APAP group. cP < 0.01 APAP vs C2-FH group. APAP: Acetaminophen.
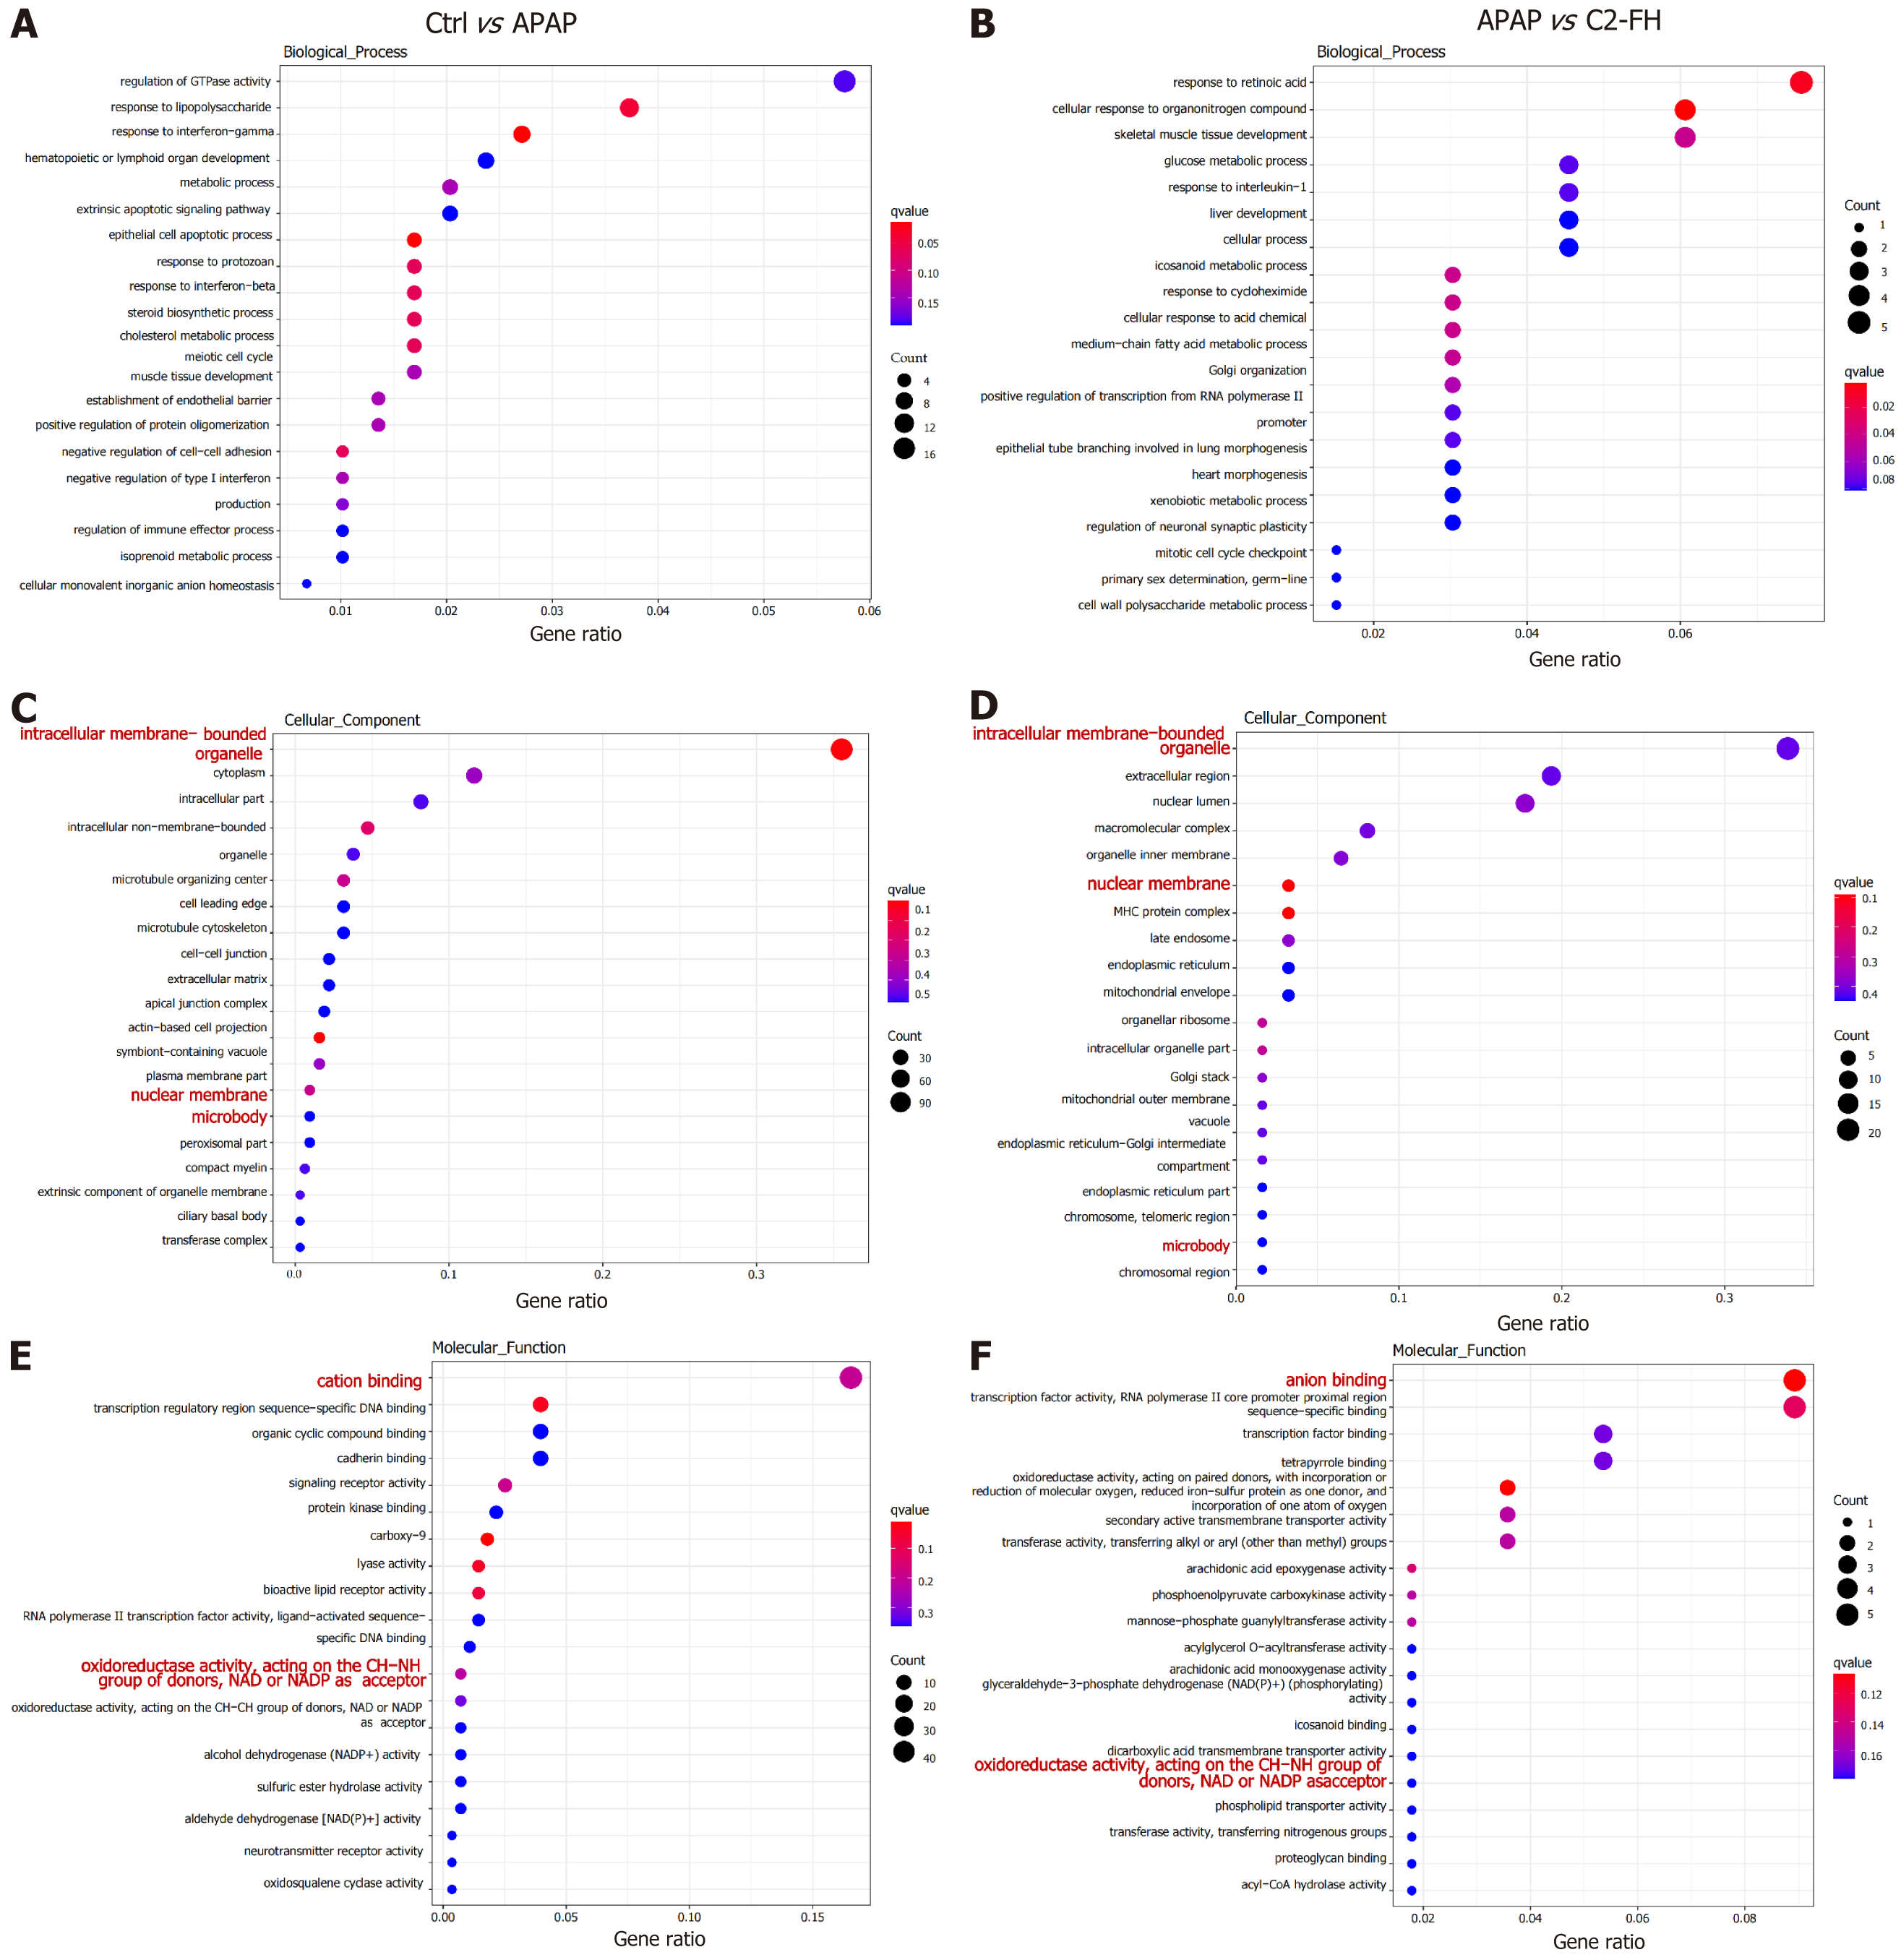
Figure 4 Performing gene ontology enrichment analysis on differentially expressed genes.
A: Bubble diagram in the acetaminophen (APAP) group represented the enriched biological processes (BPs) of upregulated genes compared with the Ctrl group; B: Bubble diagram in the C2-FH group represented the enriched BPs of downregulated genes compared with the APAP group; C: Bubble diagram in the APAP group represented the enriched cellular components (CCs) of upregulated genes compared with the Ctrl group; D: Bubble diagram in the C2-FH group represented the enriched CCs of downregulated genes compared with the APAP group; E: Bubble diagram in the APAP group represented the enriched molecular functions (MFs) of upregulated genes compared with the Ctrl group; F: Bubble diagram in the C2-FH group represented the enriched MFs of downregulated genes compared with the APAP group. n = 3 per group. APAP: Acetaminophen.
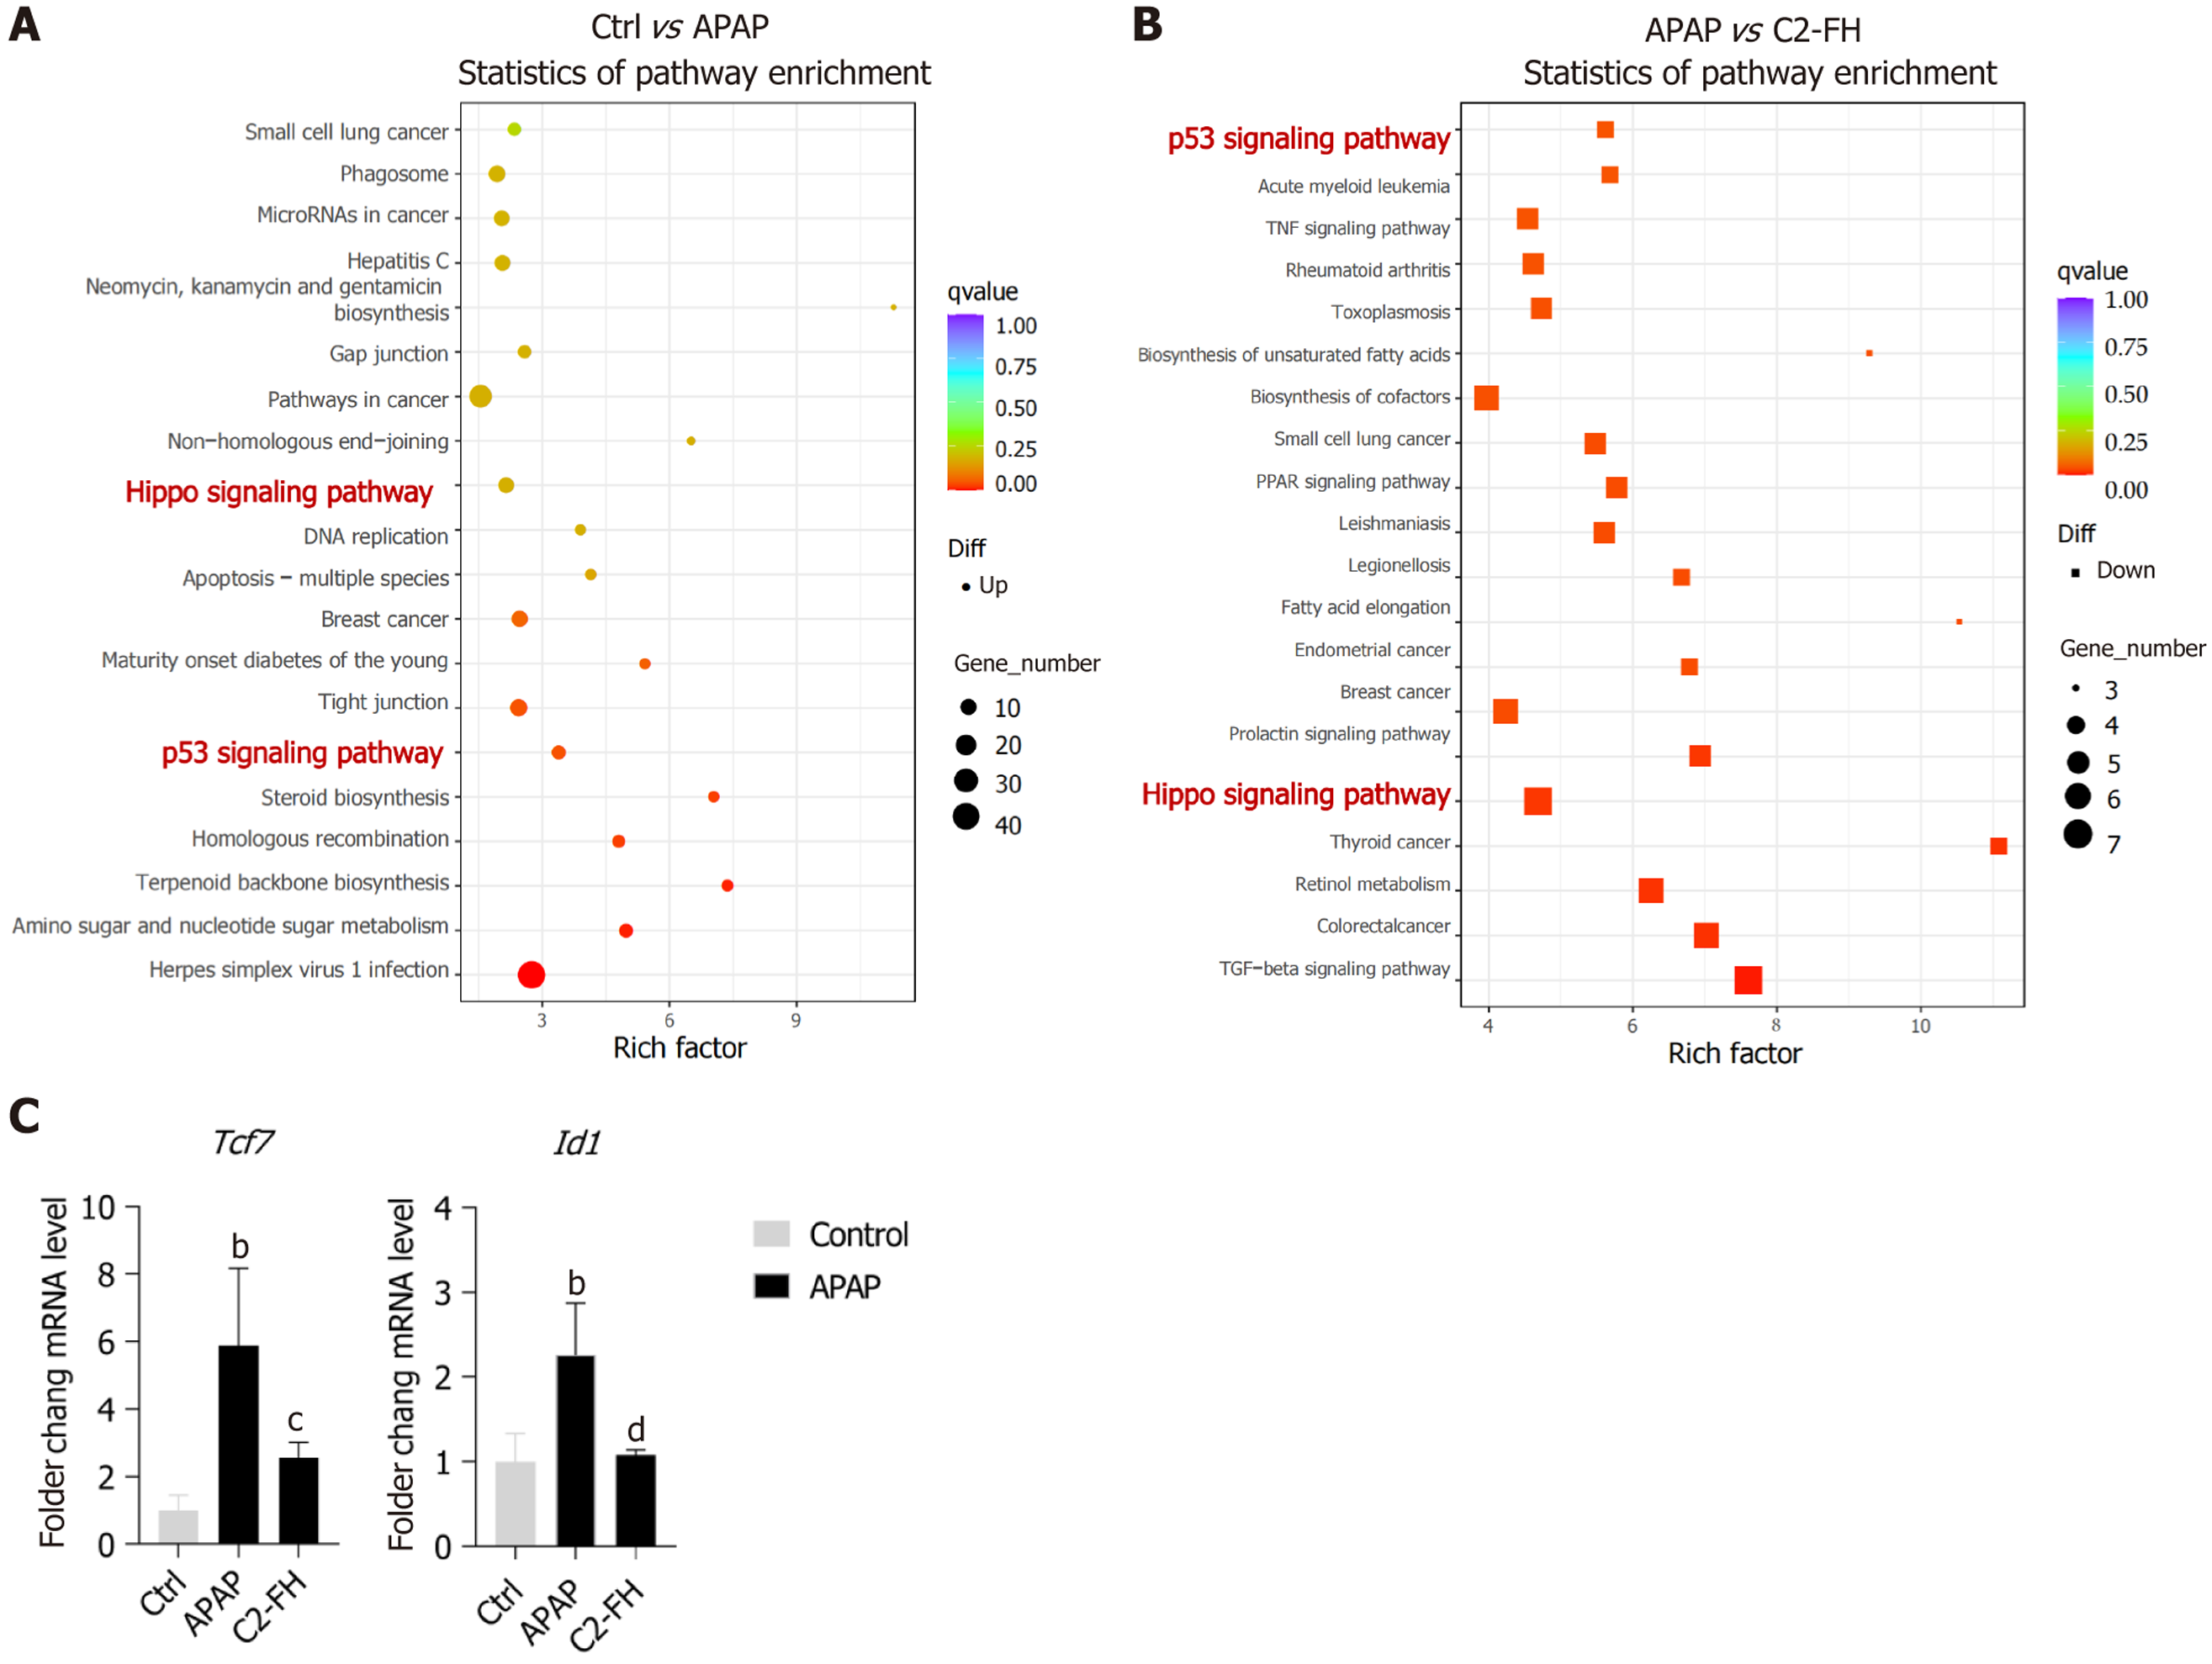
Figure 5 Kyoto encyclopedia of genes and genomes pathway enrichment analysis on differentially expressed genes.
A: Comparing acetaminophen (APAP) group with control group, a scatter plot displays the enrichment of Kyoto encyclopedia of genes and genomes (KEGG) pathways in the upregulated genes; B: Scatter plot of KEGG pathway enrichment of downregulated genes in the C2-FH group compared with the APAP group. Circles or boxes were used to represent upregulated or downregulated genes, respectively. The size of the circle or box is proportional to the number of genes enriched in the pathway, with larger circles indicating a higher number of genes. n = 3 per group; C: mRNA expression of Tcf7 and Id1. n = 4/5 per group. bP < 0.001 Ctrl vs APAP group. cP< 0.01, dP < 0.001 APAP vs C2-FH group. APAP: Acetaminophen.
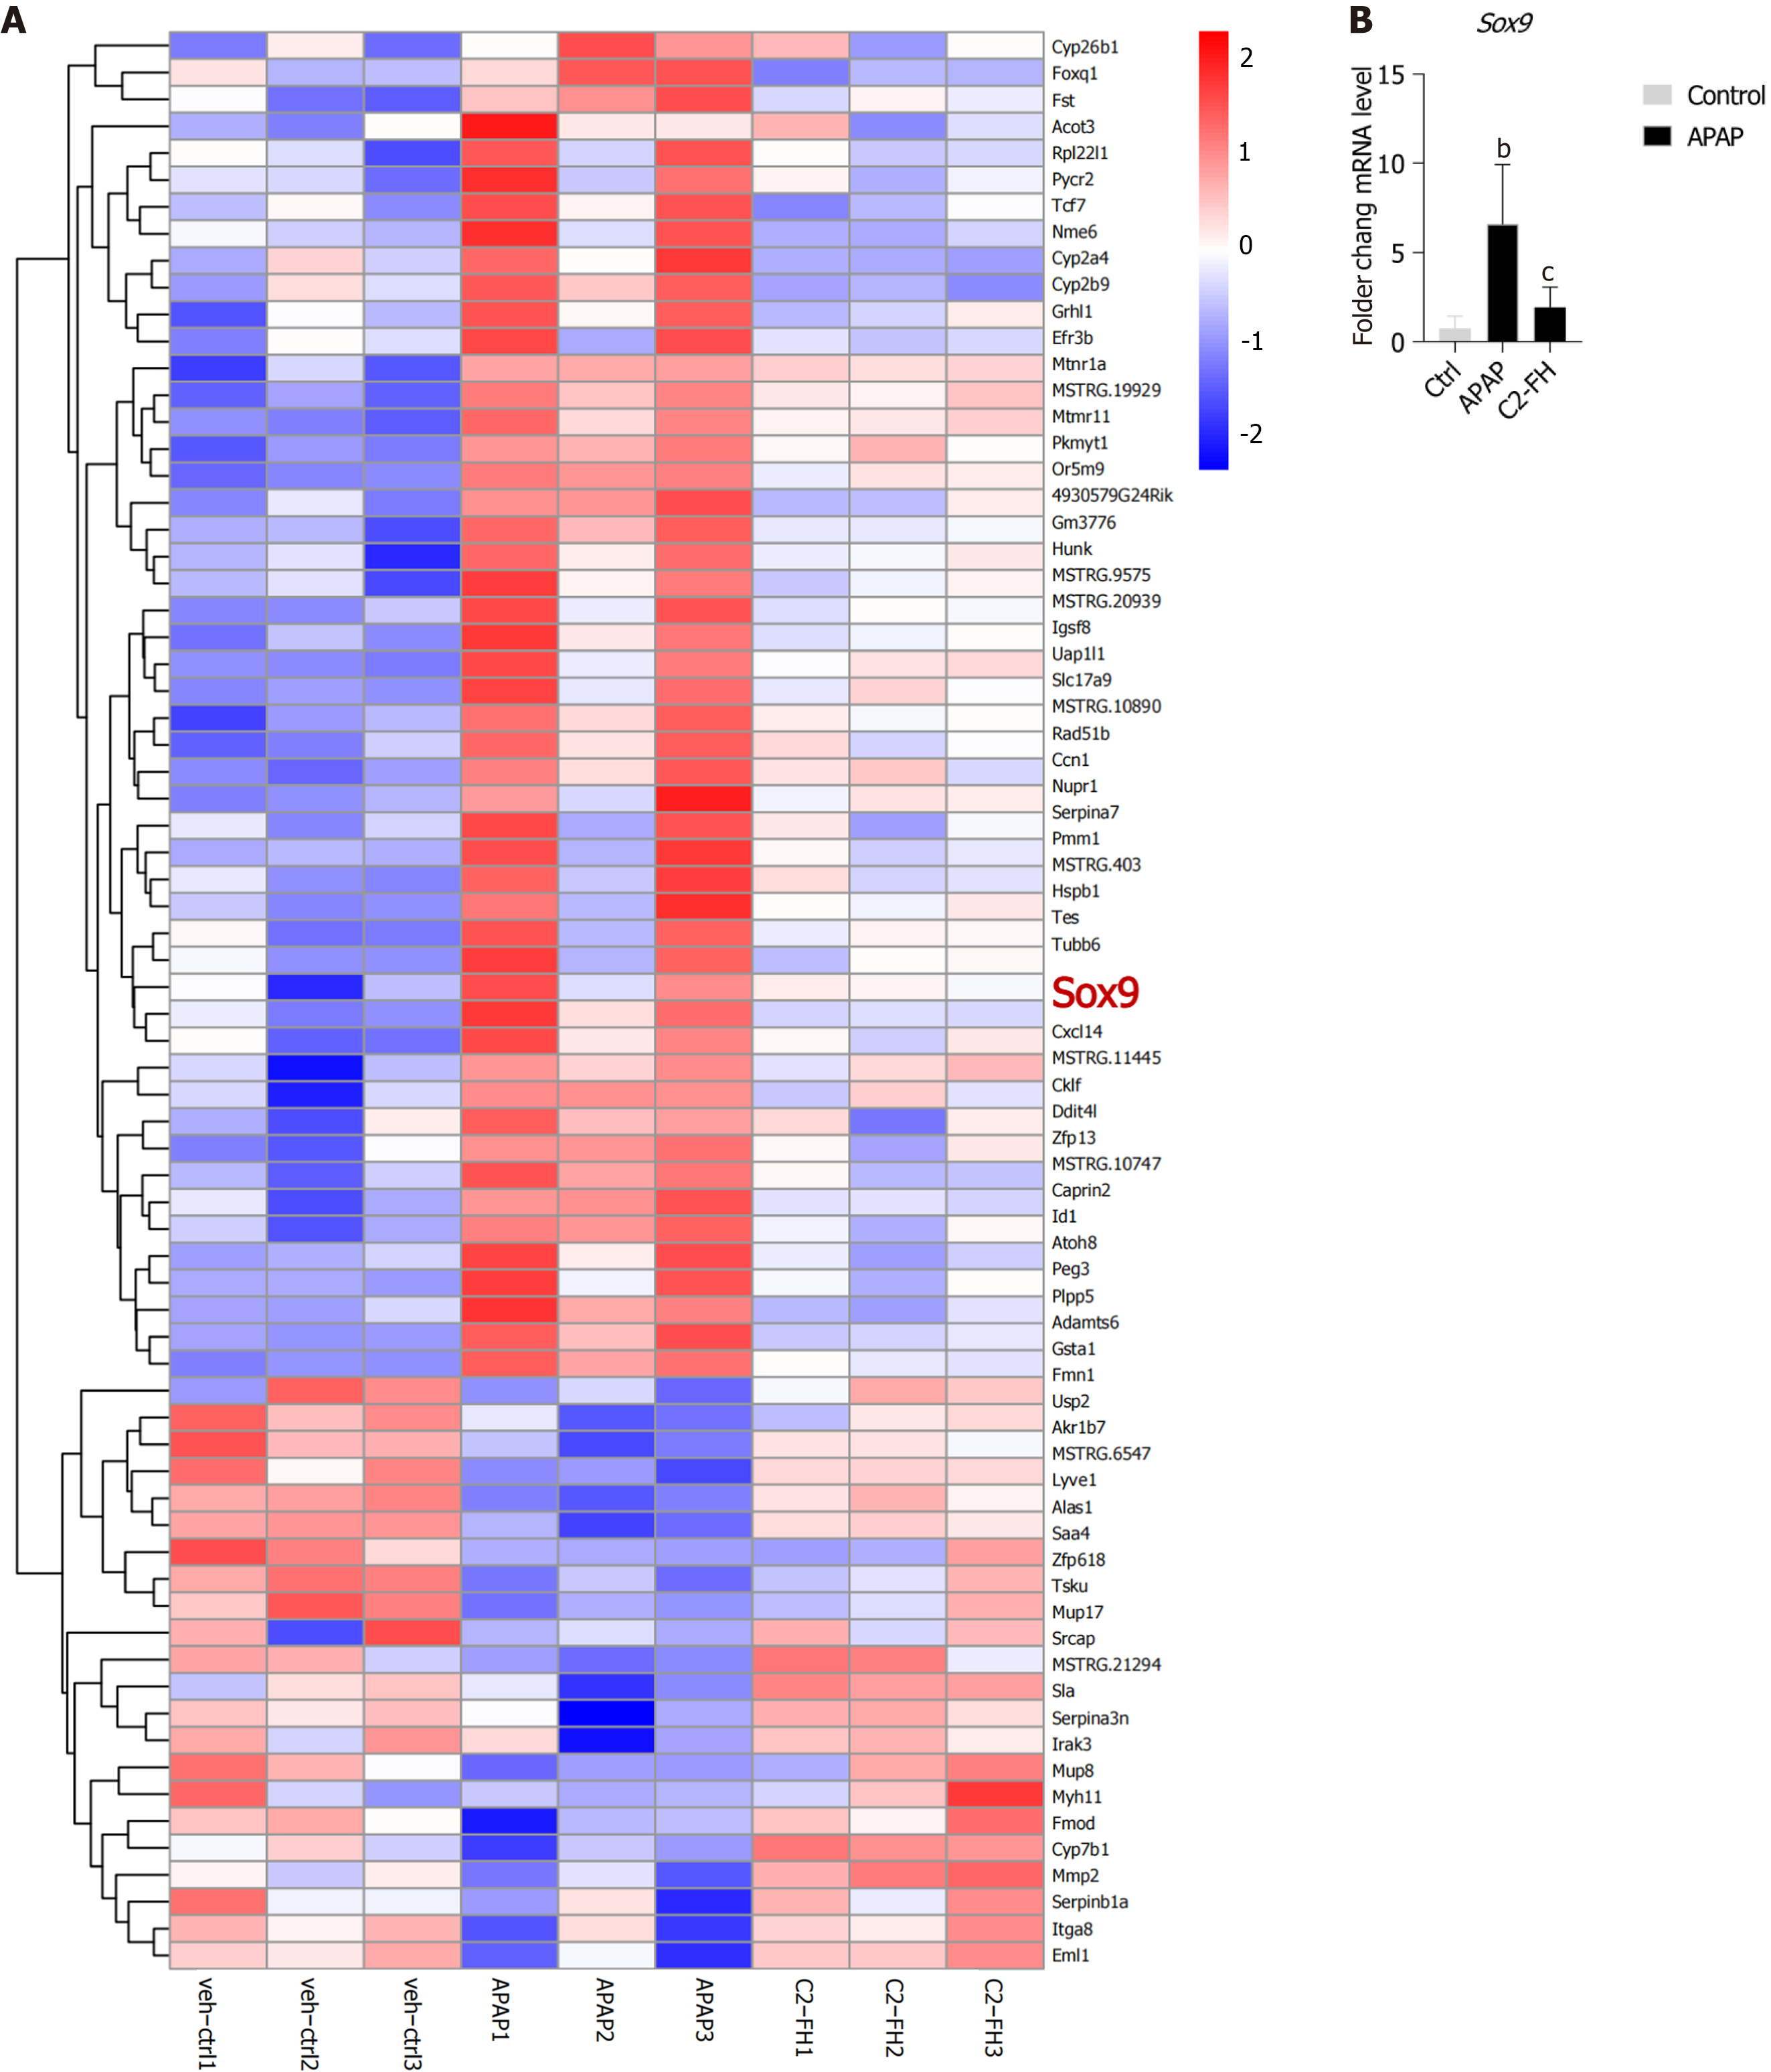
Figure 6 Heat map showing differentially expressed genes.
A: Heat map illustrating differentially expressed genes in the control, acetaminophen and C2-FH groups. Upregulated genes were indicated in red, while downregulated genes were indicated in blue. n = 3 per group; B: mRNA expression of Sox9. n = 4/5 per group. bP < 0.01 Ctrl vs APAP group. cP < 0.001 APAP vs C2-FH group. APAP: Acetaminophen.
- Citation: Li CM, Sun T, Yang MJ, Yang Z, Li Q, Shi JL, Zhang C, Jin JF. Complement activation targeted inhibitor C2-FH ameliorates acetaminophen-induced liver injury in mice. World J Hepatol 2024; 16(10): 1188-1198
- URL: https://www.wjgnet.com/1948-5182/full/v16/i10/1188.htm
- DOI: https://dx.doi.org/10.4254/wjh.v16.i10.1188


