Copyright
©The Author(s) 2018.
World J Hepatol. Jan 27, 2018; 10(1): 82-87
Published online Jan 27, 2018. doi: 10.4254/wjh.v10.i1.82
Published online Jan 27, 2018. doi: 10.4254/wjh.v10.i1.82
Figure 1 Receiver operating characteristic curve analysis of parameters differing significantly in the liver cirrhosis and non-liver cirrhosis groups on multivariate analysis.
The area under the curve of MPV/PLT was the highest. A MPV/PLT ratio of 0.8 had a sensitivity of 65% and a specificity of 78%. MPV/PLT: Mean platelet volume to platelet count; ALT: Alanine aminotransferase; AST: Aspartate aminotransferase; PT: Prothrombin activity.
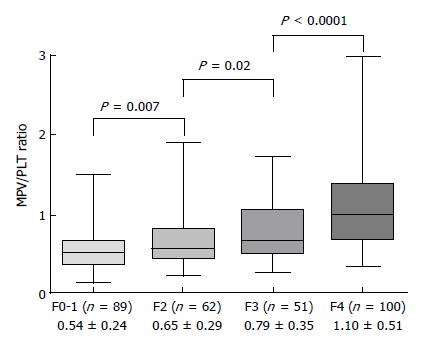
Figure 2 Relationship between MPV/PLT ratio and fibrosis stage.
There were significant differences between each pair of stages. MPV/PLT: Mean platelet volume to platelet count.
- Citation: Iida H, Kaibori M, Matsui K, Ishizaki M, Kon M. Ratio of mean platelet volume to platelet count is a potential surrogate marker predicting liver cirrhosis. World J Hepatol 2018; 10(1): 82-87
- URL: https://www.wjgnet.com/1948-5182/full/v10/i1/82.htm
- DOI: https://dx.doi.org/10.4254/wjh.v10.i1.82


