Copyright
©The Author(s) 2015.
World J Stem Cells. Jan 26, 2015; 7(1): 208-222
Published online Jan 26, 2015. doi: 10.4252/wjsc.v7.i1.208
Published online Jan 26, 2015. doi: 10.4252/wjsc.v7.i1.208
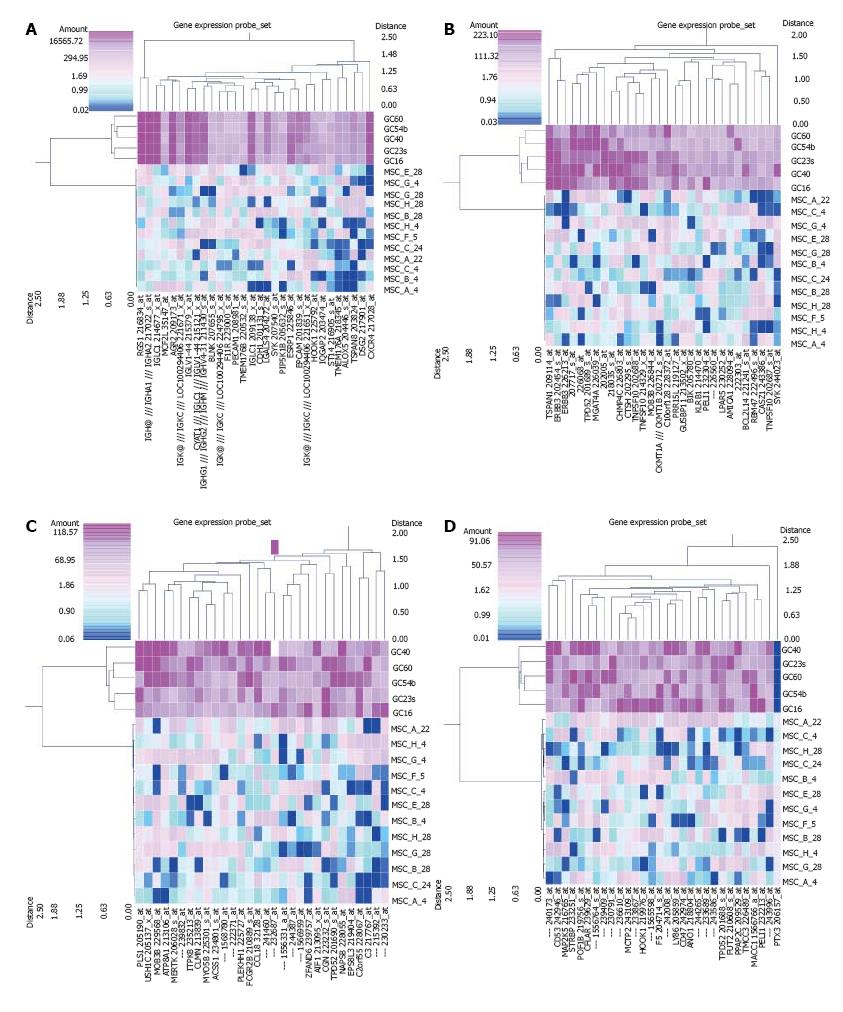
Figure 1 Genes regulated in mesenchymal stem cells and diffuse-type gastric cancer.
A total of 120 probe sets that had more than a 50-fold change in mesenchymal stem cells (MSCs) and diffuse-type gastric cancer (GC) are shown. Each panel (A to D) shows 30 probe sets up-regulated or down-regulated in diffuse-type GC compared with MSCs. (Fold change > 50, P < 0.01 and P < 10-9 using Student’s t test in the non-equal variance hypothesis and equal variance hypothesis, respectively).
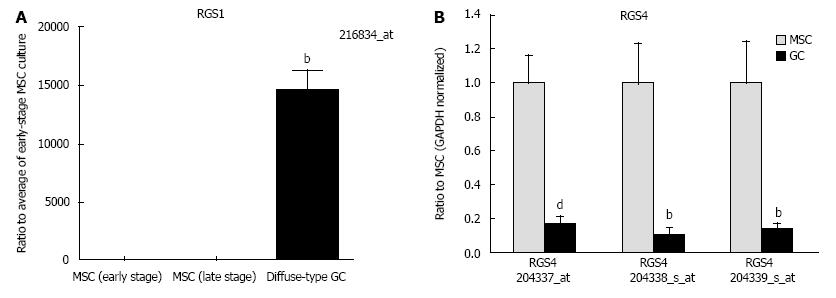
Figure 2 Regulator of G-protein signaling 1 and regulator of G-protein signaling 4 gene expression was up-regulated and down-regulated, respectively, in diffuse-type gastric cancer.
A: regulator of G-protein signaling 1 (RGS1) gene expression was up-regulated in diffuse-type gastric cancer (GC) compared with early-stage mesenchymal stem cell (MSC) cultures [n = 5 in early-stage MSC cultures (B#4, C#4, F#5, G#4, and H#4), n = 5 in late-stage MSC cultures (B#28, C#24, E#28, G#28, and H#28), and n = 5 in diffuse-type GC (GC16, GC40, GC54b, GC60, and GC23s)]. Results represent the mean ± SE. bP < 0.01 using a one-way analysis of variance with Bonferroni’s multiple comparisons test; B: RGS4 gene expression was down-regulated in diffuse-type GC compared with MSCs. Results represent the mean ± SE (n = 12 in MSC cultures and n = 5 in diffuse-type GC). bP < 0.01 and dP < 0.001 using Student’s t test with the non-equal variance hypothesis.
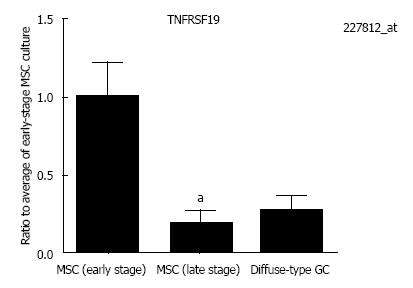
Figure 3 Tumor necrosis factor receptor superfamily, member 19 gene expression.
Tumor necrosis factor receptor superfamily, member 19 (TNFRSF19) gene expression tended to decrease in diffuse-type gastric cancer (GC) but was not significantly altered compared with early-stage mesenchymal stem cell (MSC) cultures. TNFRSF19 gene expression in late-stage MSC cultures was significantly down-regulated compared with early-stage MSC cultures. Results represent the mean ± SE [n = 5 in early-stage MSC cultures (B#4, C#4, F#5, G#4, and H#4), n = 5 in late-stage MSC cultures (B#28, C#24, E#28, G#28, and H#28), and n = 5 in diffuse-type GC (GC16, GC40, GC54b, GC60, and GC23s)]. aP < 0.05 using a one-way ANOVA with Bonferroni’s multiple comparisons test.
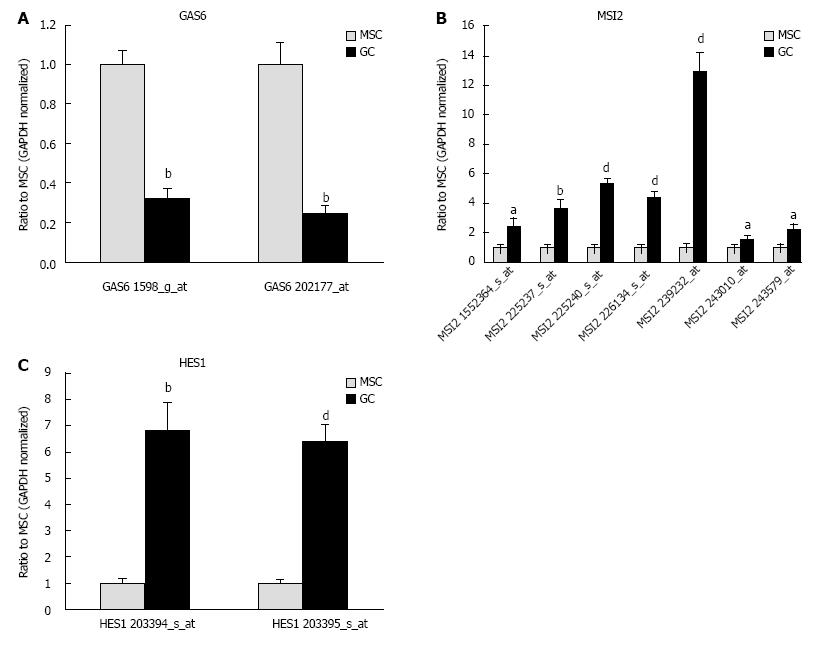
Figure 4 Gene expression of stem cell-related genes.
A: The gene expression of growth arrest-specific 6 (GAS6) was down-regulated in diffuse-type gastric cancer (GC) compared with mesenchymal stem cell (MSCs). Results represent the mean ± SE (n = 12 in MSC and n = 5 in diffuse-type GC). bP < 0.001 using Student’s t test; B: The gene expression of musashi RNA-binding protein 2 (MSI2) was up-regulated in diffuse-type GC compared with MSCs. Results represent the mean ± SE (n = 12 in MSC and n = 5 in diffuse-type GC). aP < 0.05, bP < 0.01, and dP < 0.001 using Student’s t test; C: The gene expression of hairy and enhancer of split 1 (Drosophila) (HES1) was up-regulated in diffuse-type GC compared with MSCs. Results represent the mean ± SE (n = 12 in MSC and n = 5 in diffuse-type GC). bP < 0.01 and dP < 0.001 using Student’s t test. All three genes have stem cell terms in the Gene Ontology biological process.
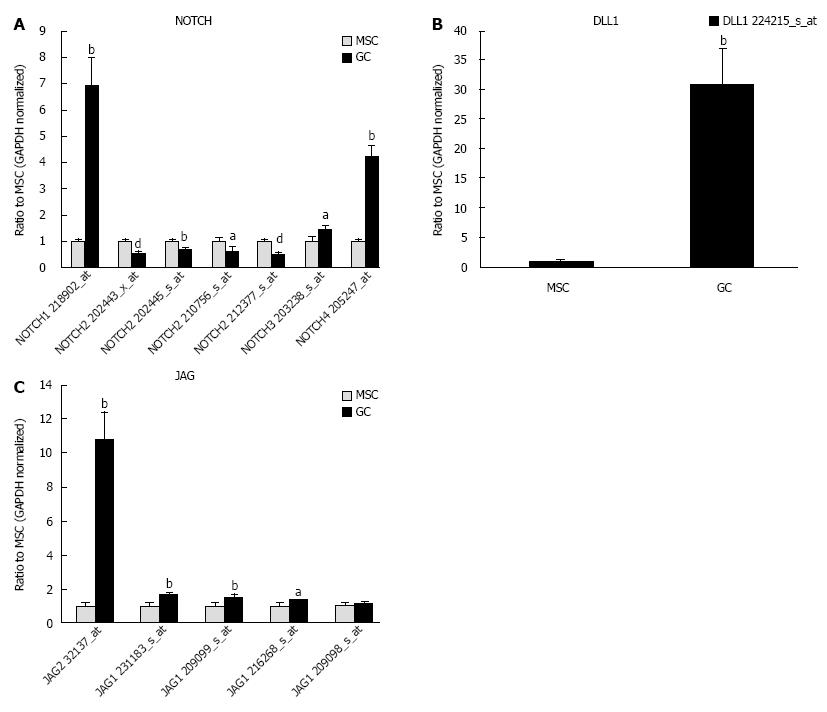
Figure 5 Gene expression of NOTCH, delta-like 1 (Drosophila) (DLL1) and JAG.
A: The gene expression of NOTCH1, 3 and 4 was up-regulated in diffuse-type gastric cancer (GC) compared with mesenchymal stem cell (MSCs), whereas NOTCH2 was down-regulated. Results represent the mean ± SE (n = 12 in MSC cultures and n = 5 in diffuse-type GC). aP < 0.05, bP < 0.01, and dP < 0.001 using Student’s t test; B: DLL1, a NOTCH ligand, was up-regulated in diffuse-type GC compared with MSCs. Results represent the mean ± SE (n = 12 in MSC cultures and n = 5 in diffuse-type GC). bP < 0.01 using Student’s t test; C: Jagged 2 (JAG2), a NOTCH ligand, was up-regulated in diffuse-type GC compared with MSCs. Jagged 1 (JAG1) was up-regulated in diffuse-type GC compared with MSCs. Results represent the mean ± SE (n = 12 in MSC cultures and n = 5 in diffuse-type GC). aP < 0.05 and bP < 0.01 using Student’s t test.
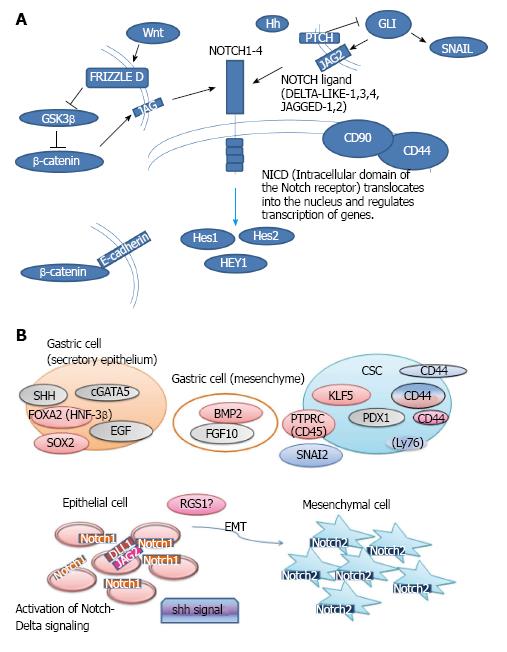
Figure 6 Notch signaling and the epithelial-mesenchymal transition hypothesis.
A: Upon cellular stimulation by the Notch ligand, the intracellular domain of the Notch receptor (NICD) translocates into the nucleus and regulates gene transcription; B: In the EMT hypothesis, epithelial-phenotype cells expressing NOTCH1 transition to mesenchymal-phenotype cells expressing NOTCH2. RGS1: Regulator of G-protein signaling 1; EMT: Epithelial-mesenchymal transition; JAG2: Jagged 2; CSCs: Cancer stem cells.
- Citation: Tanabe S, Aoyagi K, Yokozaki H, Sasaki H. Regulated genes in mesenchymal stem cells and gastric cancer. World J Stem Cells 2015; 7(1): 208-222
- URL: https://www.wjgnet.com/1948-0210/full/v7/i1/208.htm
- DOI: https://dx.doi.org/10.4252/wjsc.v7.i1.208


