Copyright
©2013 Baishideng Publishing Group Co.
World J Stem Cells. Jan 26, 2013; 5(1): 26-33
Published online Jan 26, 2013. doi: 10.4252/wjsc.v5.i1.26
Published online Jan 26, 2013. doi: 10.4252/wjsc.v5.i1.26
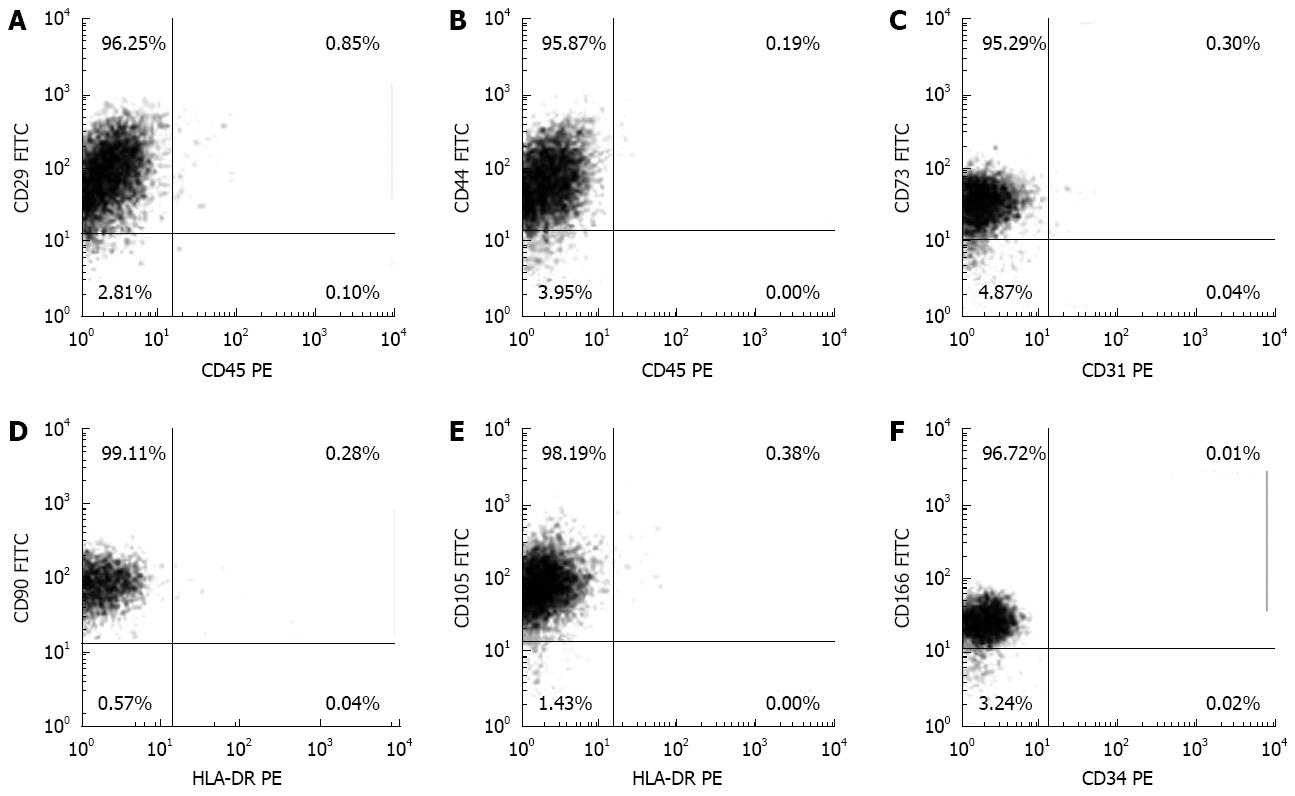
Figure 1 Representative flow cytometric dot-plots of rat fetal cardiac mesenchymal stem cells showing.
A: CD29+/CD45-; B: CD44+/ CD45-; C: CD73+/CD31-; D: CD90+/HLA-DR-; E: CD105+/HLA-DR-; F: CD166+/CD34- phenotype.
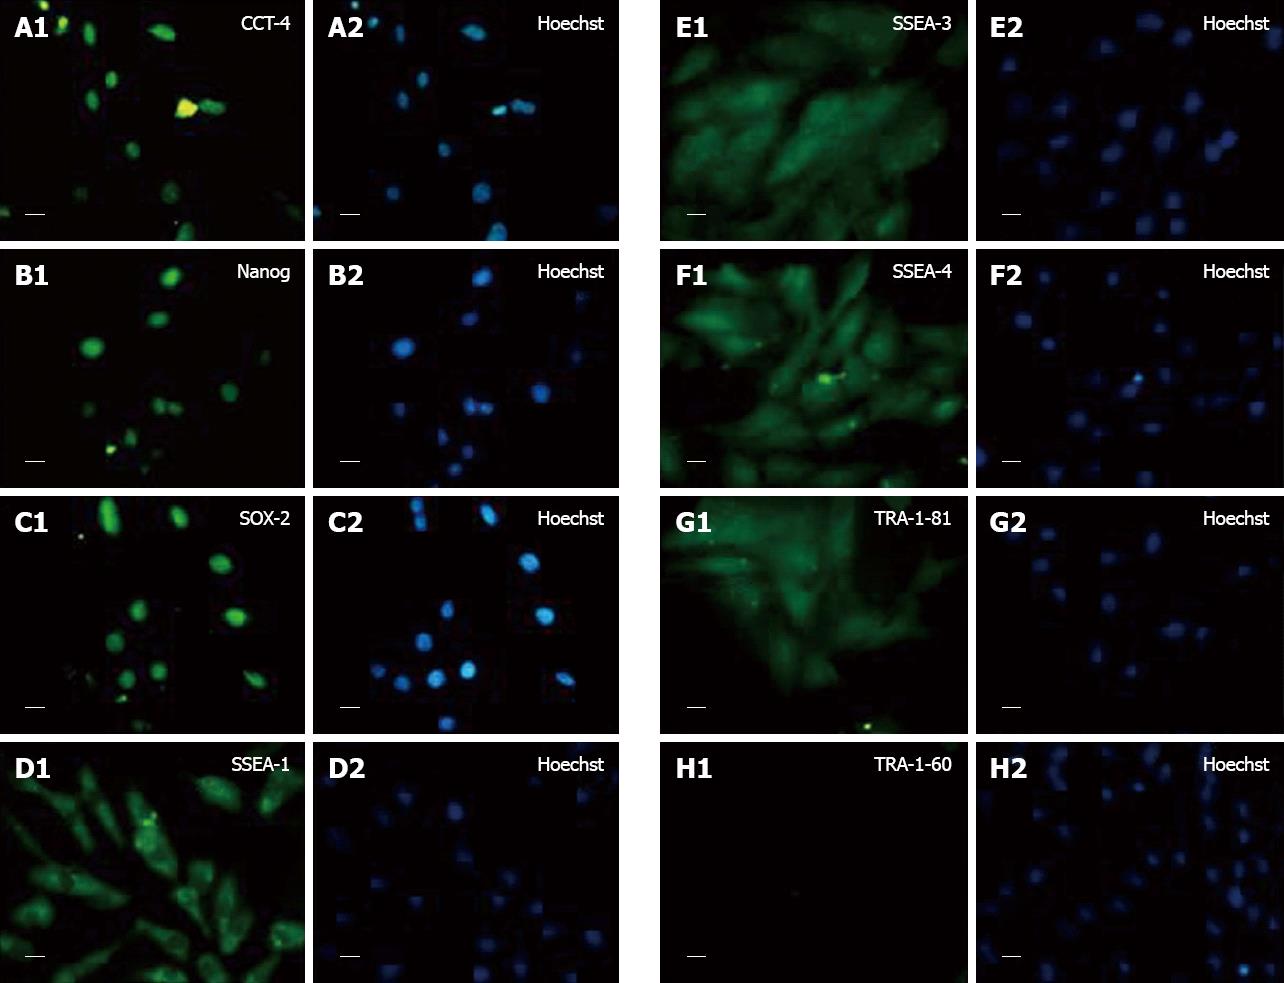
Figure 2 Representative immunocytochemistry photomicrographs (40 ×, 20 μm) of rat fetal cardiac mesenchymal stem cells showing expression.
A: OCT-4 (A1: OCT-4 and A2: Hoechst dye); B: Nanog (B1: Nanog and B2: Hoechst dye); C: SOX-2 (C1: SOX-2 and C2: Hoechst dye); D: SSEA-1 (D1: SSEA-1 and D2: Hoechst dye); E: SSEA-3 (E1: SSEA-3 and E2: Hoechst dye); F: SSEA-4 (F1: SSEA-4 and F2: Hoechst dye); G: TRA 1-81 (G1: TRA 1-81 and G2: Hoechst dye); H: TRA1-60 (H1:TRA 1-60 and H2: Hoechst dye).
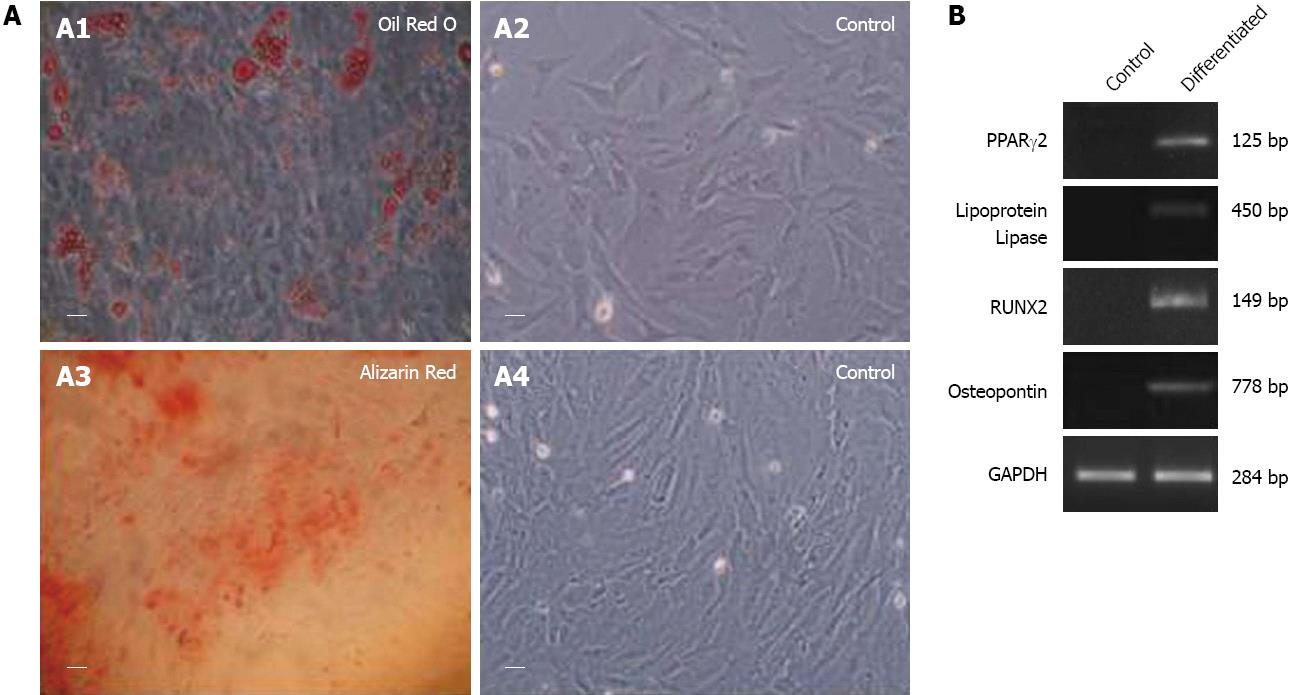
Figure 3 Representative photomicrographs (A) and representative reverse-transcription polymerase chain reaction gel photomicrographs (B).
A: Representative photomicrographs (40 ×, 20 μm) showing differentiation of rat fetal cardiac mesenchymal stem cells into osteocytes (A1: differentiated cells positive for Alizarin Red stain and A2: control cells negative for Alizarin Red stain) and adipocytes (A3: differentiated cells positive for Oil Red O stain and A4: control cells negative for Oil Red O stain); B: Representative reverse-transcription polymerase chain reaction gel photomicrographs showing expression of lipoprotein lipase and PPARγ2 by adipocytes and osteopontin and RUNX2 by osteocytes cells, induced from rat fetal cardiac mesenchymal stem cells. Control cells not treated with induction medium did not show expression of above markers.
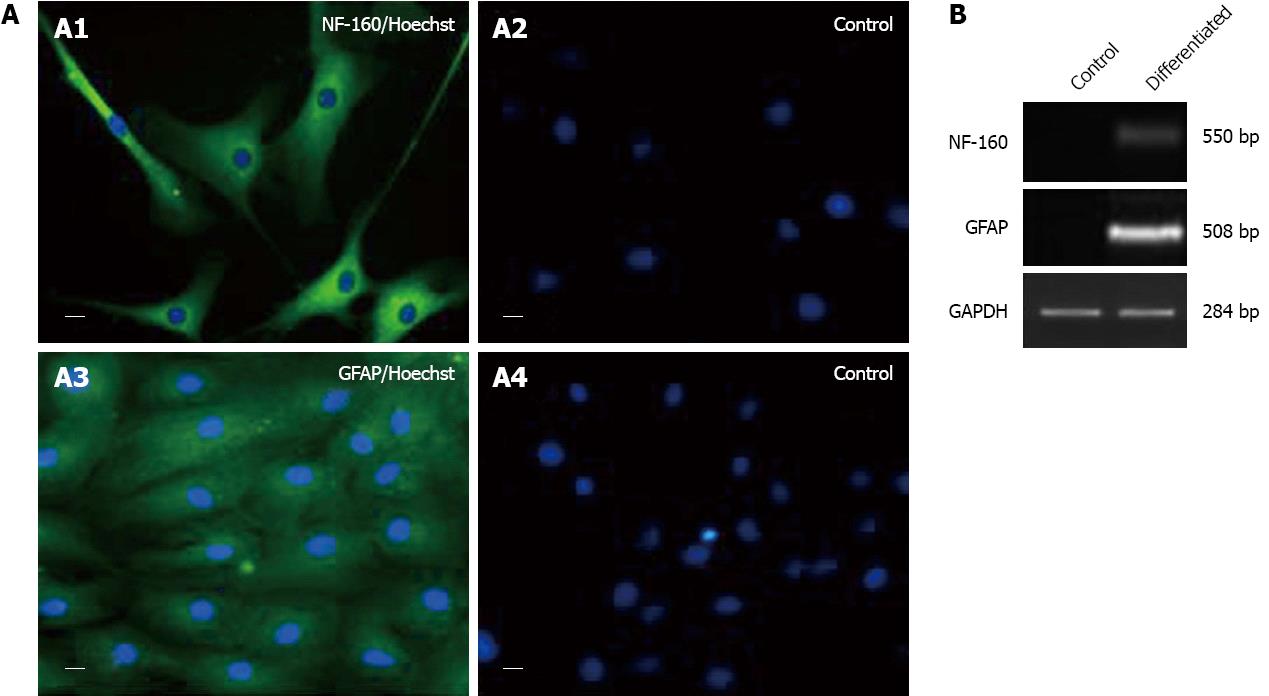
Figure 4 Representative immunocytochemistry photomicrographs (A) and representative reverse-transcription polymerase chain reaction gel photomicrographs (B).
A: Representative immunocytochemistry photomicrographs (40 ×, 20 μm) showing differentiation of rat fetal cardiac mesenchymal stem cells into neuronal cells [A1: Neuronal filament (NF)-160 and Hoechst and A2: no NF-160 only Hoechst dye in control cells]; [A3: Glial fibrillar acidic protein (GFAP) and Hoechst dye and A4: no GFAP only Hoechst dye in control cells]; B: Representative reverse-transcription polymerase chain reaction gel photomicrographs showing expression of NF-160 and GFAP by neuronal cells differentiated from rat fetal cardiac mesenchymal stem cells. Control cells without induction medium did not show expression of above markers.
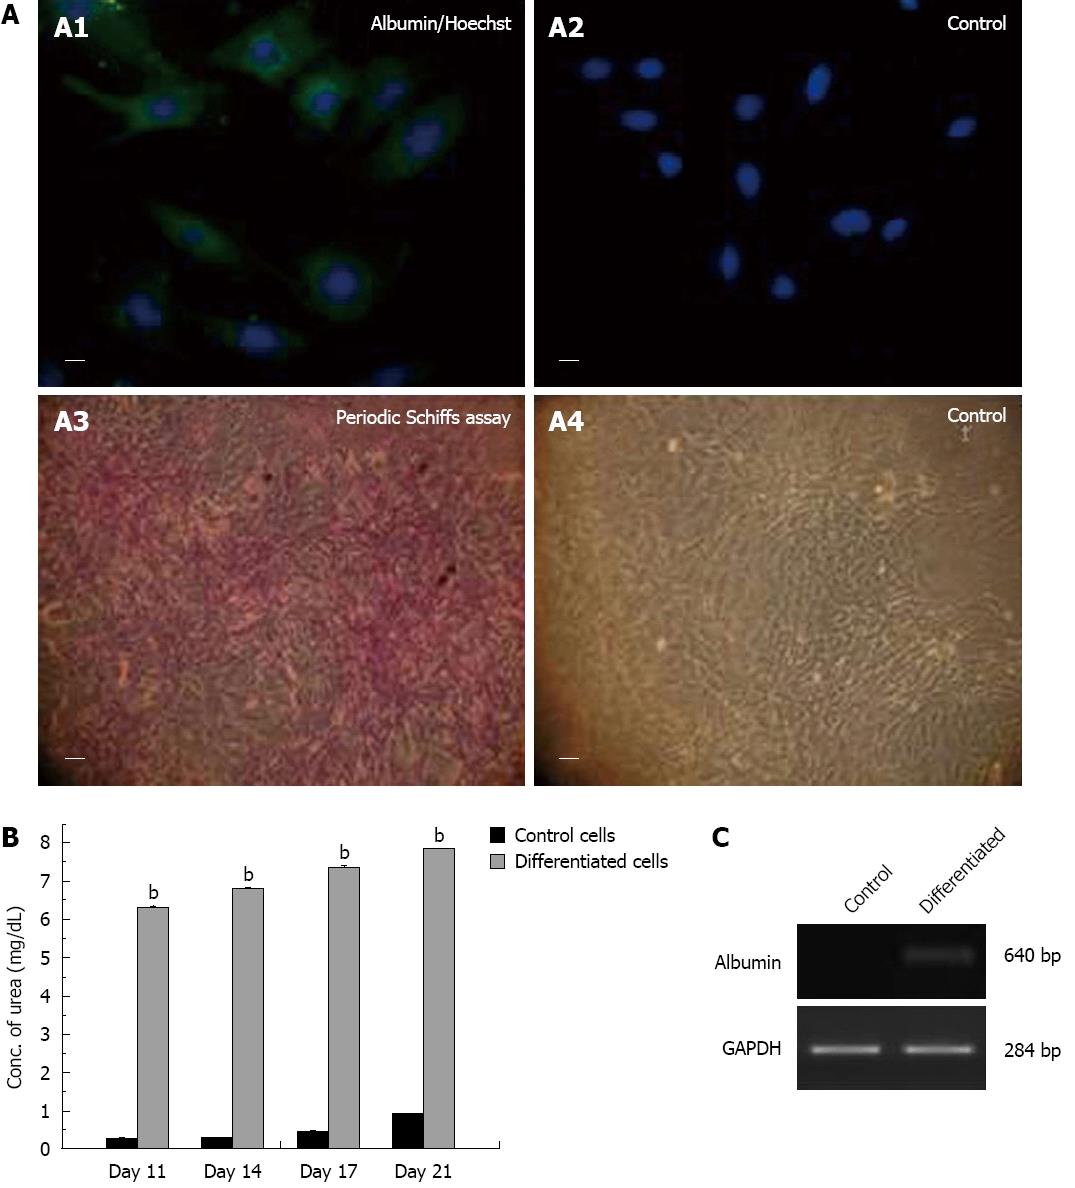
Figure 5 On treatment with hepatogenic medium, fetal cardiac mesenchymal stem cells exhibited differentiation into hepatocytic cells (endoderm), as demonstrated by expression of albumin by reverse-transcription polymerase chain reaction and immunocytochemistry, glycogen deposits by Periodic Schiffs staining and excretion of urea in the supernatant.
A: Representative immunocytochemistry photomicrographs (40 ×, 20 μm) showing differentiation of rat fetal cardiac mesenchymal stem cells into hepatocytes (A1: albumin and Hoechst dye and A2: no albumin only Hoechst dye in control cells); (A3: Periodic Acid Schiff stain and A4: control cells negative for Periodic Acid Schiff stain); B: Urea levels in the supernatant of control and differentiated cells at days 11, 14, 17 and 21. Values are mean ± SE of three experiments; bP < 0.001 for control cells vs differentiated cells; C: Representative reverse-transcription polymerase chain reaction gel photomicrographs showing expression of albumin by hepatocytic cells induced from fetal cardiac mesenchymal stem cells. Control cells without induction medium did not show any expression of albumin.
- Citation: Srikanth GVN, Tripathy NK, Nityanand S. Fetal cardiac mesenchymal stem cells express embryonal markers and exhibit differentiation into cells of all three germ layers. World J Stem Cells 2013; 5(1): 26-33
- URL: https://www.wjgnet.com/1948-0210/full/v5/i1/26.htm
- DOI: https://dx.doi.org/10.4252/wjsc.v5.i1.26


