
















Copyright: ©Author(s) 2026.
World J Stem Cells. Aug 26, 2026; 18(8): 122836
Published online Aug 26, 2026. doi: 10.4252/wjsc.122836
Published online Aug 26, 2026. doi: 10.4252/wjsc.122836
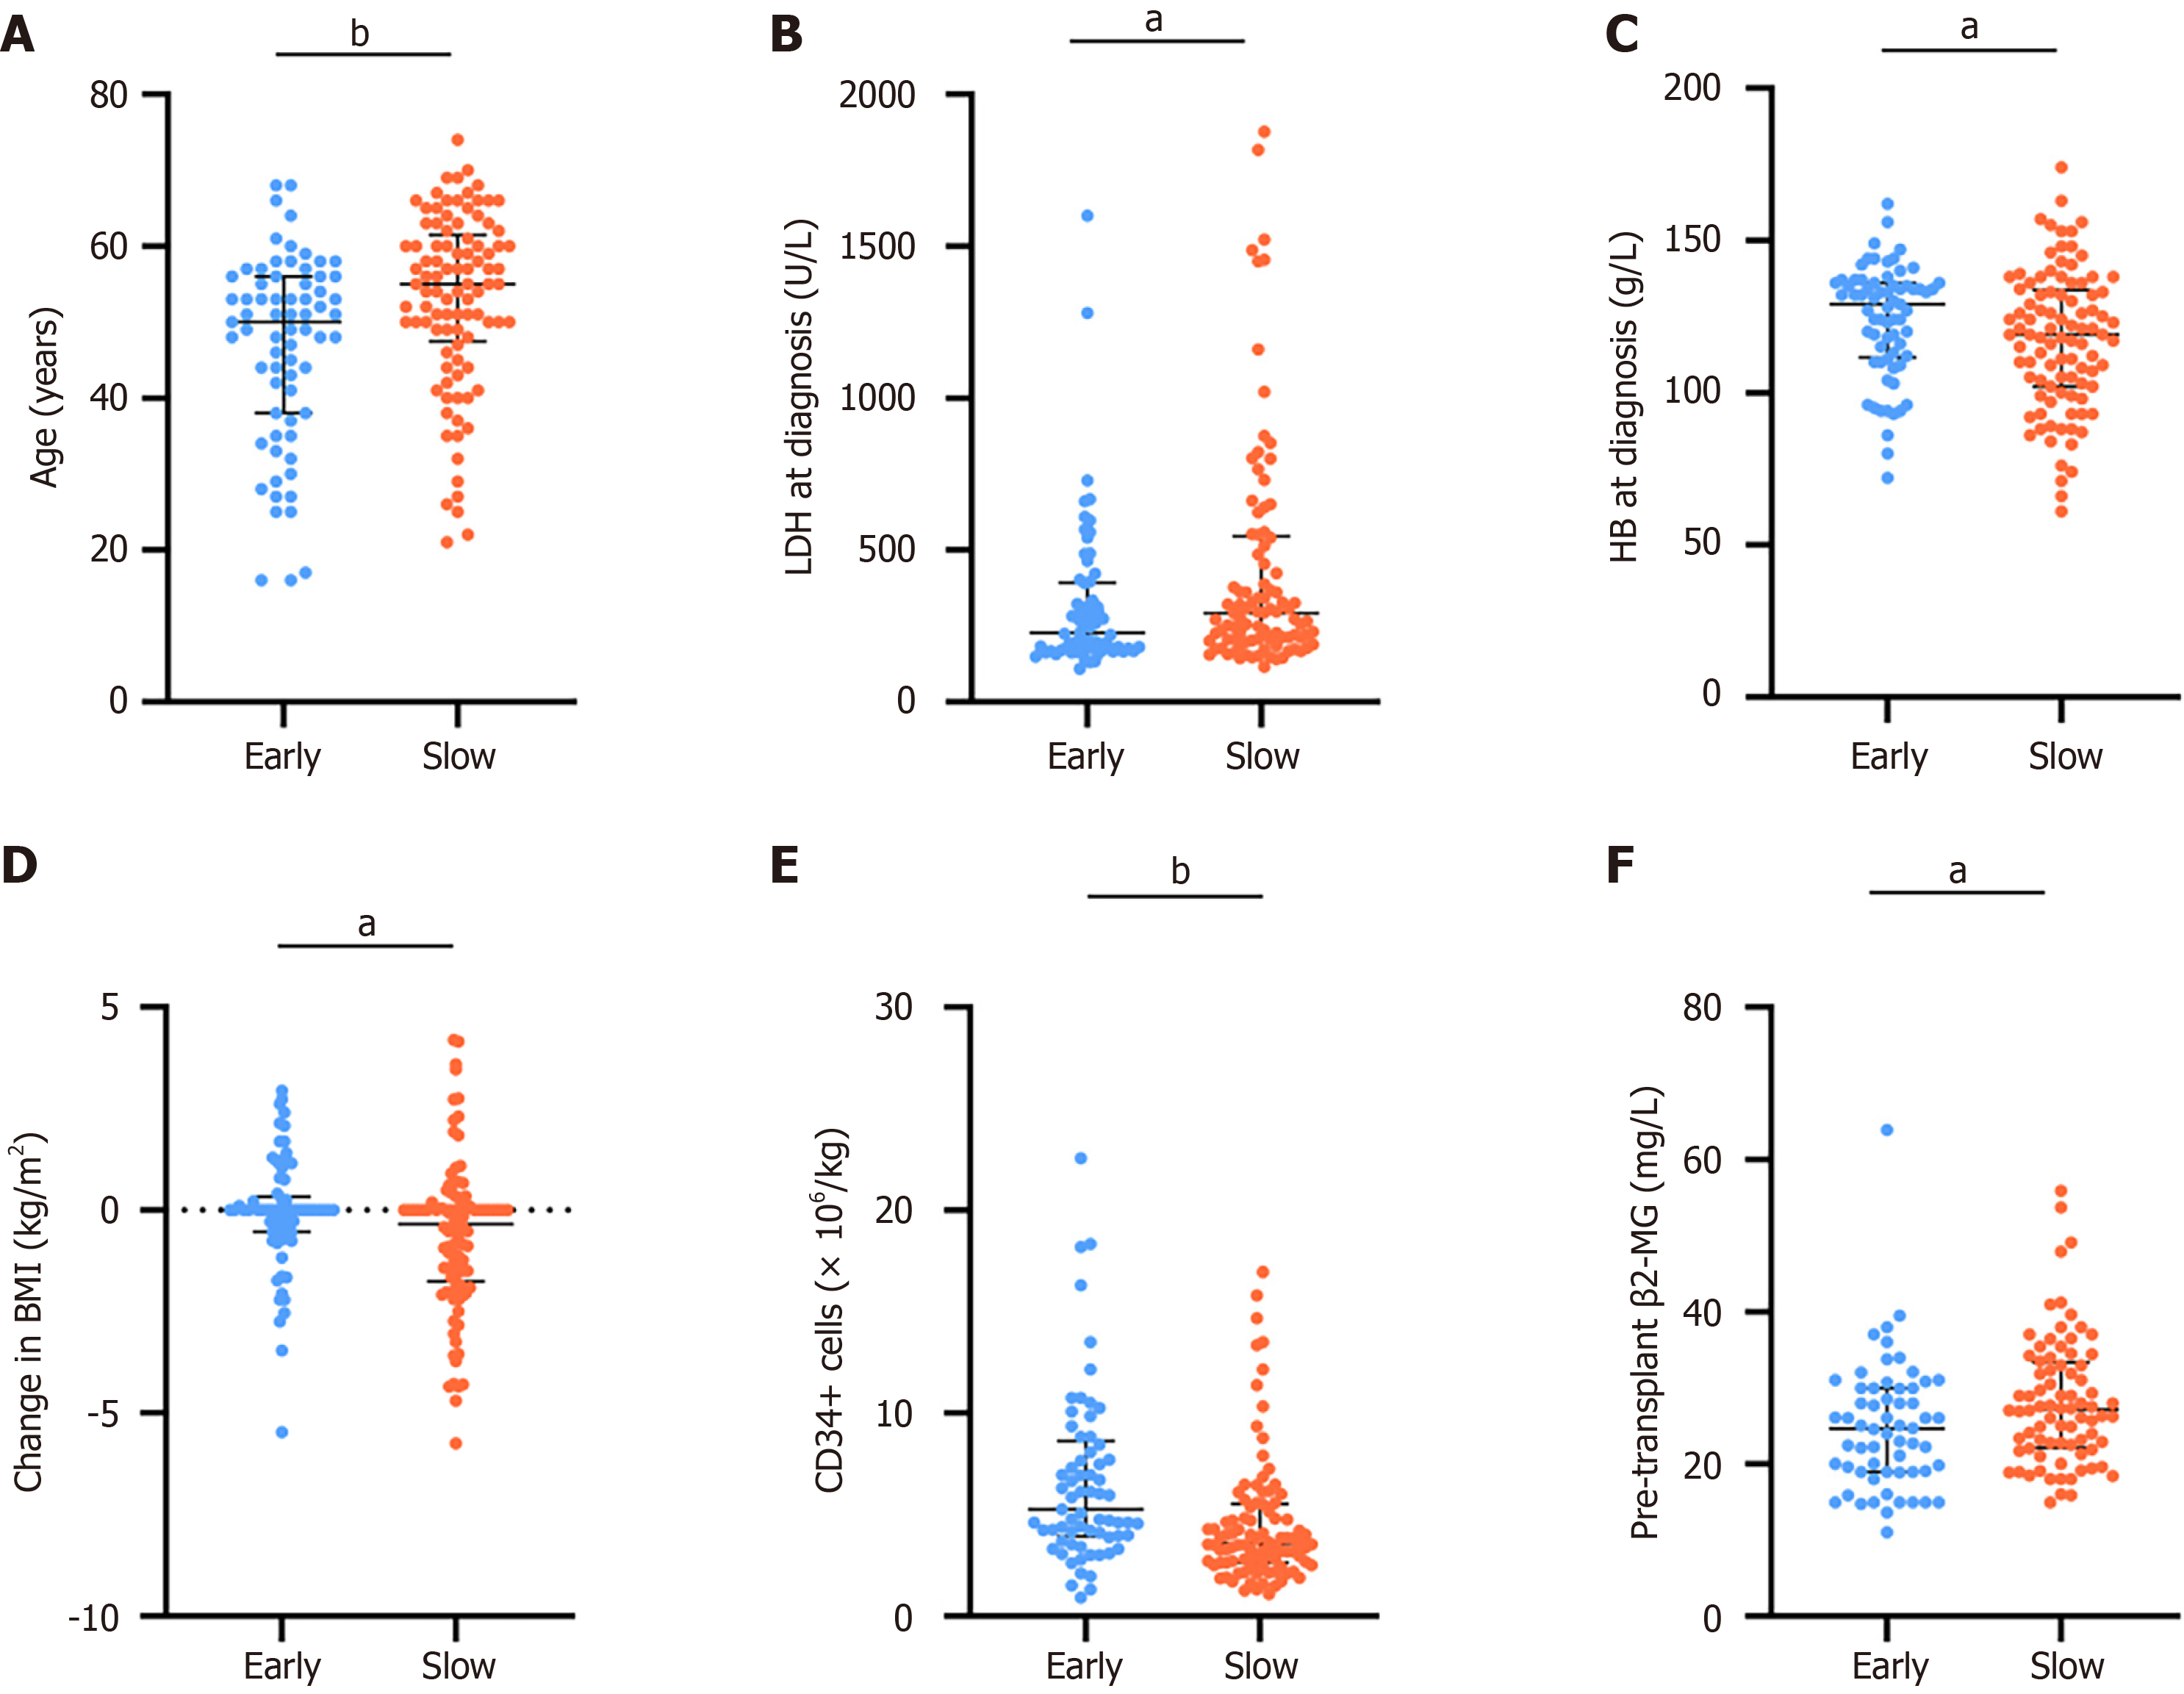
Figure 1 Comparison of significantly different baseline and peritransplant clinical parameters between early and slow engraftment groups.
A: Age at transplantation; B: Lactate dehydrogenase level at diagnosis; C: Hemoglobin level at diagnosis; D: Change in body mass index (BMI) (pretransplant BMI - BMI at diagnosis); E: CD34+ cell dose infused; F: Pretransplant beta 2-microglobulin level. aP < 0.05, bP < 0.01. LDH: Lactate dehydrogenase; HB: Hemoglobin; BMI: Body mass index; β2-MG: Beta 2-microglobulin.
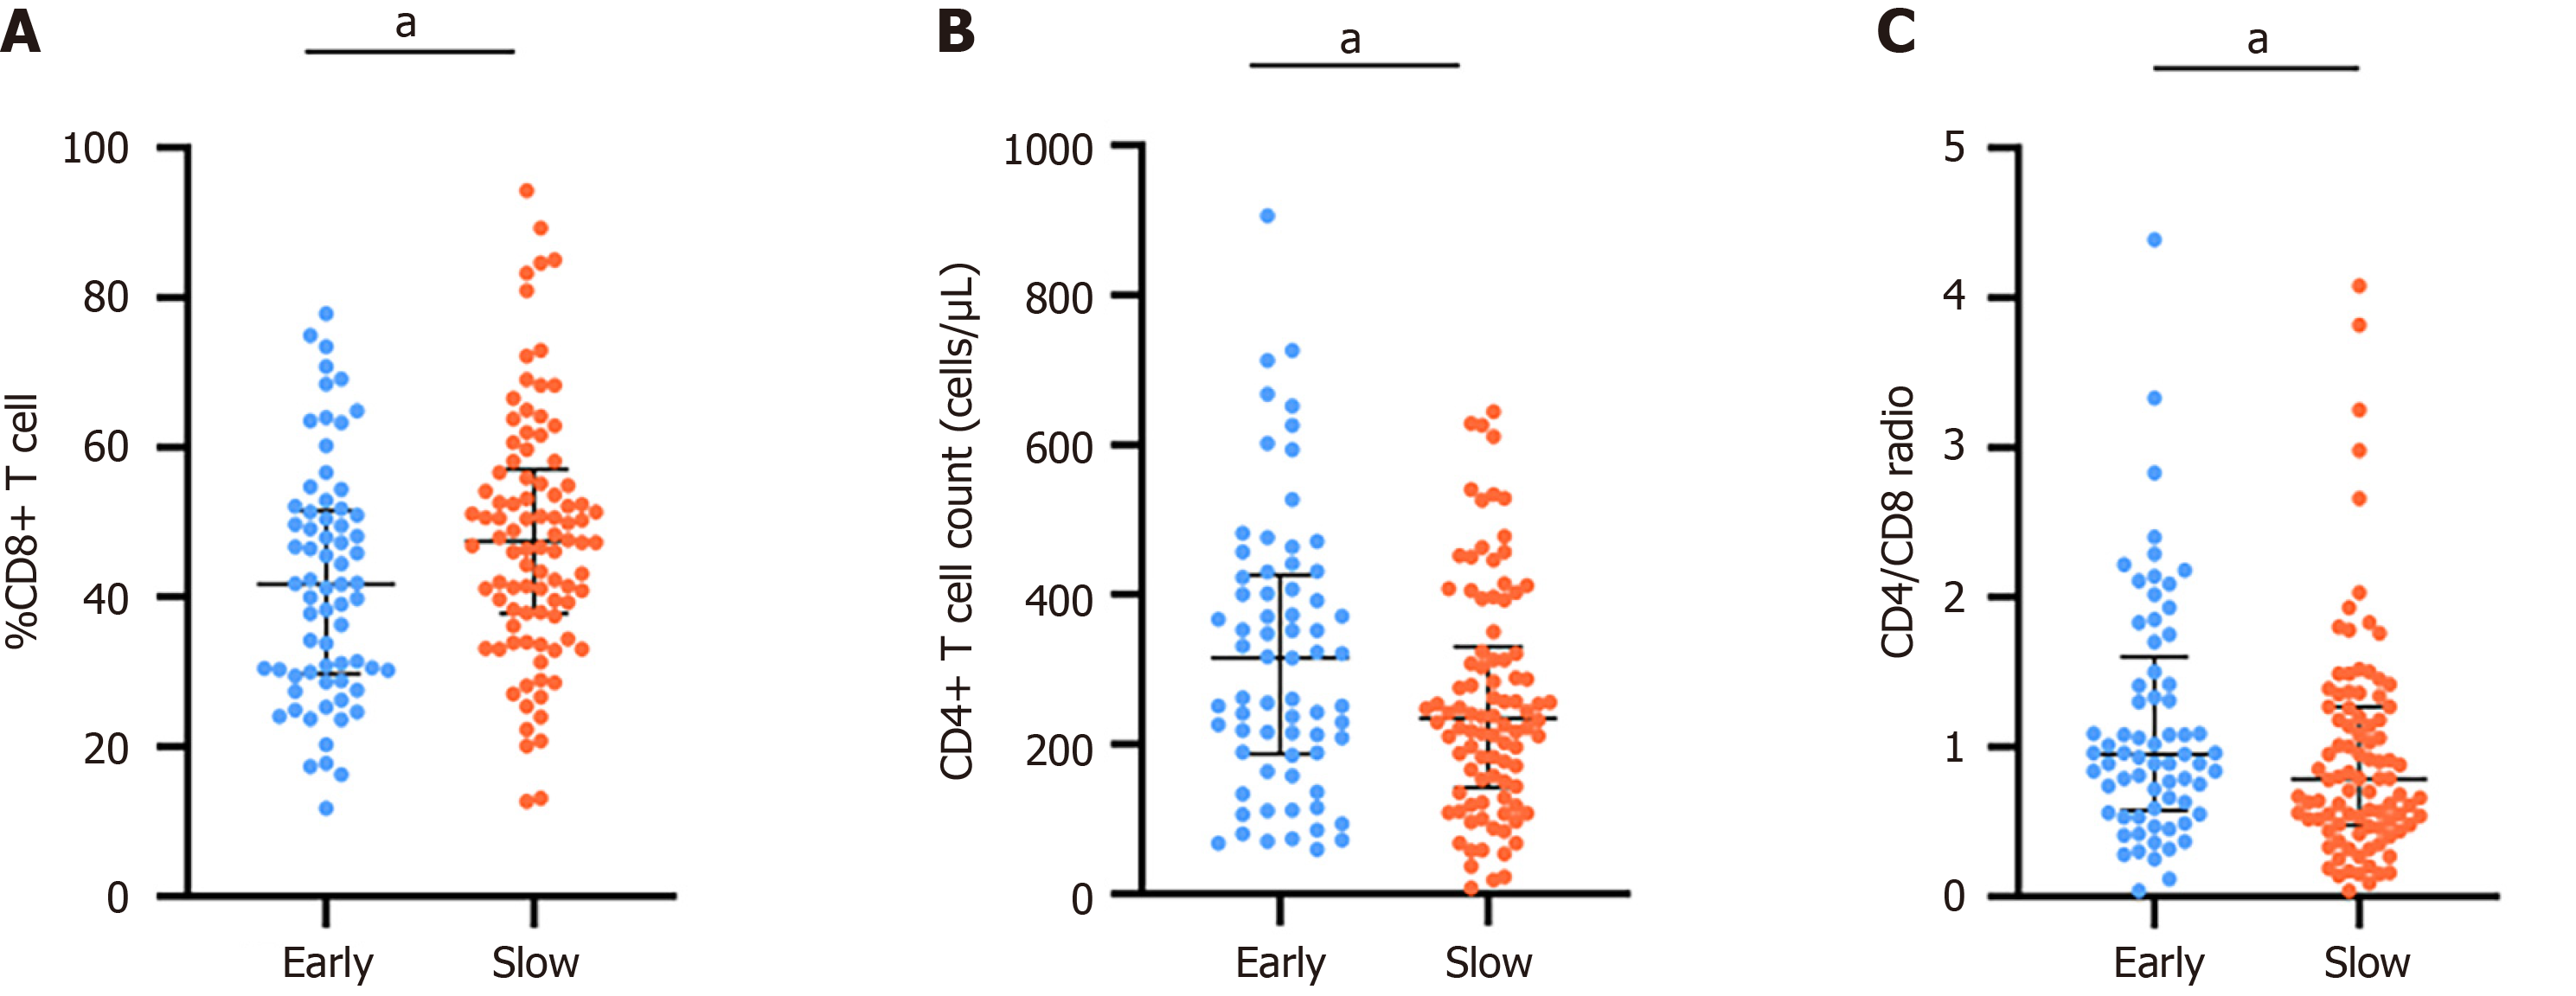
Figure 2 Comparison of lymphocyte subsets with significant differences between early and slow engraftment groups.
A: Percentage of CD8+ T cells; B: Absolute count of CD4+ T cells; C: CD4/CD8 ratio. Slow engraftment group exhibited elevated CD8+ T cell proportion, reduced CD4+ T cell count, and decreased CD4/CD8 ratio, indicating pretransplant T cell immune homeostasis imbalance. aP < 0.05.
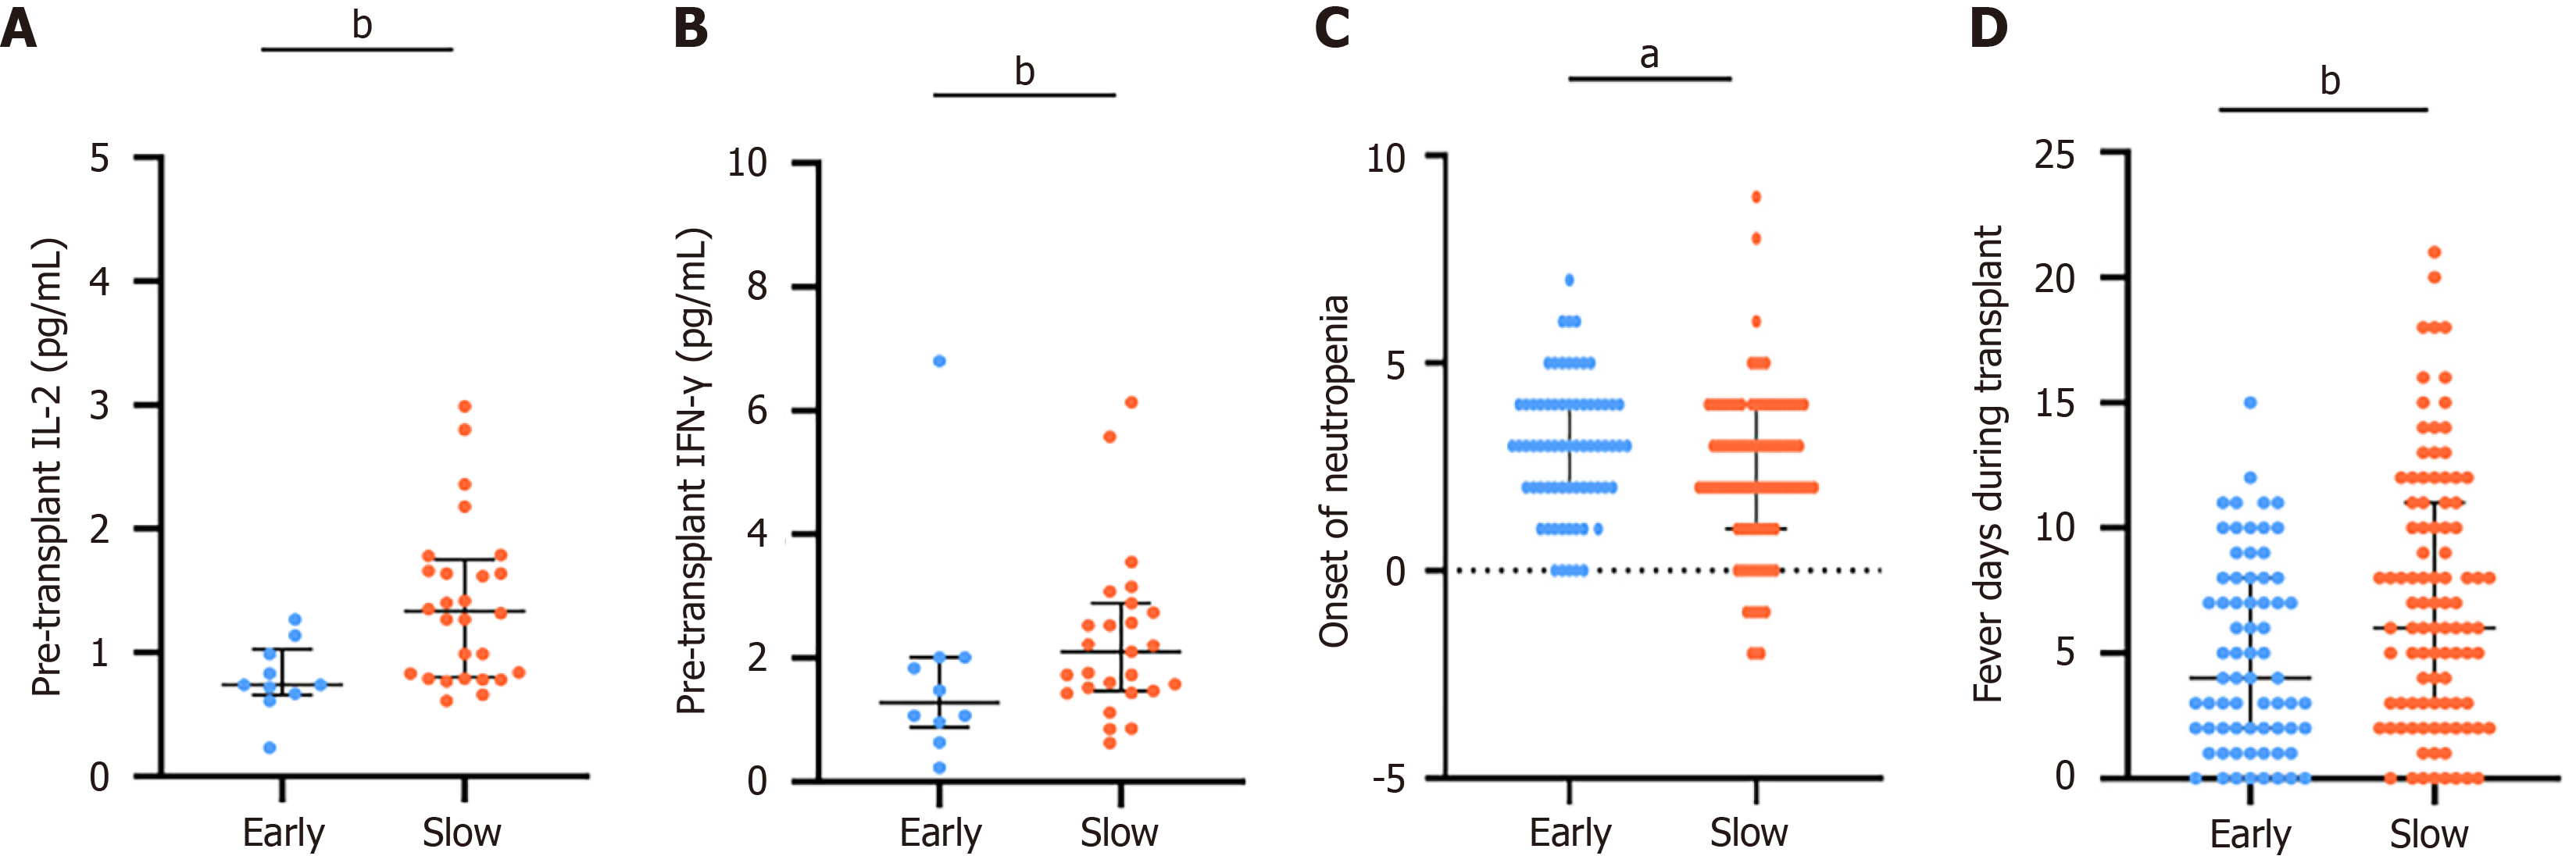
Figure 3 Comparison of significantly different pretransplant inflammatory cytokines and peritransplant clinical events between early and slow engraftment groups.
A and B: Pretransplant inflammatory cytokines (interleukin-2, interferon-γ); C and D: Peritransplant clinical events (neutropenia onset, fever days). aP < 0.05, bP < 0.01. IL-2: Interleukin-2; IFN-γ: Interferon-γ.
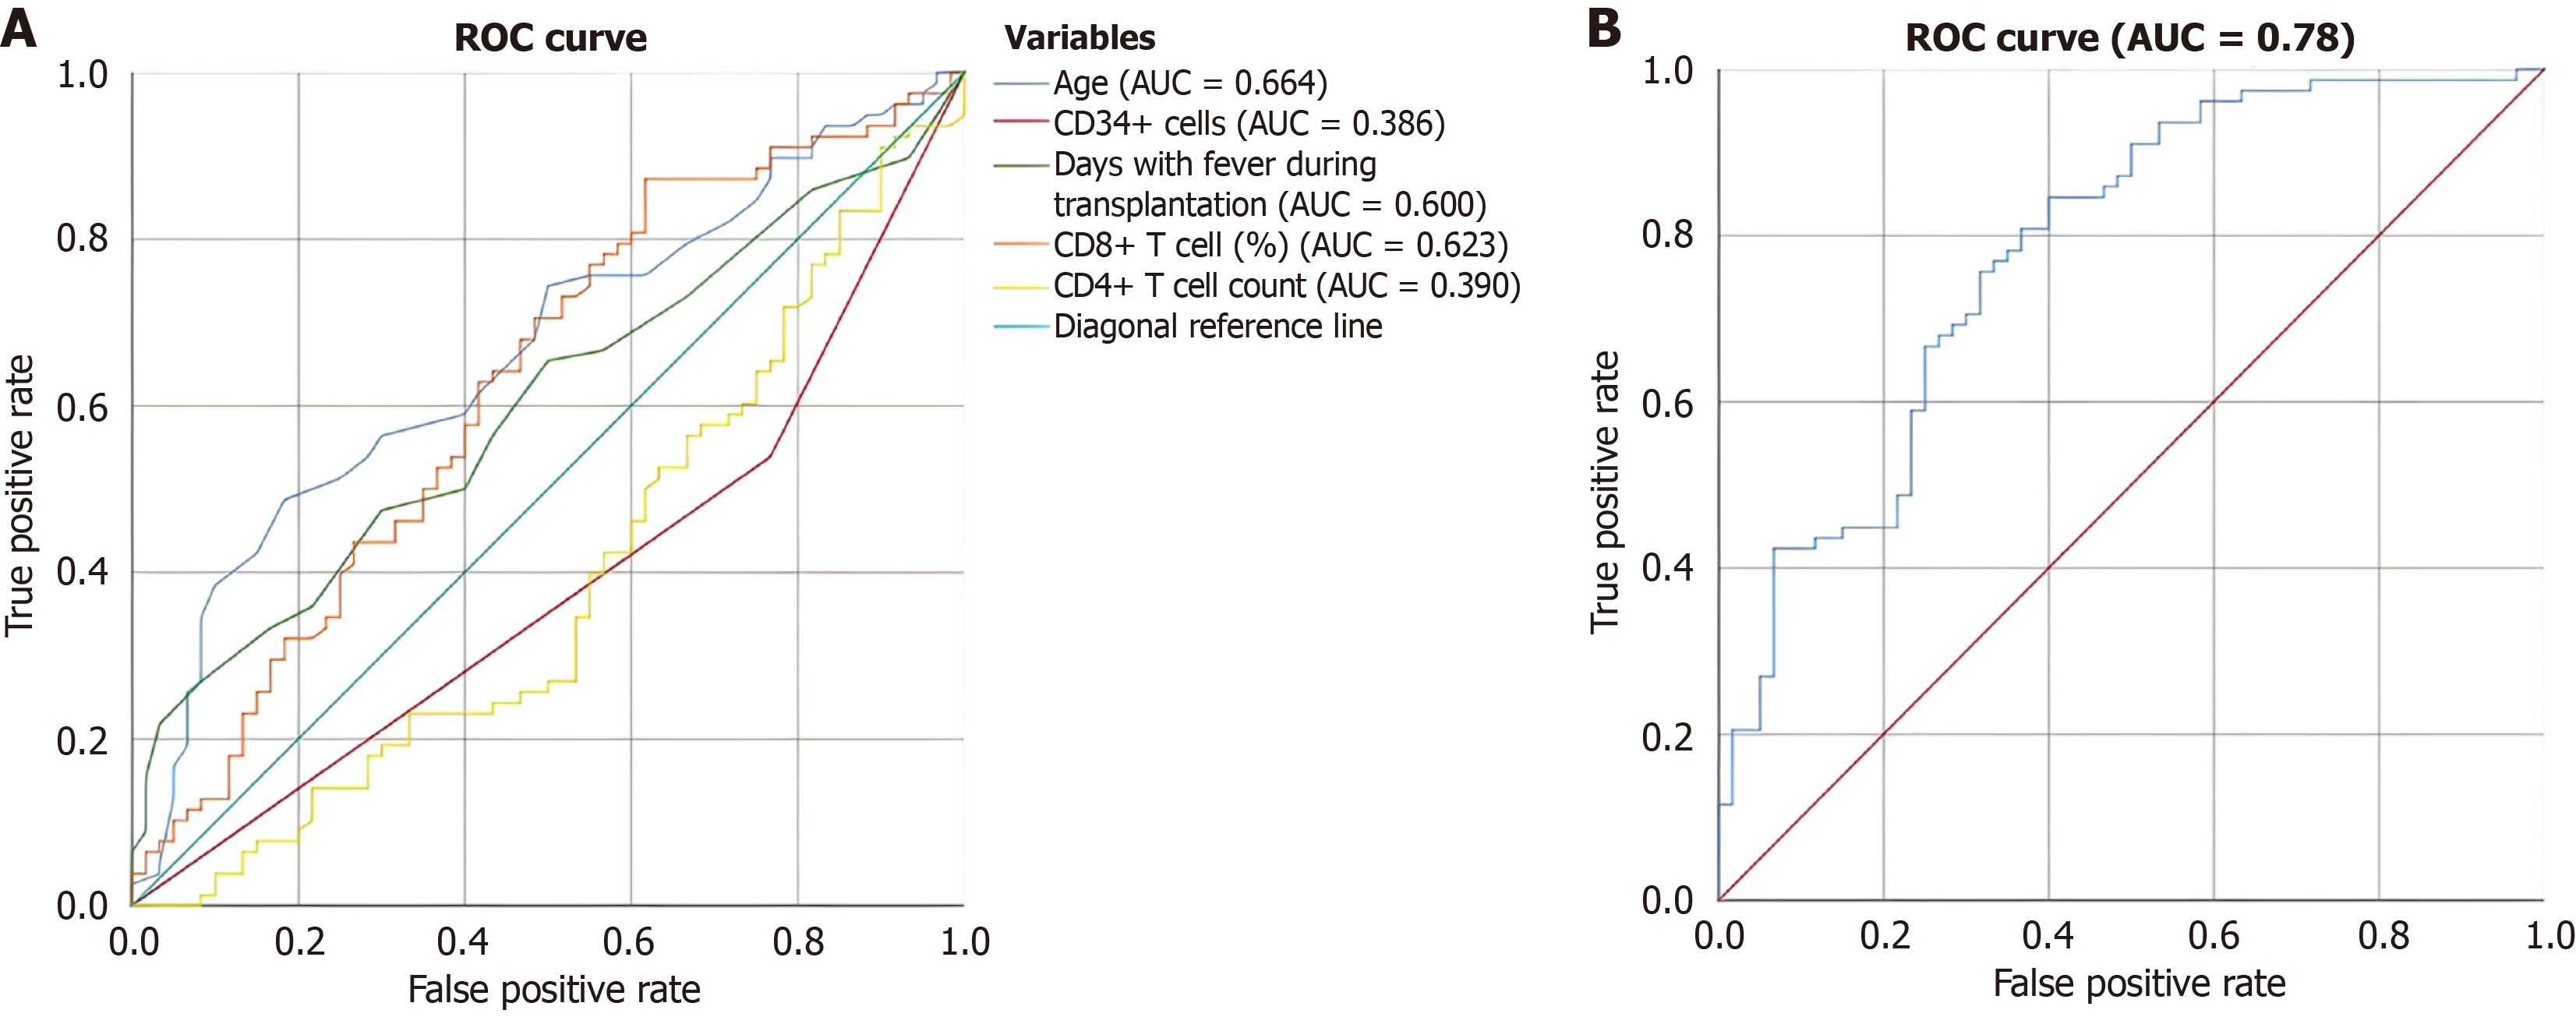
Figure 4 Receiver operating characteristic curves.
A: Receiver operating characteristic curves for predictive performance of risk factors for slow hematopoietic engraftment after autologous hematopoietic stem cell transplantation; B: Receiver operating characteristic curves of the multivariate combined model for predicting slow hematopoietic engraftment after autologous hematopoietic stem cell transplantation. ROC: Receiver operating characteristic; AUC: Area under the curve.
- Citation: Quan X, Zhang HB, Ran LR, Luo ZM, Zhang N, Hu X, Deng JC, Liu Y, Lou SF. Pretransplant T-cell immune imbalance predicts slow engraftment after autologous hematopoietic stem cell transplantation in lymphoma. World J Stem Cells 2026; 18(8): 122836
- URL: https://www.wjgnet.com/1948-0210/full/v18/i8/122836.htm
- DOI: https://dx.doi.org/10.4252/wjsc.122836