
















Copyright: ©Author(s) 2026.
World J Stem Cells. Aug 26, 2026; 18(8): 121124
Published online Aug 26, 2026. doi: 10.4252/wjsc.121124
Published online Aug 26, 2026. doi: 10.4252/wjsc.121124
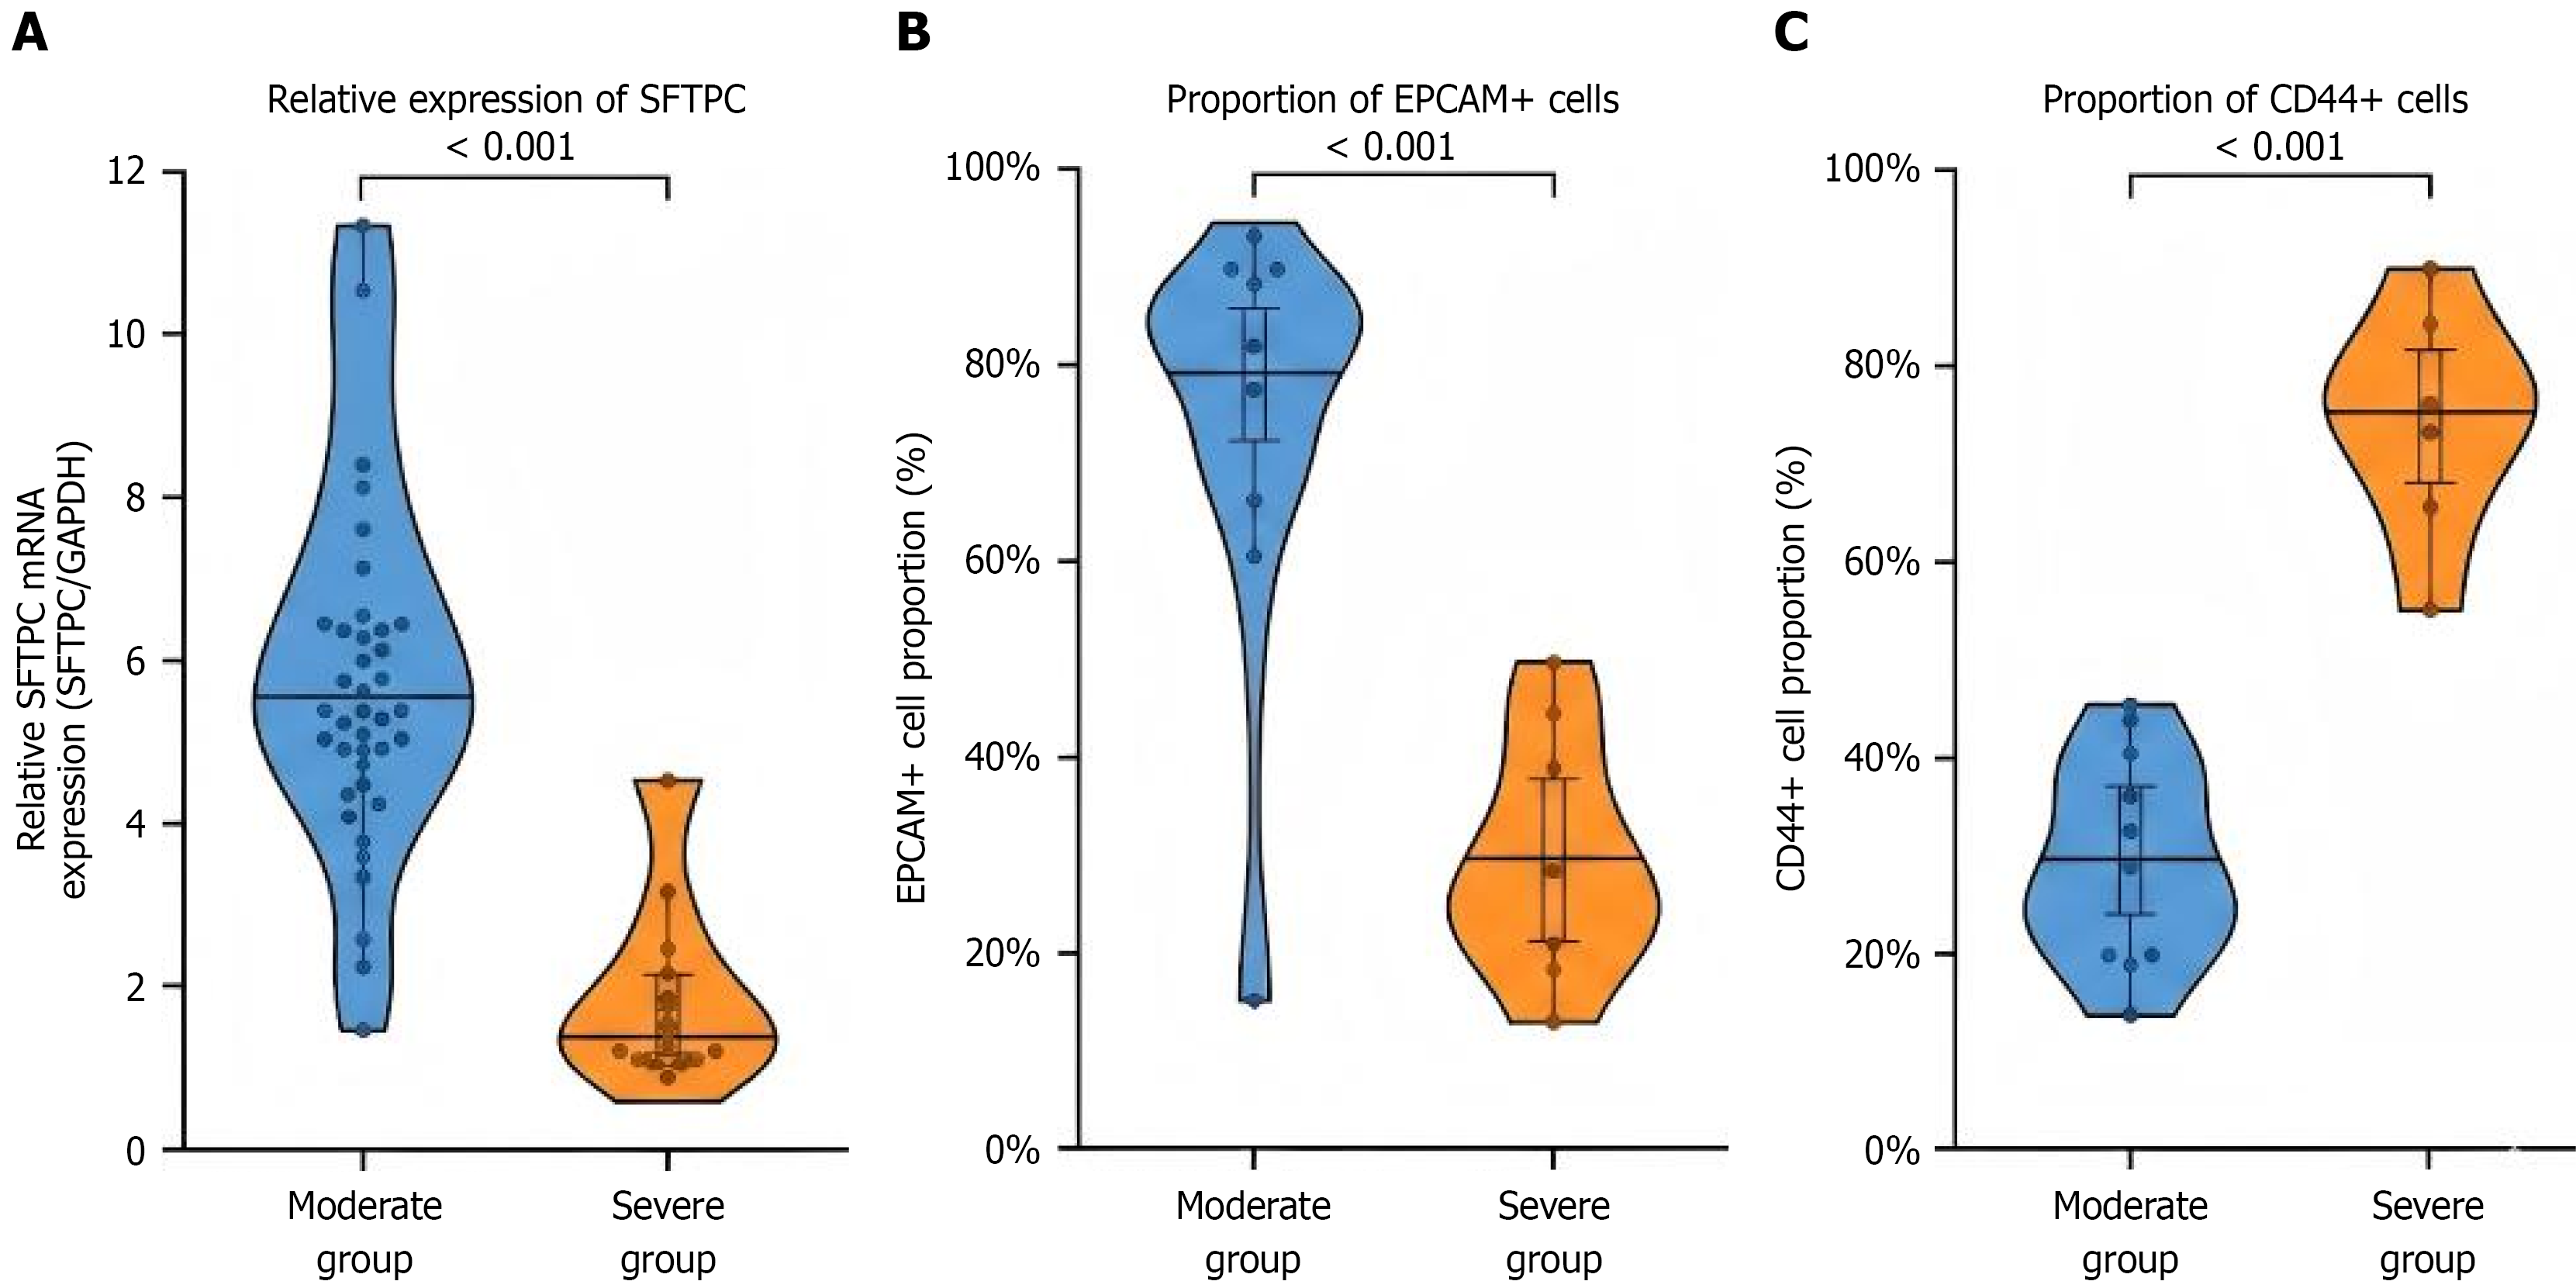
Figure 1 Comparison of surfactant protein C/epithelial cell adhesion molecule/CD44 expression (violin plot).
A: Relative expression of surfactant protein C; B: Proportion of epithelial cell adhesion molecule positive cells; C: Proportion of CD44 positive cells. STTPC: Surfactant protein C; EPCAM: Epithelial cell adhesion molecule.
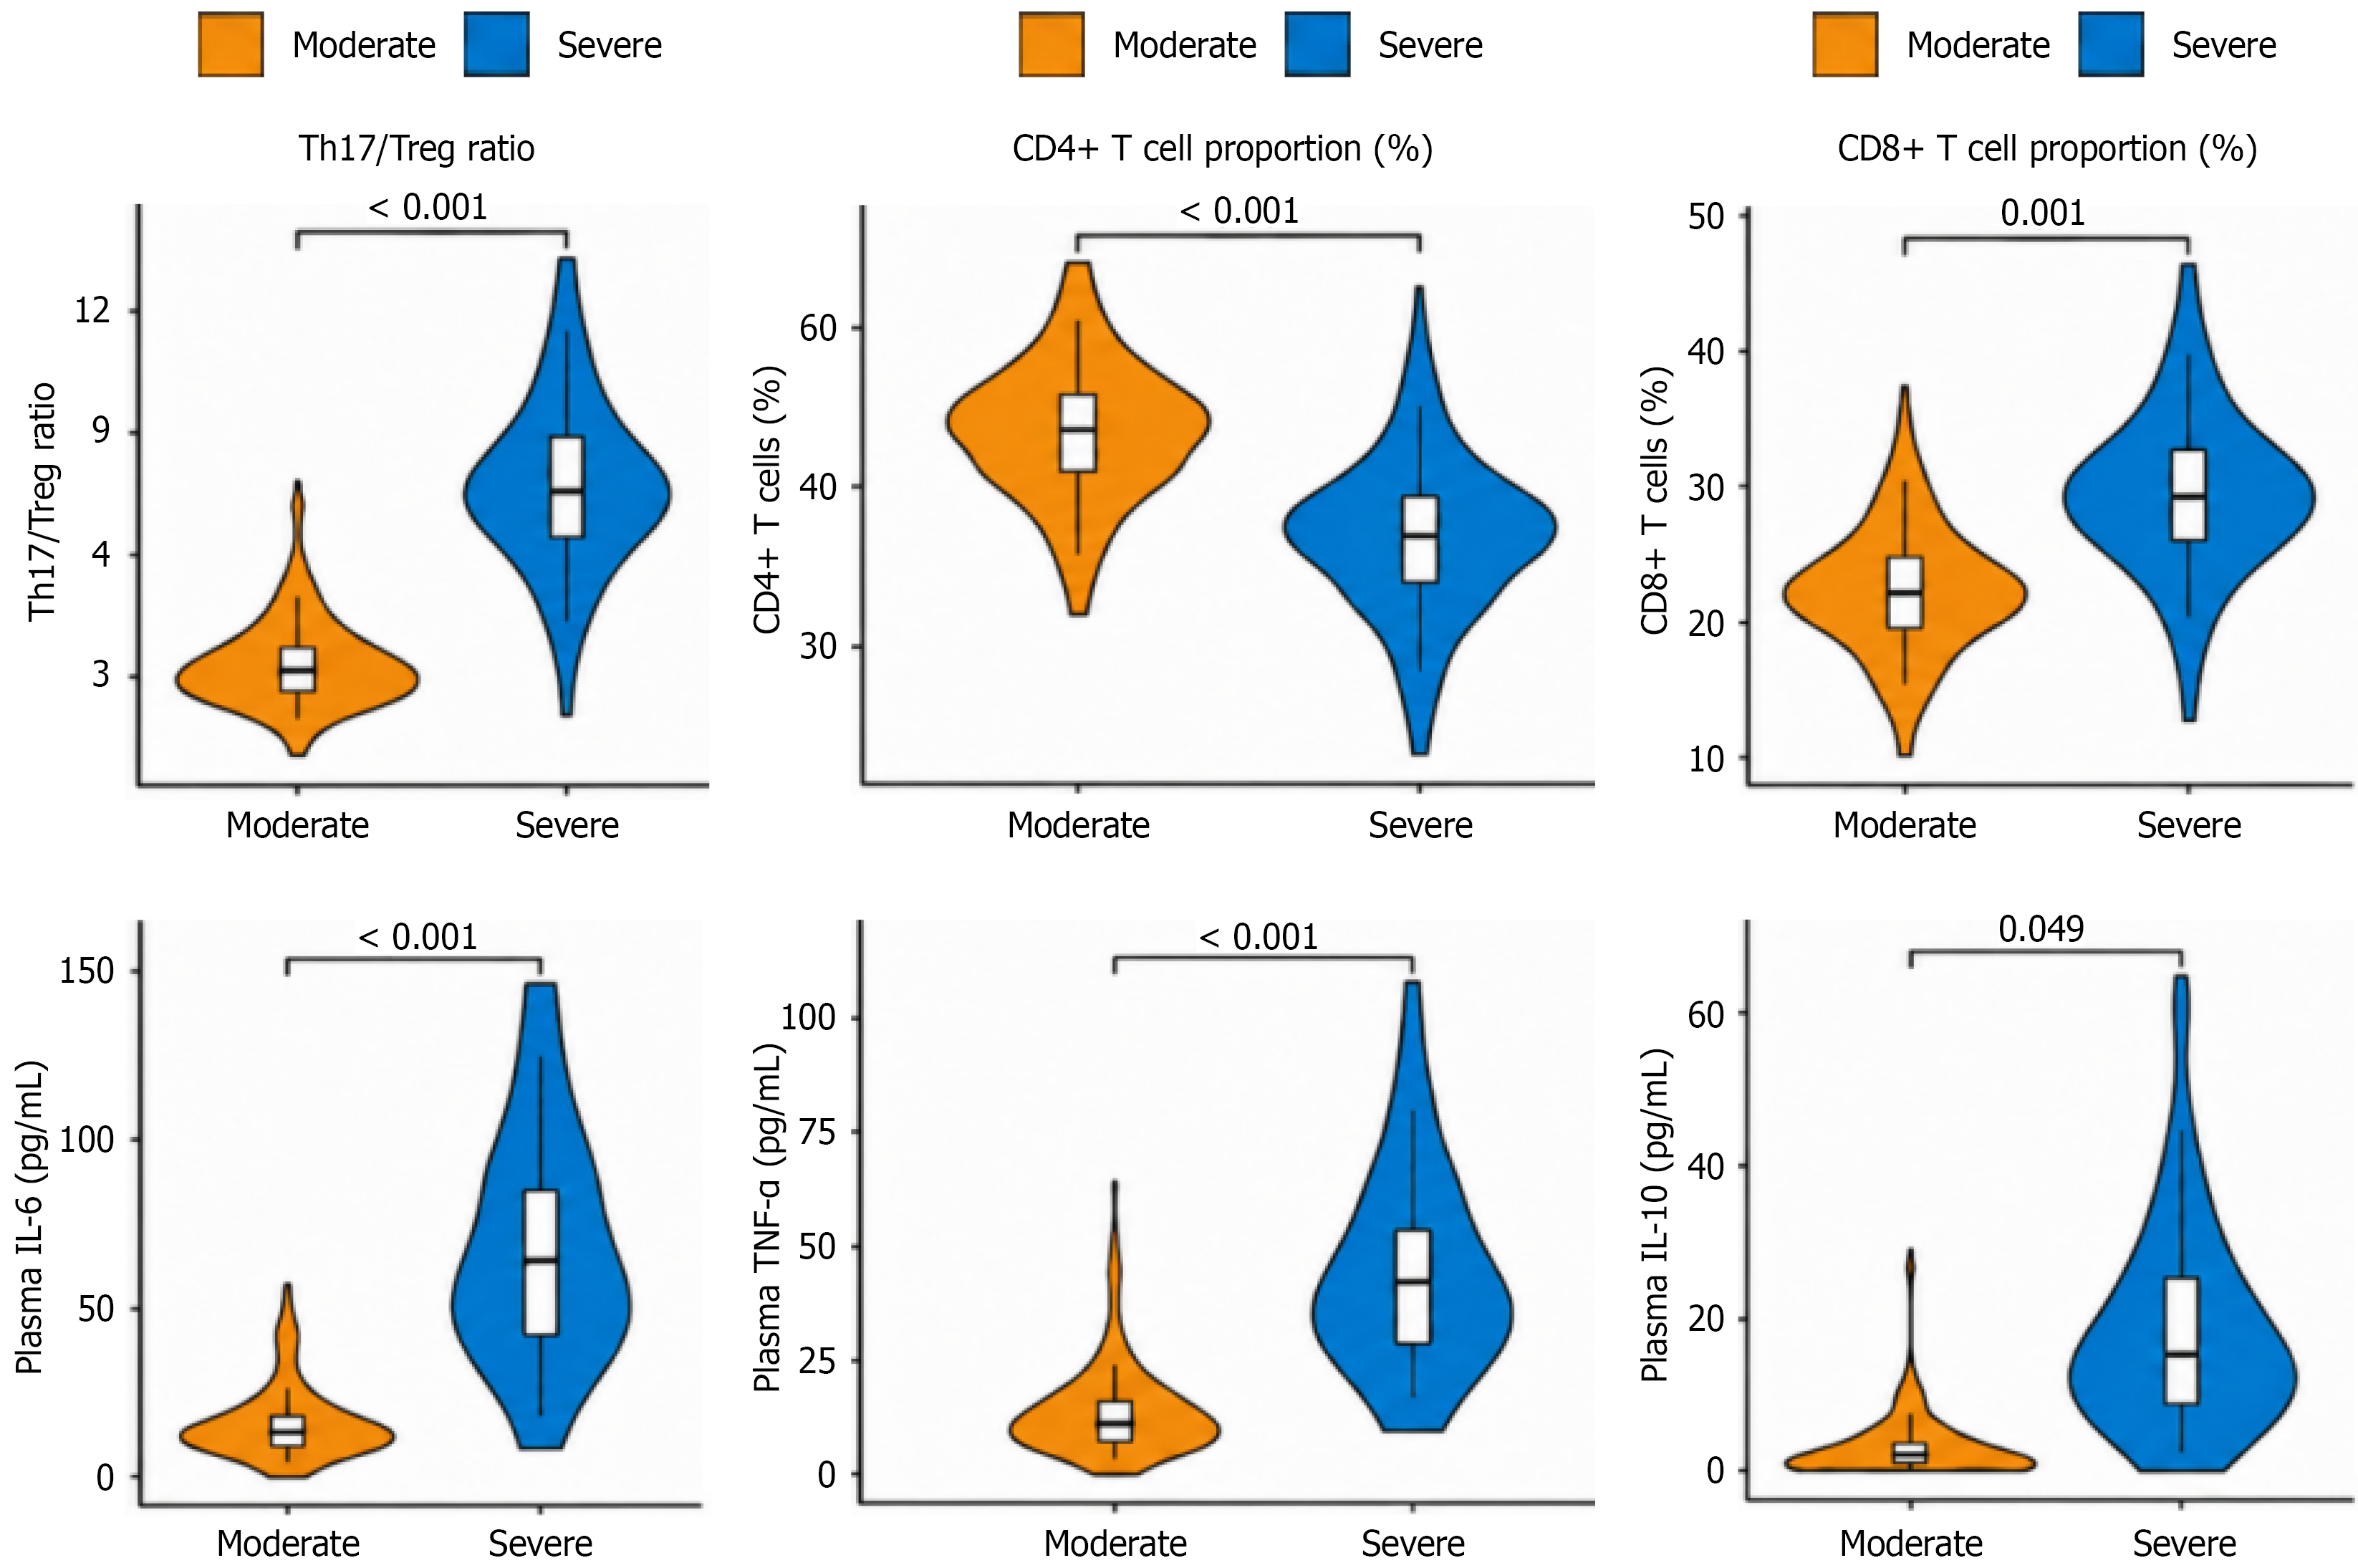
Figure 2 Distribution of immune microenvironment indicators (violin plot).
Th17: T helper 17 cell; Treg: Regulatory T cells; IL: Interleukin; TNF-α: Tumor necrosis factor-α.
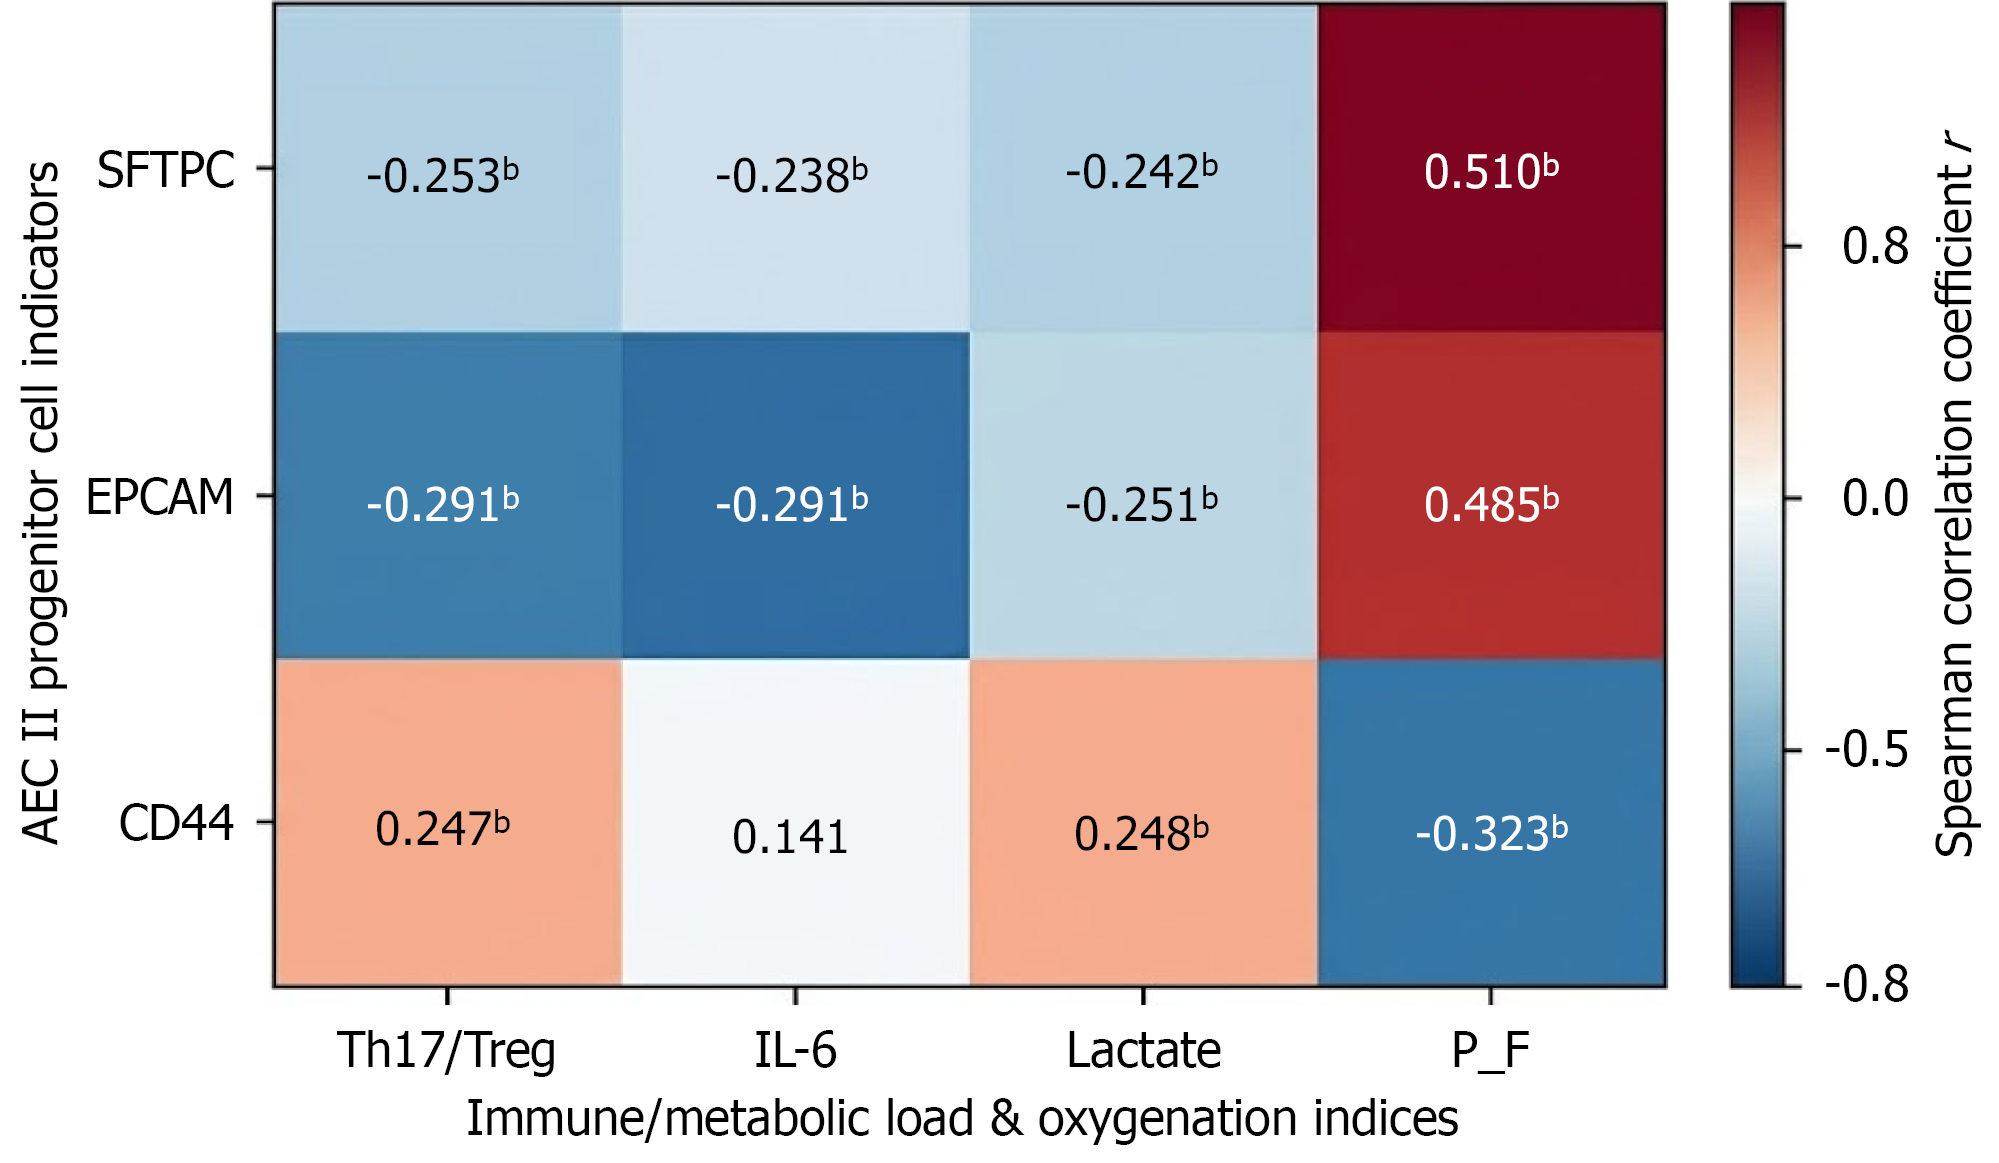
Figure 3 Heat plot of correlation between epithelial progenitor cell indicators and immune/metabolic index.
bP < 0.01. AEC II: Alveolar epithelial type II cells; STTPC: Surfactant protein C; EPCAM: Epithelial cell adhesion molecule.
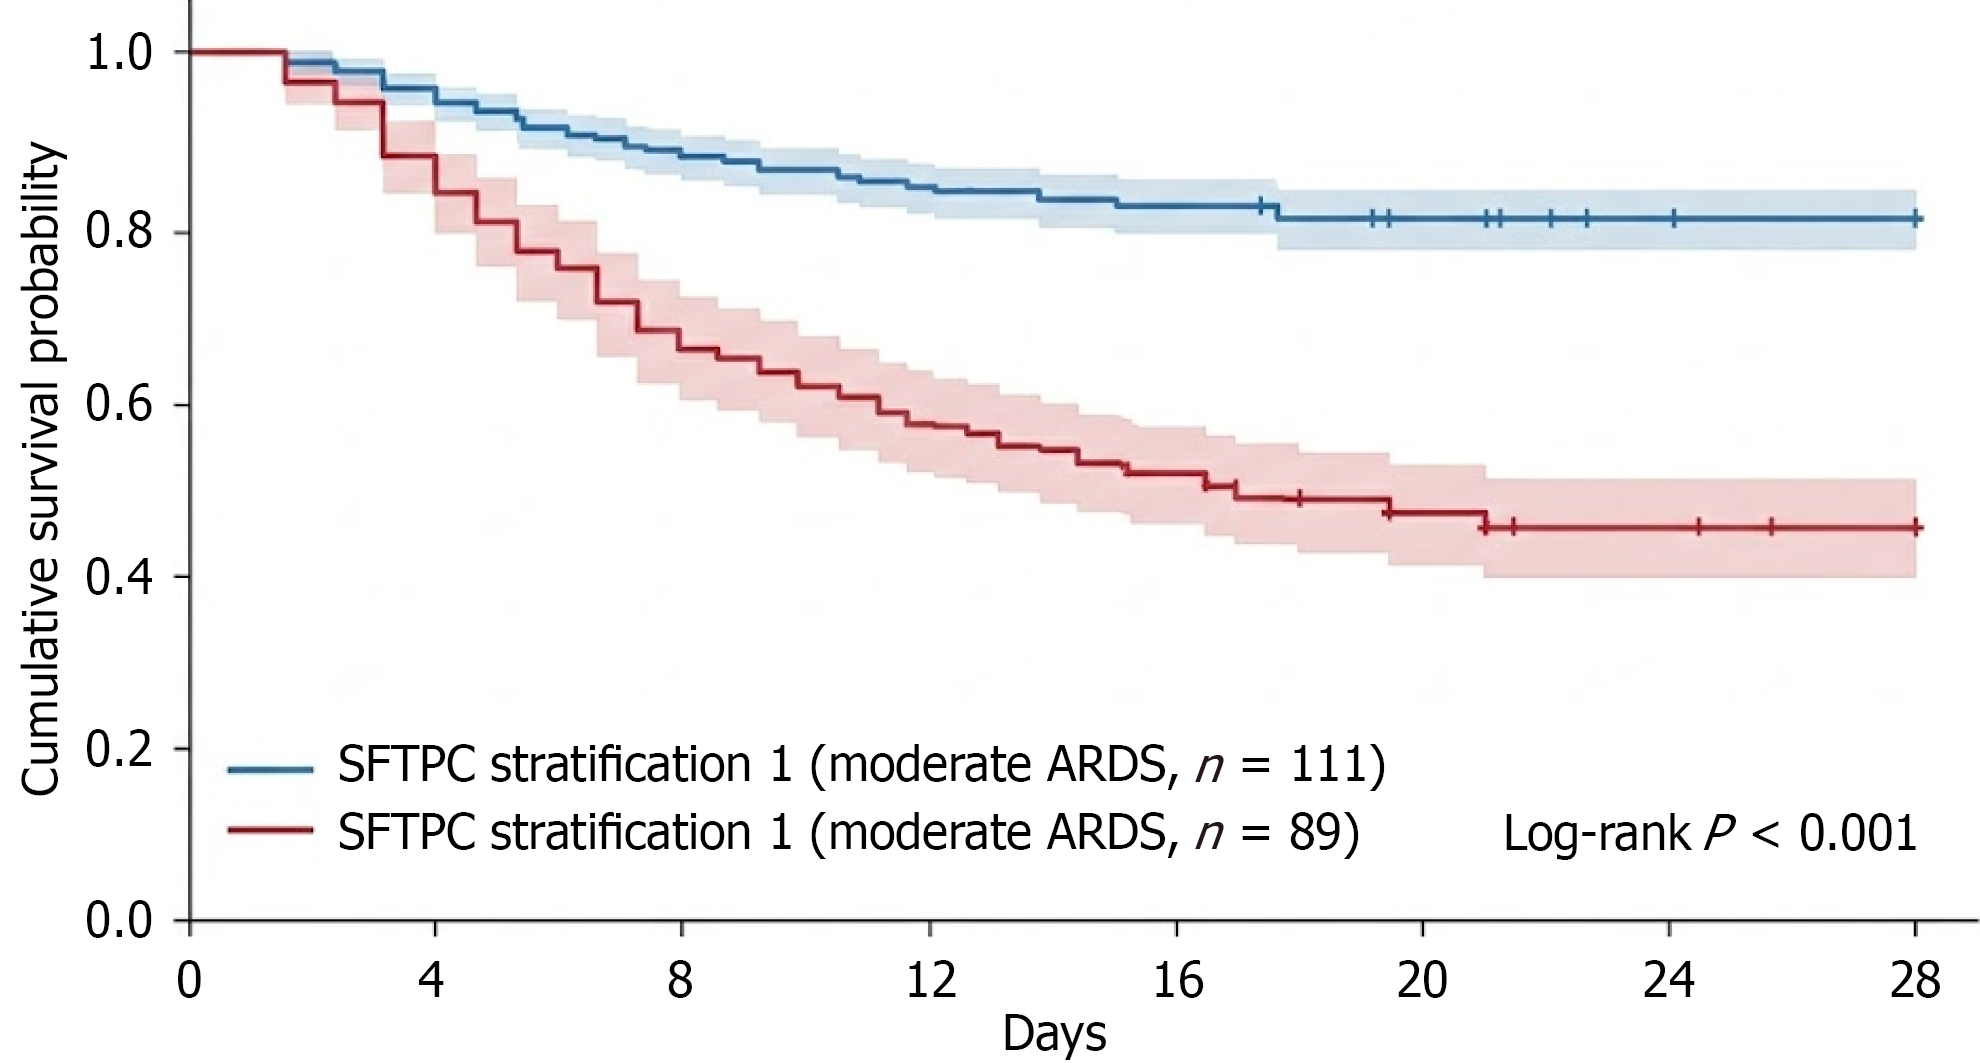
Figure 4 The 28-day survival curve or outcome comparison by surfactant protein C.
STTPC: Surfactant protein C; ARDS: Acute respiratory distress syndrome.
- Citation: Li WX, Jiang SC, Fan SL, Xing YX, Gong L. Stem/progenitor cell-driven immune microenvironment remodeling in sepsis-associated acute respiratory distress syndrome. World J Stem Cells 2026; 18(8): 121124
- URL: https://www.wjgnet.com/1948-0210/full/v18/i8/121124.htm
- DOI: https://dx.doi.org/10.4252/wjsc.121124