
















Copyright: ©Author(s) 2026.
World J Stem Cells. Aug 26, 2026; 18(8): 120831
Published online Aug 26, 2026. doi: 10.4252/wjsc.120831
Published online Aug 26, 2026. doi: 10.4252/wjsc.120831
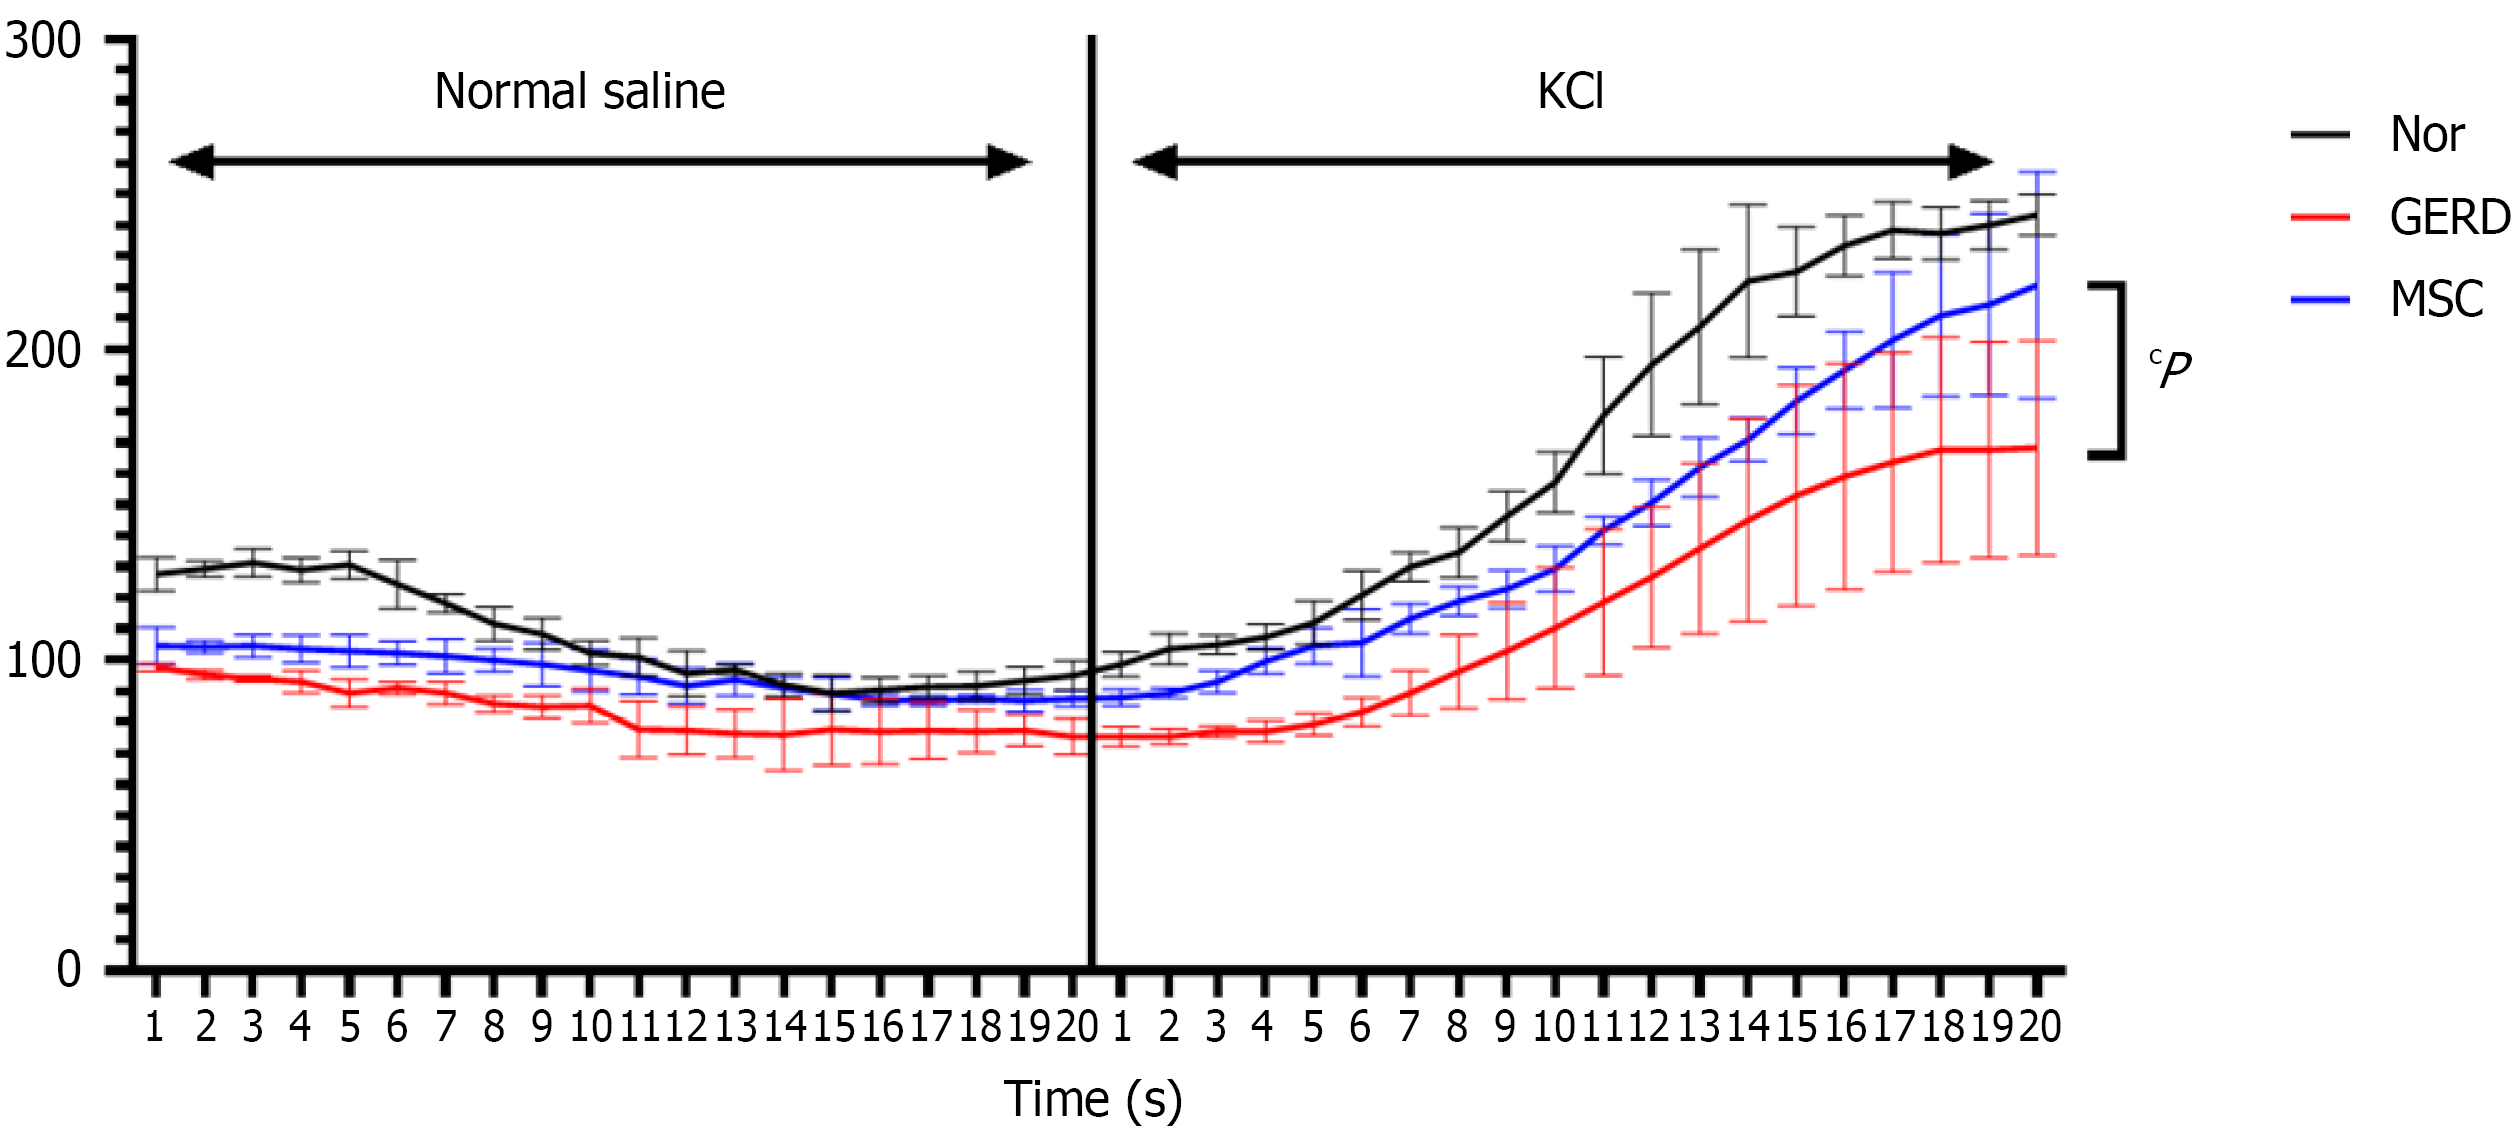
Figure 1 Mesenchymal stem cells restore impaired esophageal contractility in gastroesophageal reflux disease rats.
This figure displays representative recordings of esophageal pressure dynamics, visually comparing baseline and potassium chloride-stimulated contractions in normal, gastroesophageal reflux disease, and mesenchymal stem cell-treated rat groups. Error bars represent SEM. cP < 0.001 for mesenchymal stem cell group vs gastroesophageal reflux disease group. KCl: Potassium chloride; GERD: Gastroesophageal reflux disease; MSC: Mesenchymal stem cell.
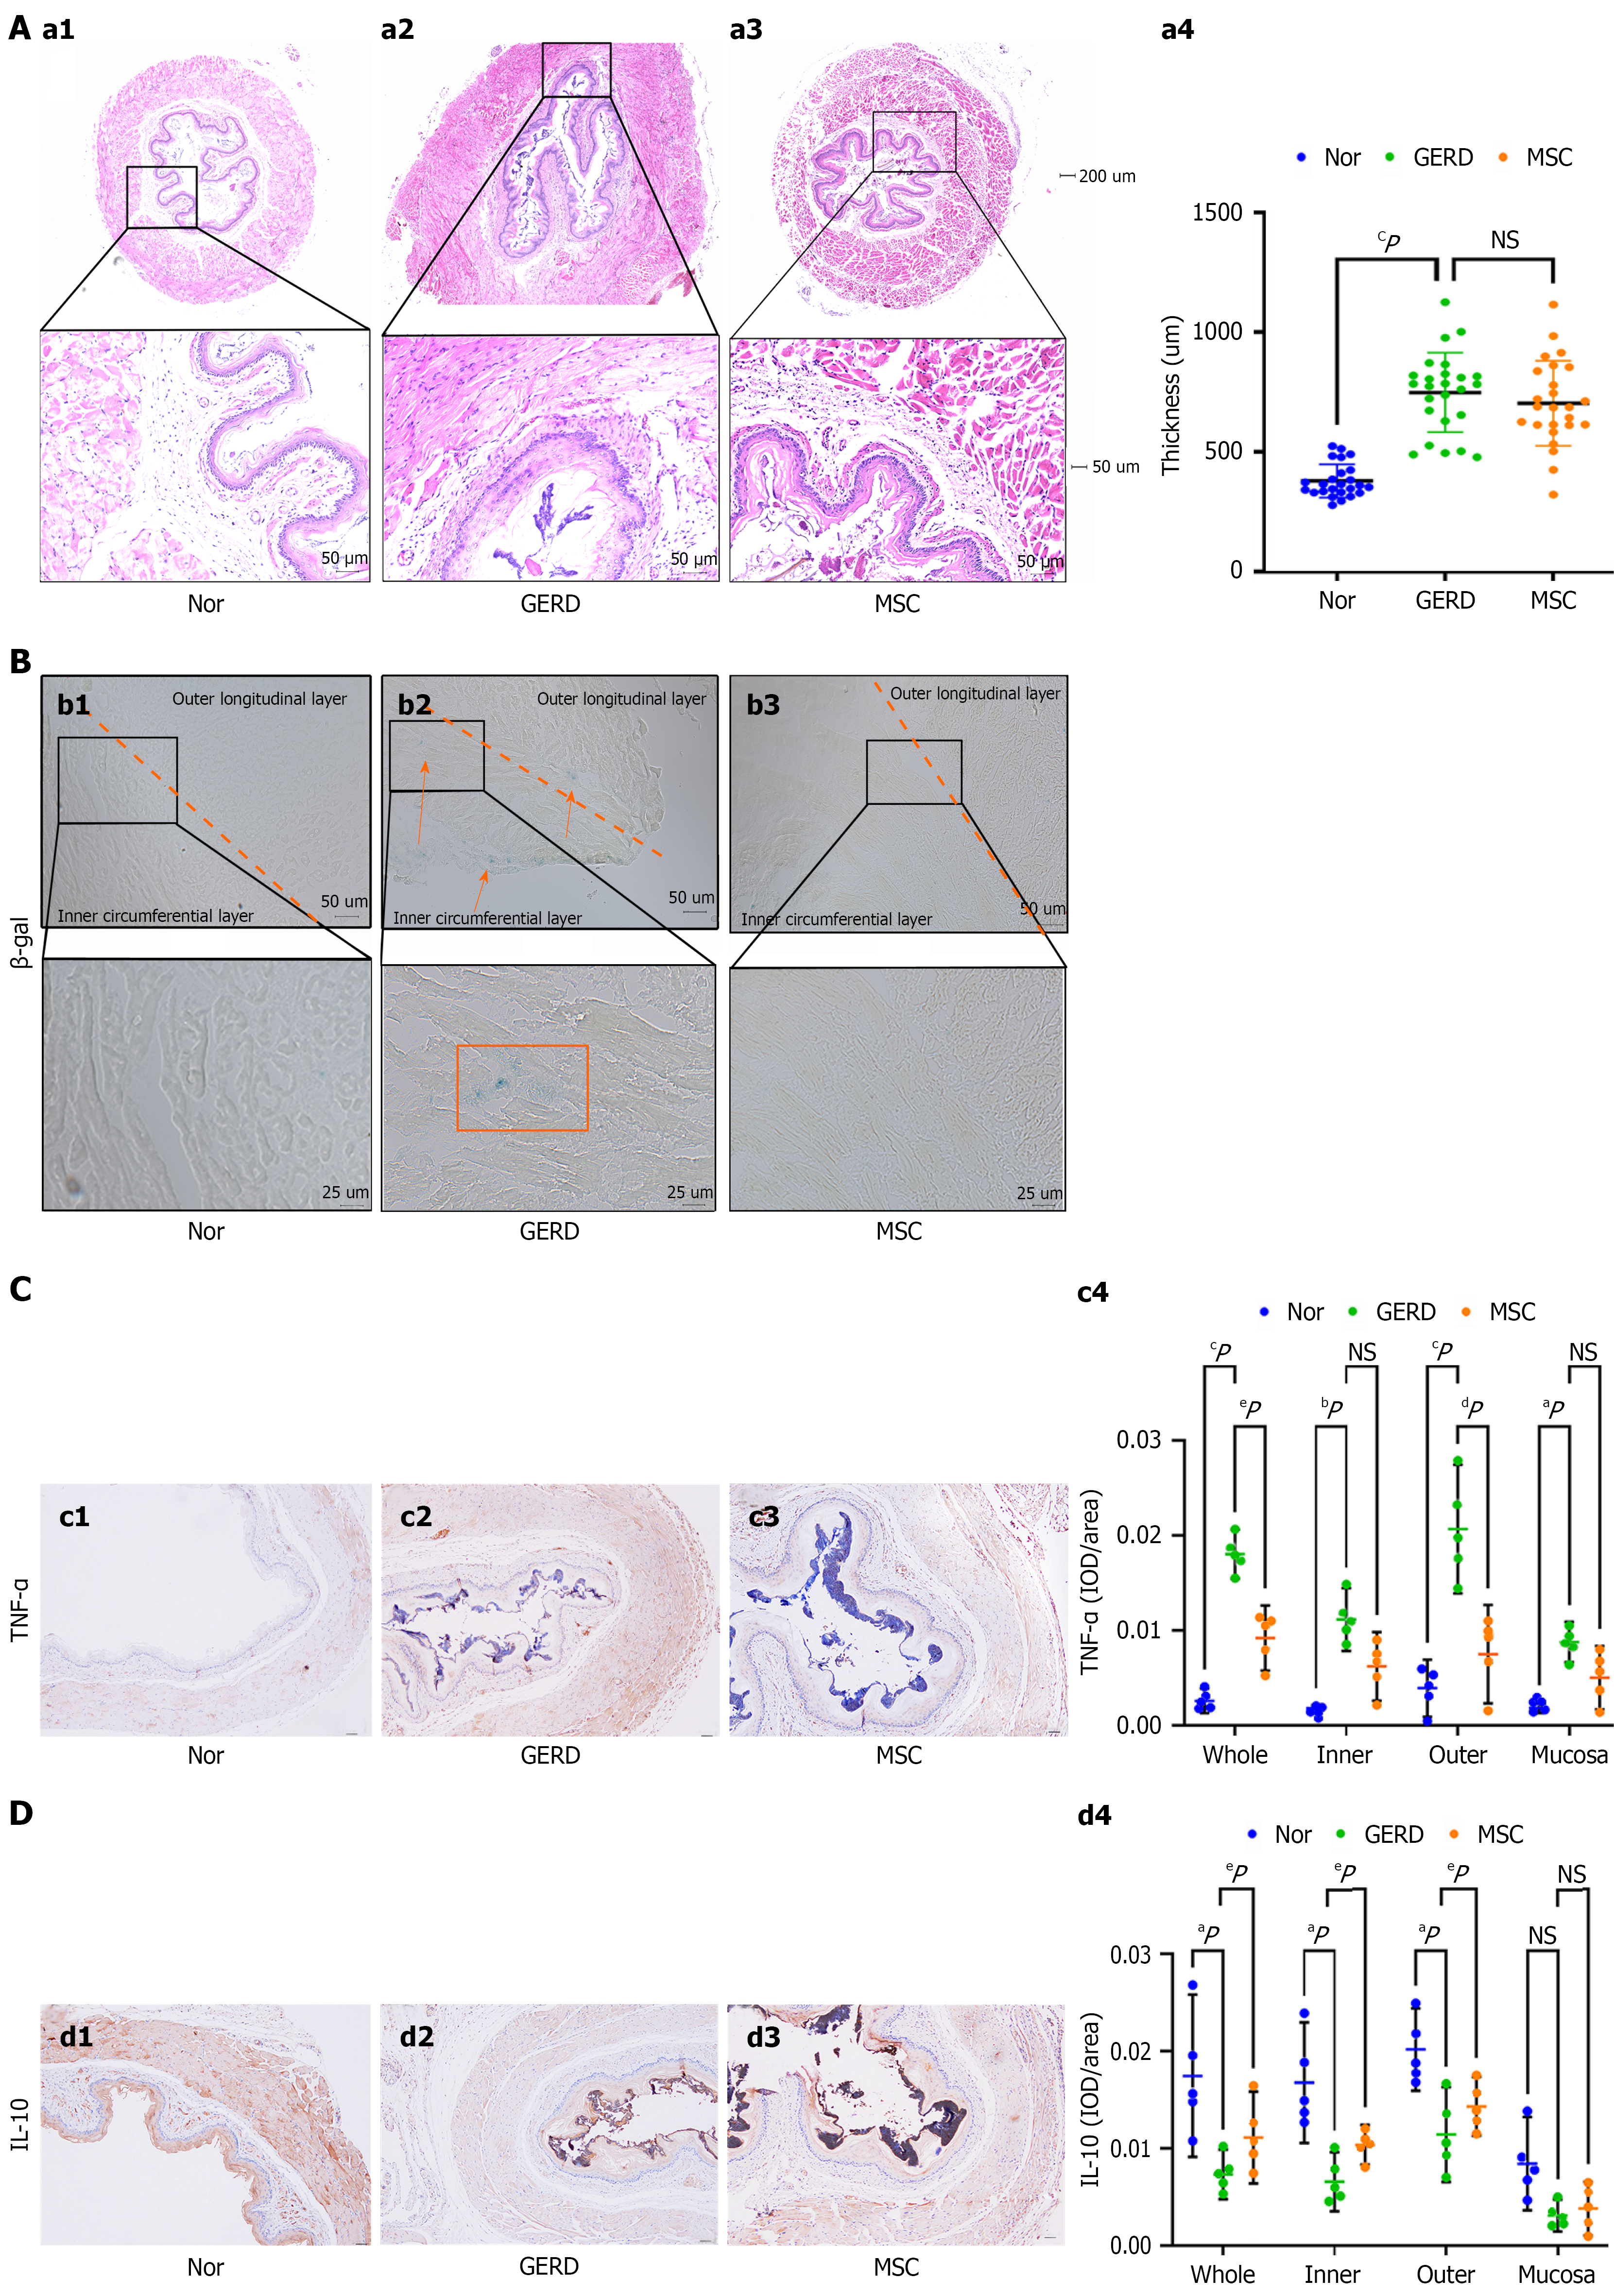
Figure 2 Mesenchymal stem cells mitigate esophageal aging and inflammation in gastroesophageal reflux disease rats.
This figure illustrates mesenchymal stem cell effects on esophageal aging and inflammation in gastroesophageal reflux disease rats. A: Hematoxylin and eosin staining histological sections; B: Β-galactosidase staining images indicating cellular senescence; C and D: Immunohistochemical images for tumor necrosis factor-α (pro-inflammatory marker) and interleukin-10 (anti-inflammatory marker), respectively. Error bars represent SEM. aP < 0.05, bP < 0.01, cP < 0.001 for gastroesophageal reflux disease group vs normal group; dP < 0.05, eP < 0.01 for mesenchymal stem cell group vs gastroesophageal reflux disease group. NS: Not significant; Nor: Normal; GERD: Gastroesophageal reflux disease; MSC: Mesenchymal stem cell; β-gal: Β-galactosidase; TNF: Tumor necrosis factor; IL: Interleukin.
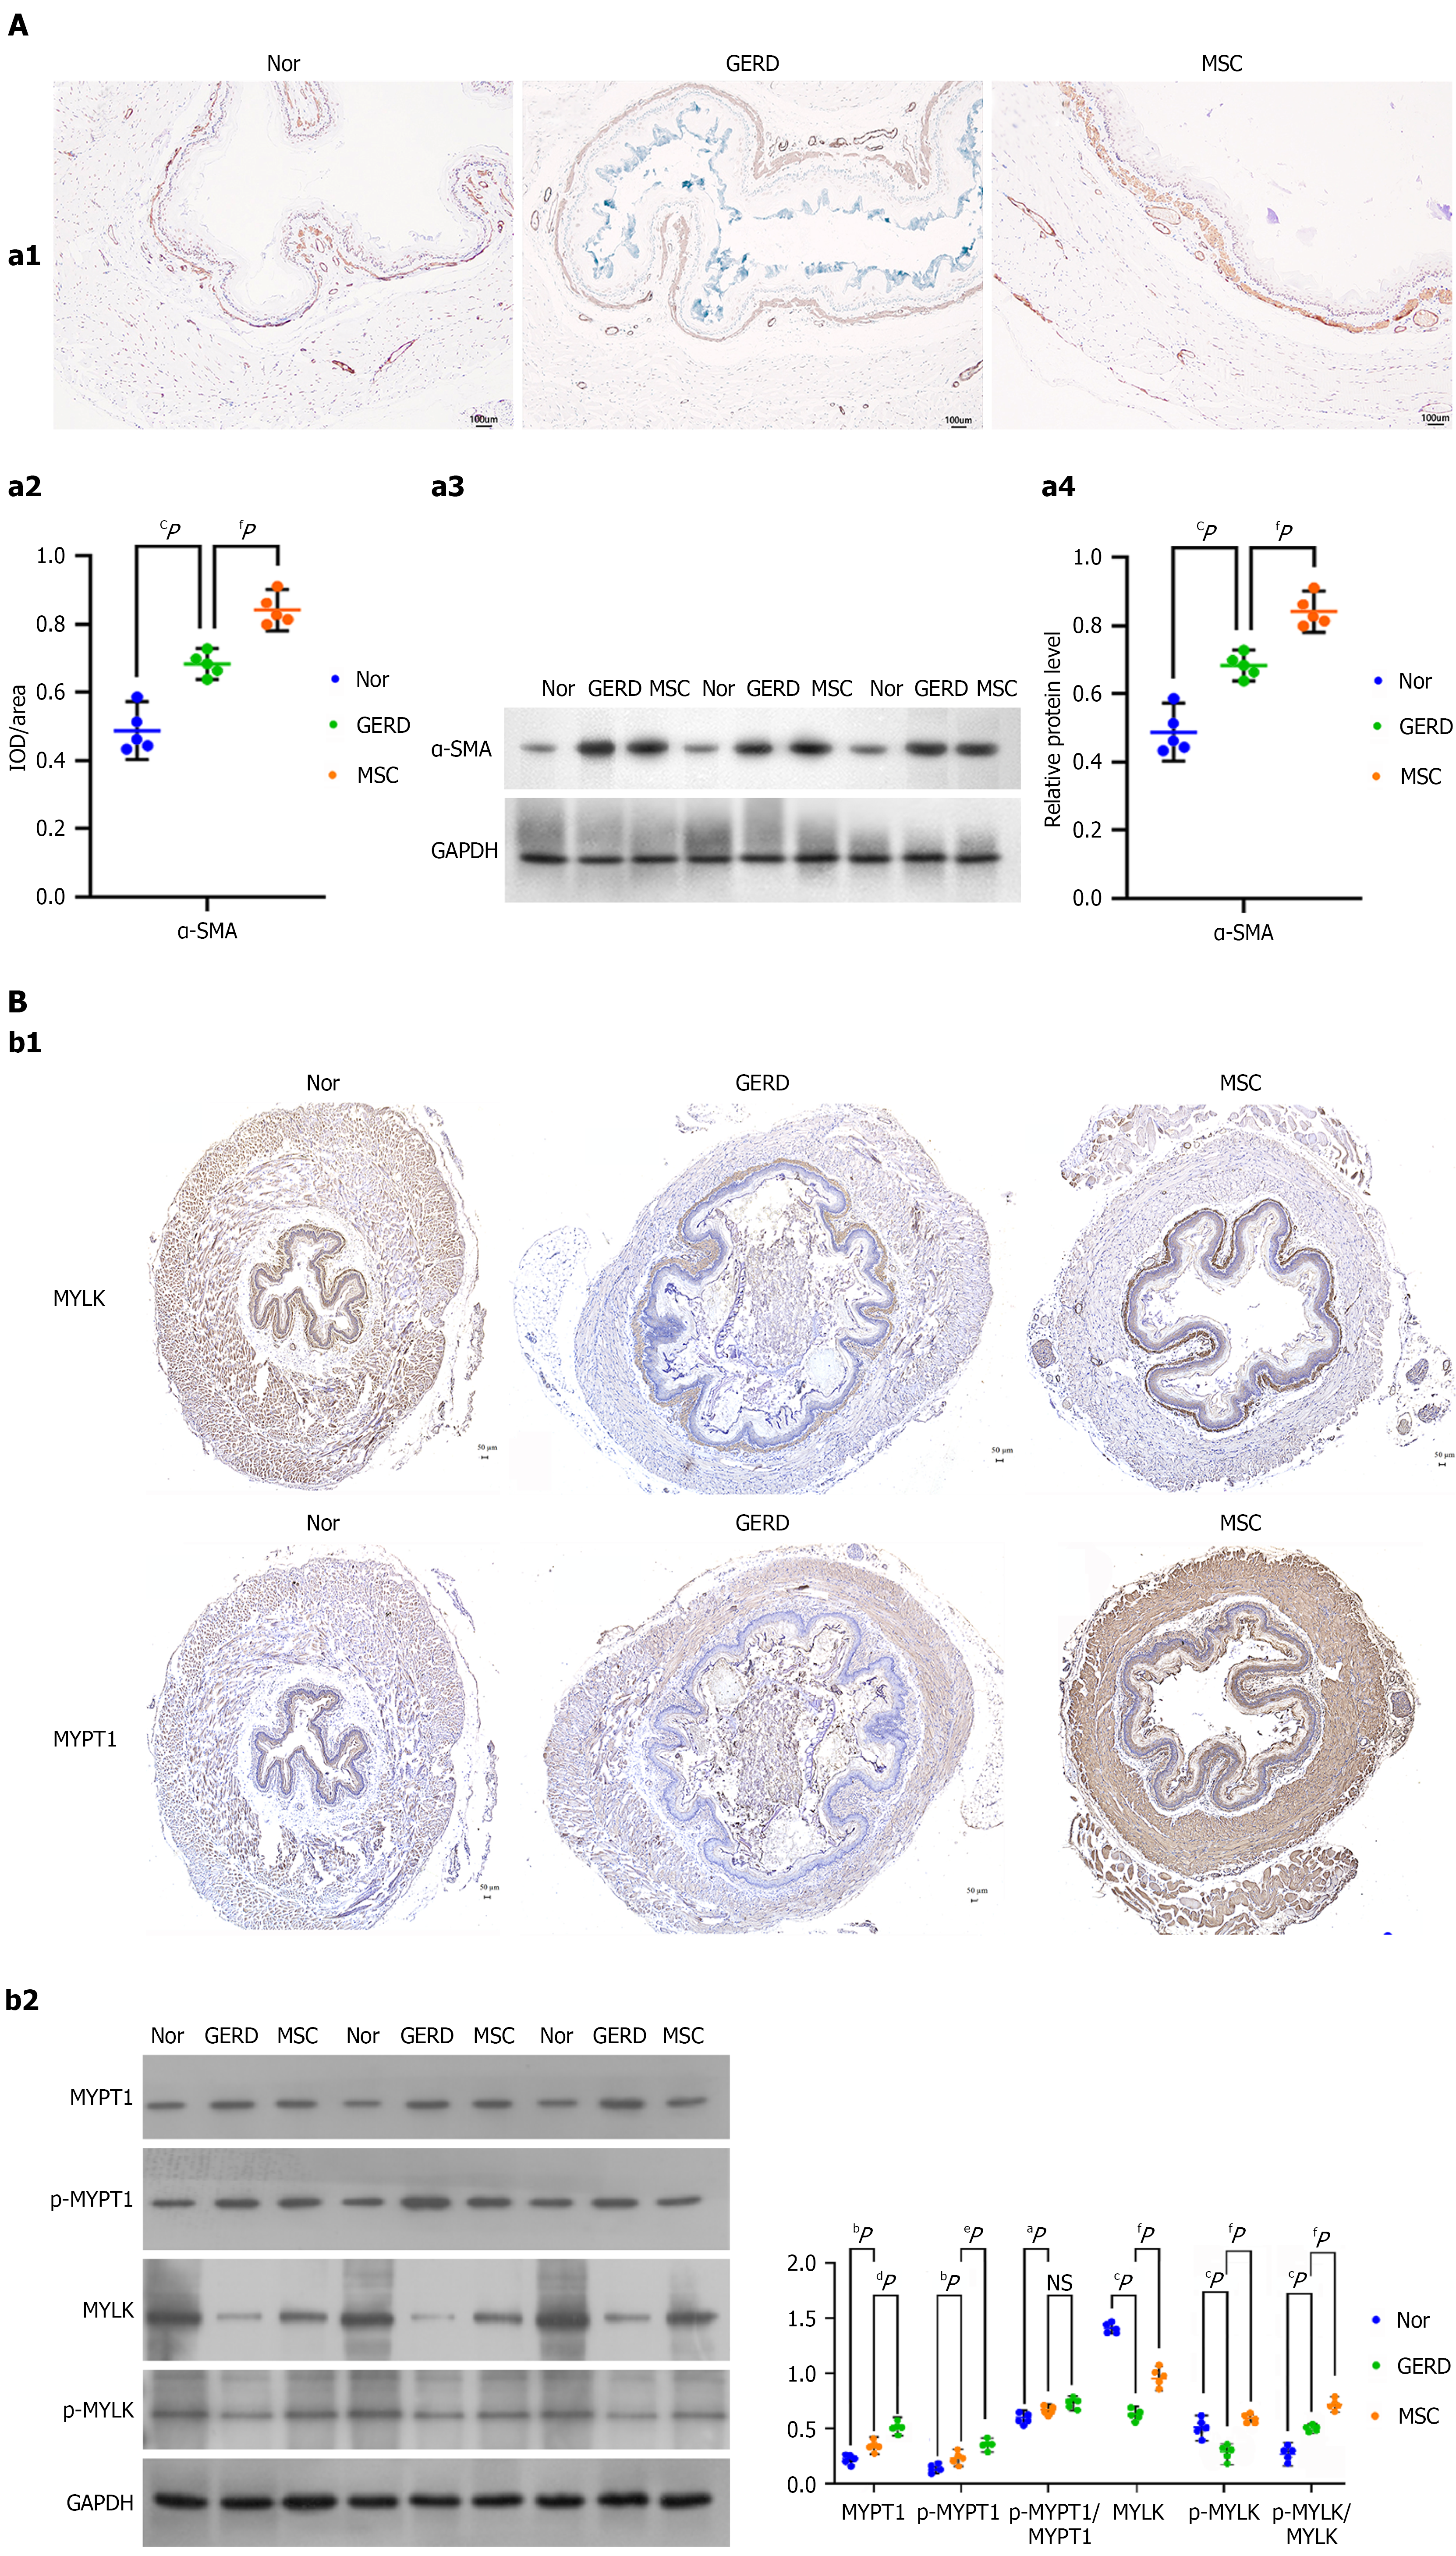
Figure 3 Mesenchymal stem cells modulate smooth muscle contraction-related proteins in gastroesophageal reflux disease rat esophagus.
This figure details how mesenchymal stem cells affect smooth muscle contraction-related proteins in gastroesophageal reflux disease rat esophagus. A: Immunohistochemical staining and western blot images for alpha-smooth muscle actin; B: Immunohistochemical staining and representative western blot images for myosin light chain kinase, phosphorylated-myosin light chain kinase, myosin phosphatase target subunit 1, and phosphorylated-myosin phosphatase target subunit 1. Error bars represent SEM. aP < 0.05, bP < 0.01, cP < 0.001 for gastroesophageal reflux disease group vs normal group; dP < 0.05, eP < 0.01, fP < 0.001 for mesenchymal stem cell group vs gastroesophageal reflux disease group. NS: Not significant; Nor: Normal; GERD: Gastroesophageal reflux disease; MSC: Mesenchymal stem cell; α-SMA: Alpha-smooth muscle actin; MYLK: Myosin light chain kinase; p-MYLK: Phosphorylated-myosin light chain kinase; MYPT1: Myosin phosphatase target subunit 1; p-MYPT1: Phosphorylated-myosin phosphatase target subunit 1.
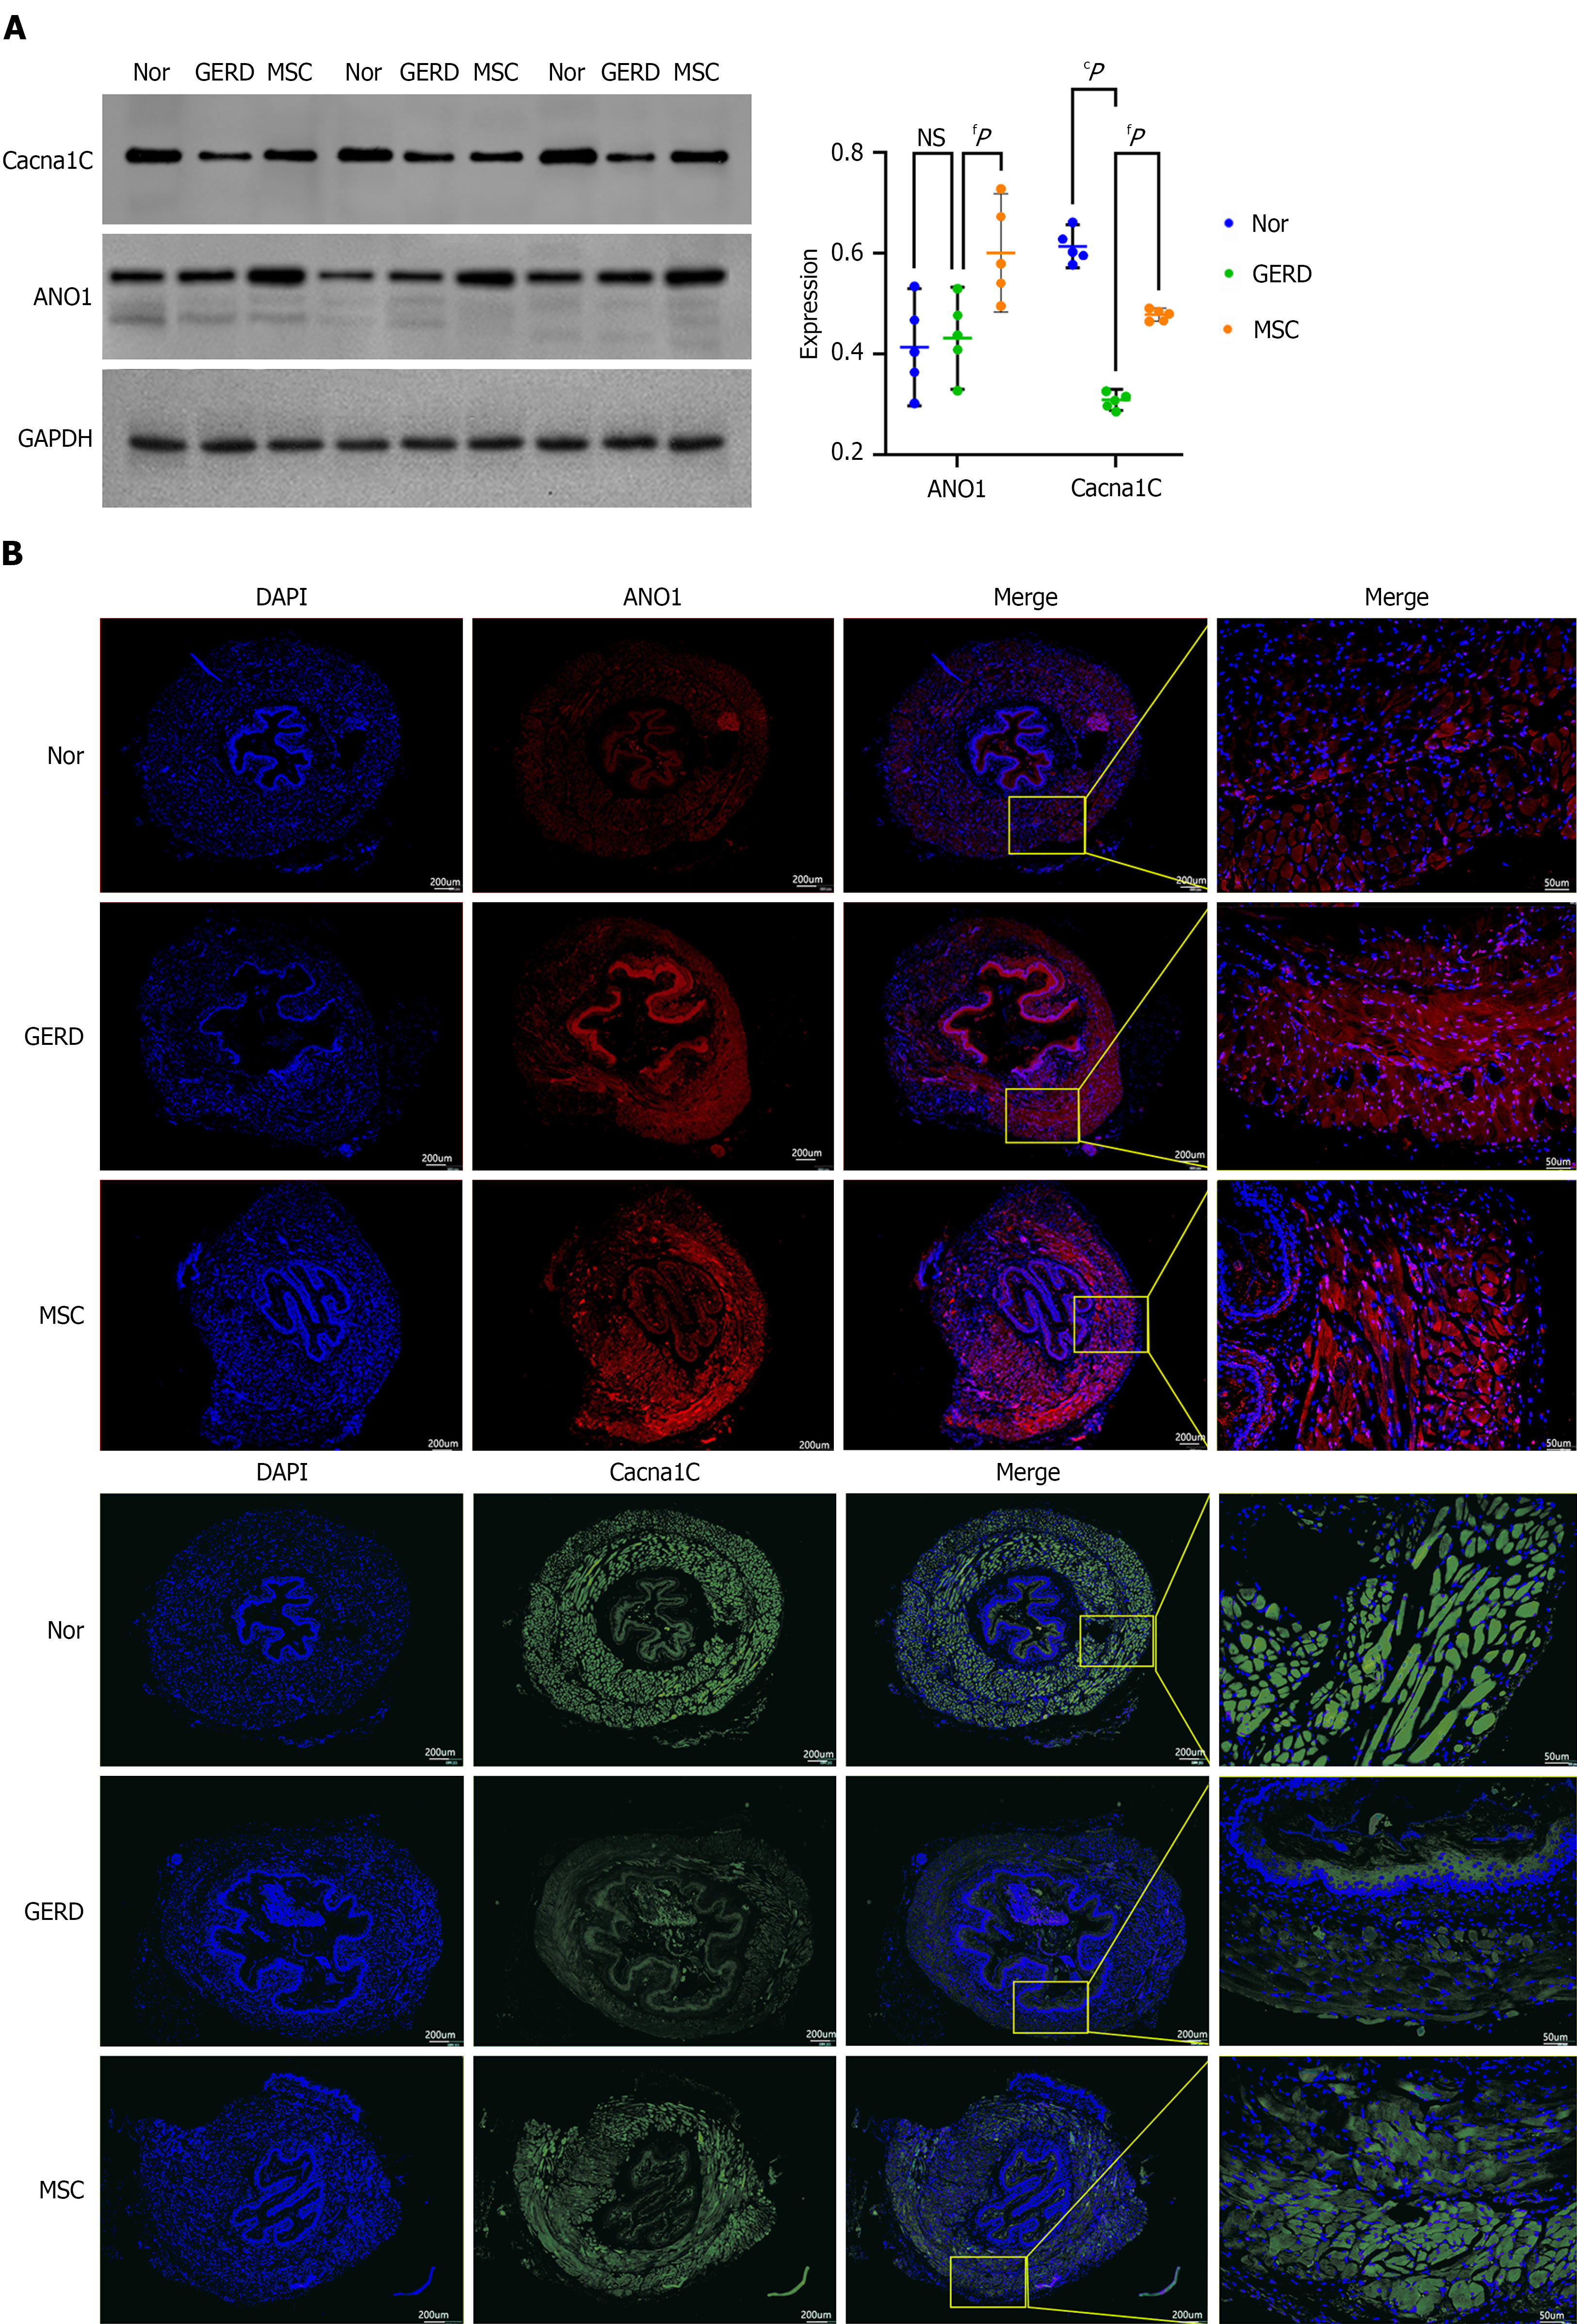
Figure 4 Mesenchymal stem cells modulate on channels in gastroesophageal reflux disease rat esophagus.
This figure demonstrates the modulation of ion channels by mesenchymal stem cells in gastroesophageal reflux disease rat esophagus. A: Western blot images for anoctamin 1 and calcium voltage-gated channel subunit alpha1 C; B: Immunofluorescence staining images for anoctamin 1 and calcium voltage-gated channel subunit alpha1 C. Error bars represent SEM. cP < 0.001 for gastroesophageal reflux disease group vs normal group; fP < 0.001 for mesenchymal stem cell group vs gastroesophageal reflux disease group. NS: Not significant; Nor: Normal; GERD: Gastroesophageal reflux disease; MSC: Mesenchymal stem cell; ANO1: Anoctamin 1; CACNA1C: Calcium voltage-gated channel subunit alpha1 C.
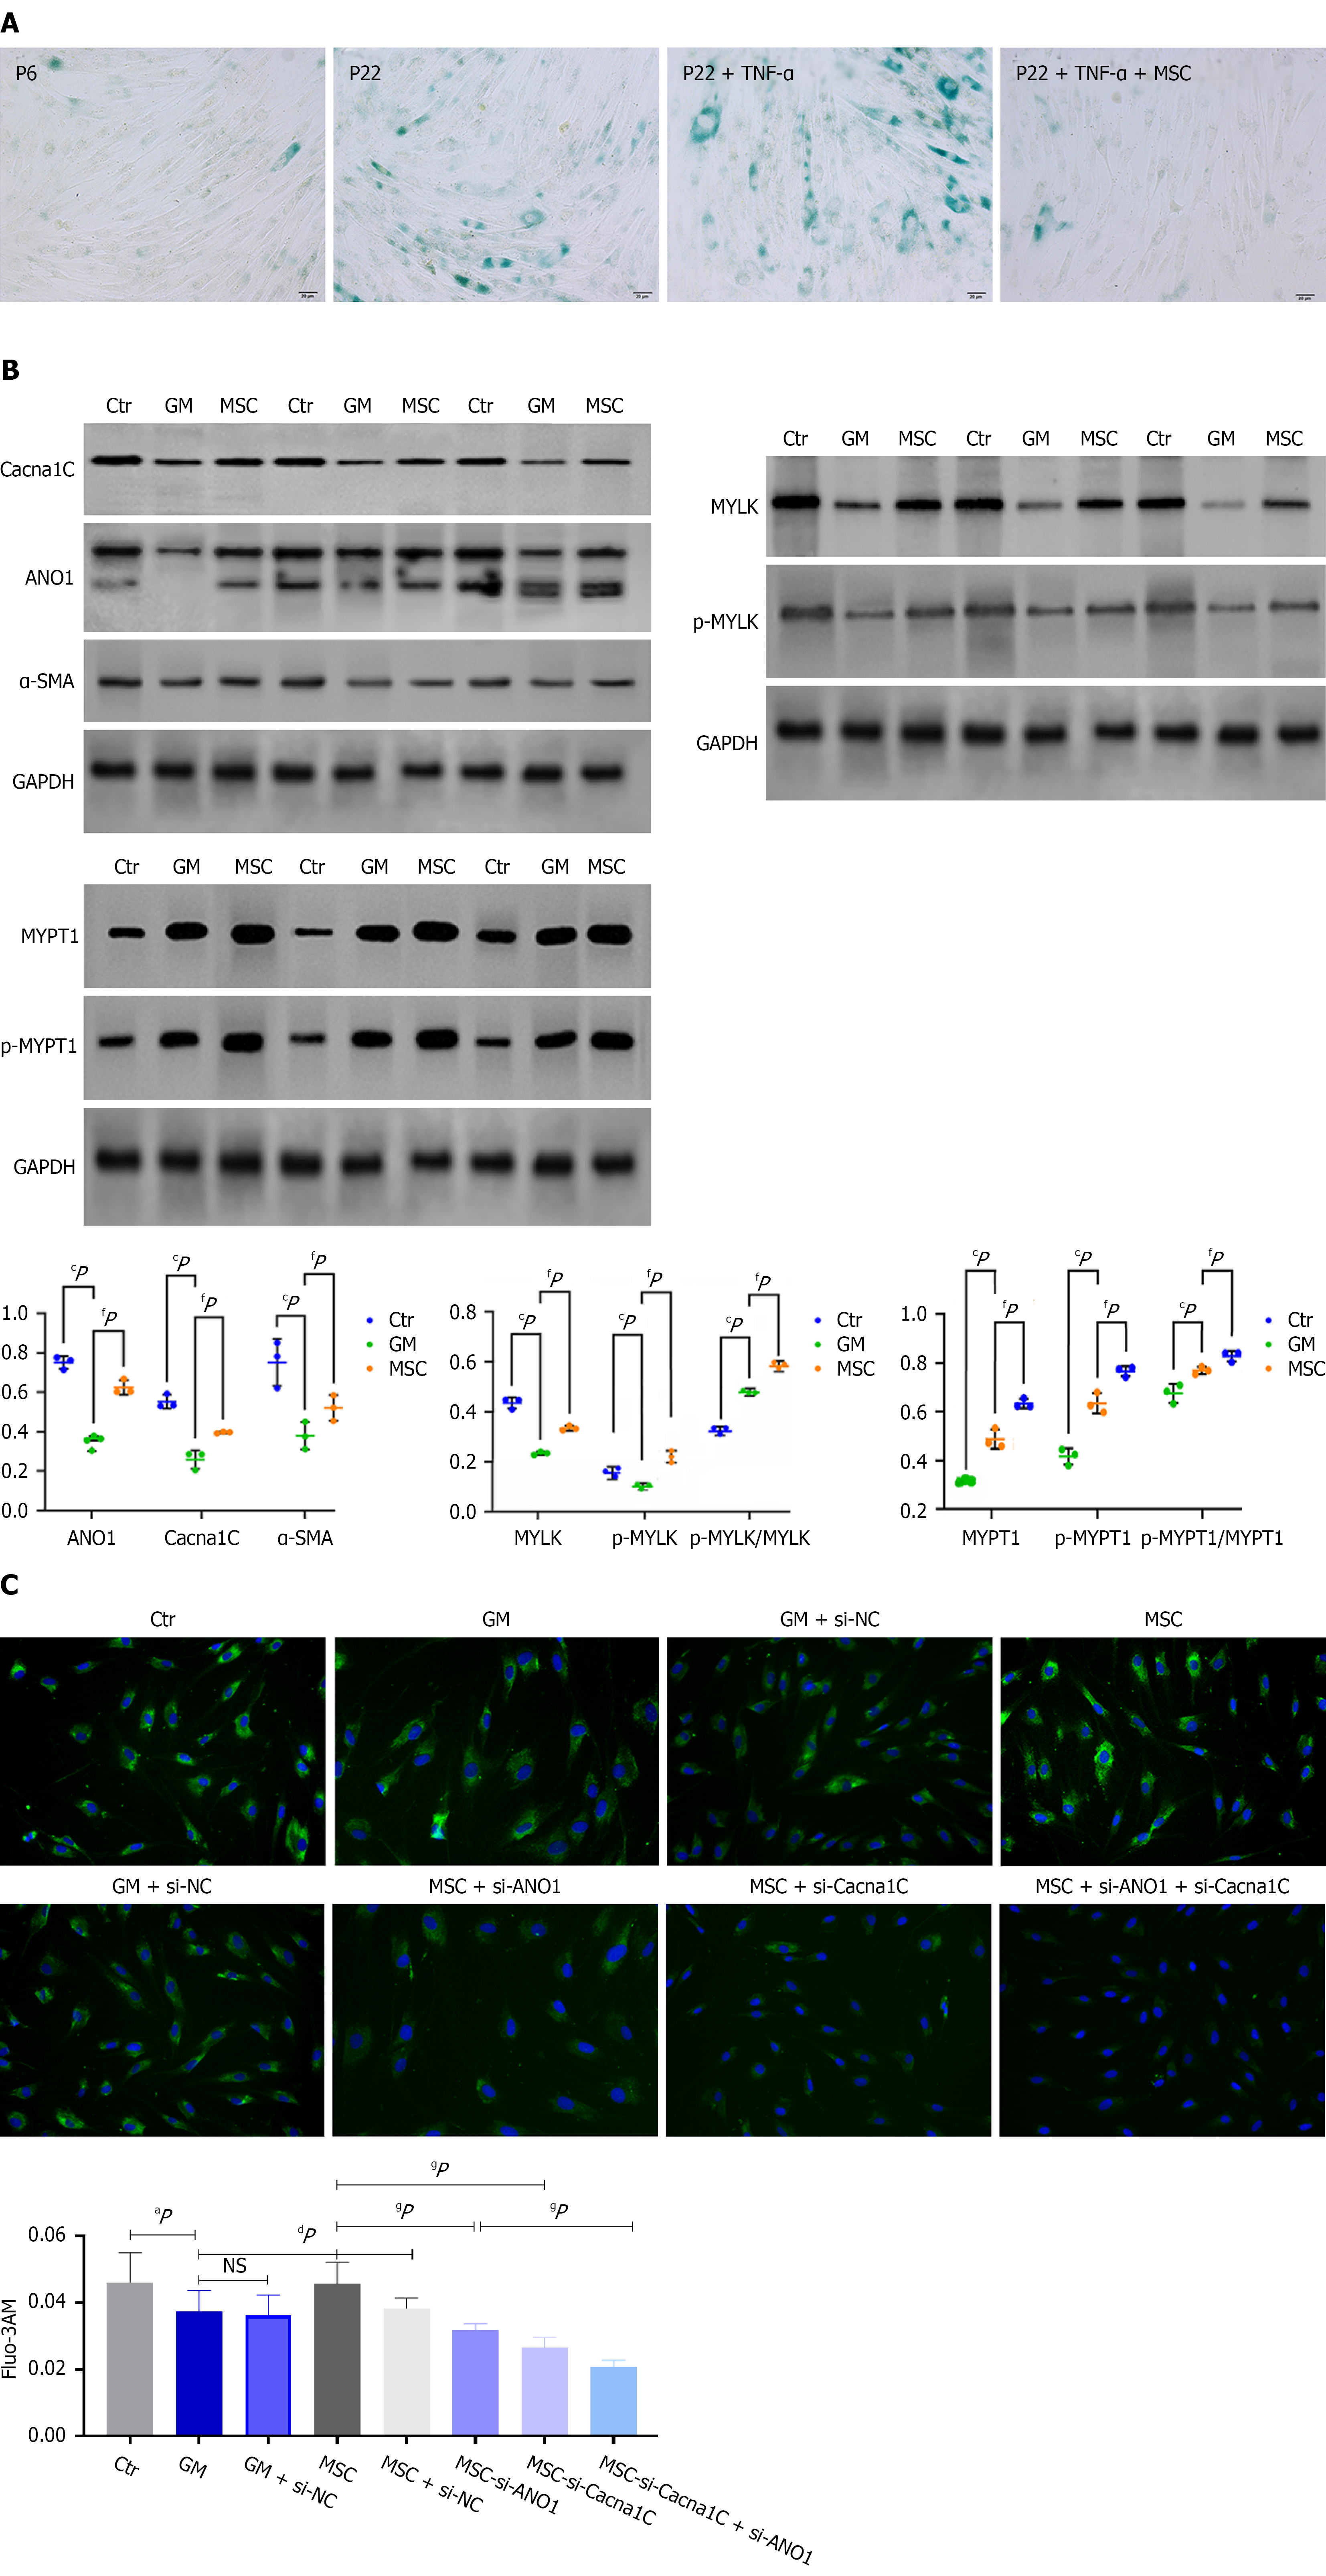
Figure 5 Mesenchymal stem cells ameliorate tumor necrosis factor-α-accelerated cellular senescence, protein dysregulation, and calcium signaling in human esophageal smooth muscle cells.
This figure investigates the effects of mesenchymal stem cells on human esophageal smooth muscle cells under tumor necrosis factor-α exposure. A: Β-galactosidase staining images indicating cellular senescence; B: Western blot images and quantification for myosin light chain kinase, phosphorylated-myosin light chain kinase, alpha-smooth muscle actin, myosin phosphatase target subunit 1, phosphorylated-myosin phosphatase target subunit 1, anoctamin 1 and calcium voltage-gated channel subunit alpha1 C protein levels; C: Fluorescence images of Fluo-3, AM staining and quantification of intracellular Ca2+ intensity. Error bars represent SEM. aP < 0.05 for gastroesophageal reflux disease model group vs control group; cP < 0.001 for mesenchymal stem cell group vs gastroesophageal reflux disease model group; dP < 0.05 for mesenchymal stem cell group vs gastroesophageal reflux disease model group; fP < 0.001 for mesenchymal stem cell group vs gastroesophageal reflux disease model group; gP < 0.001 for si-ANO1/(+)Cacna1C group vs mesenchymal stem cell group. TNF: Tumor necrosis factor; NS: Not significant; Ctr: Control; GM: Gastroesophageal reflux disease model; MSC: Mesenchymal stem cell; α-SMA: Alpha-smooth muscle actin; MYLK: Myosin light chain kinase; p-MYLK: Phosphorylated-myosin light chain kinase; MYPT1: Myosin phosphatase target subunit 1; p-MYPT1: Phosphorylated-myosin phosphatase target subunit 1; ANO1: Anoctamin 1; CACNA1C: Calcium voltage-gated channel subunit alpha1 C; si-NC: Negative control small interfering RNA.
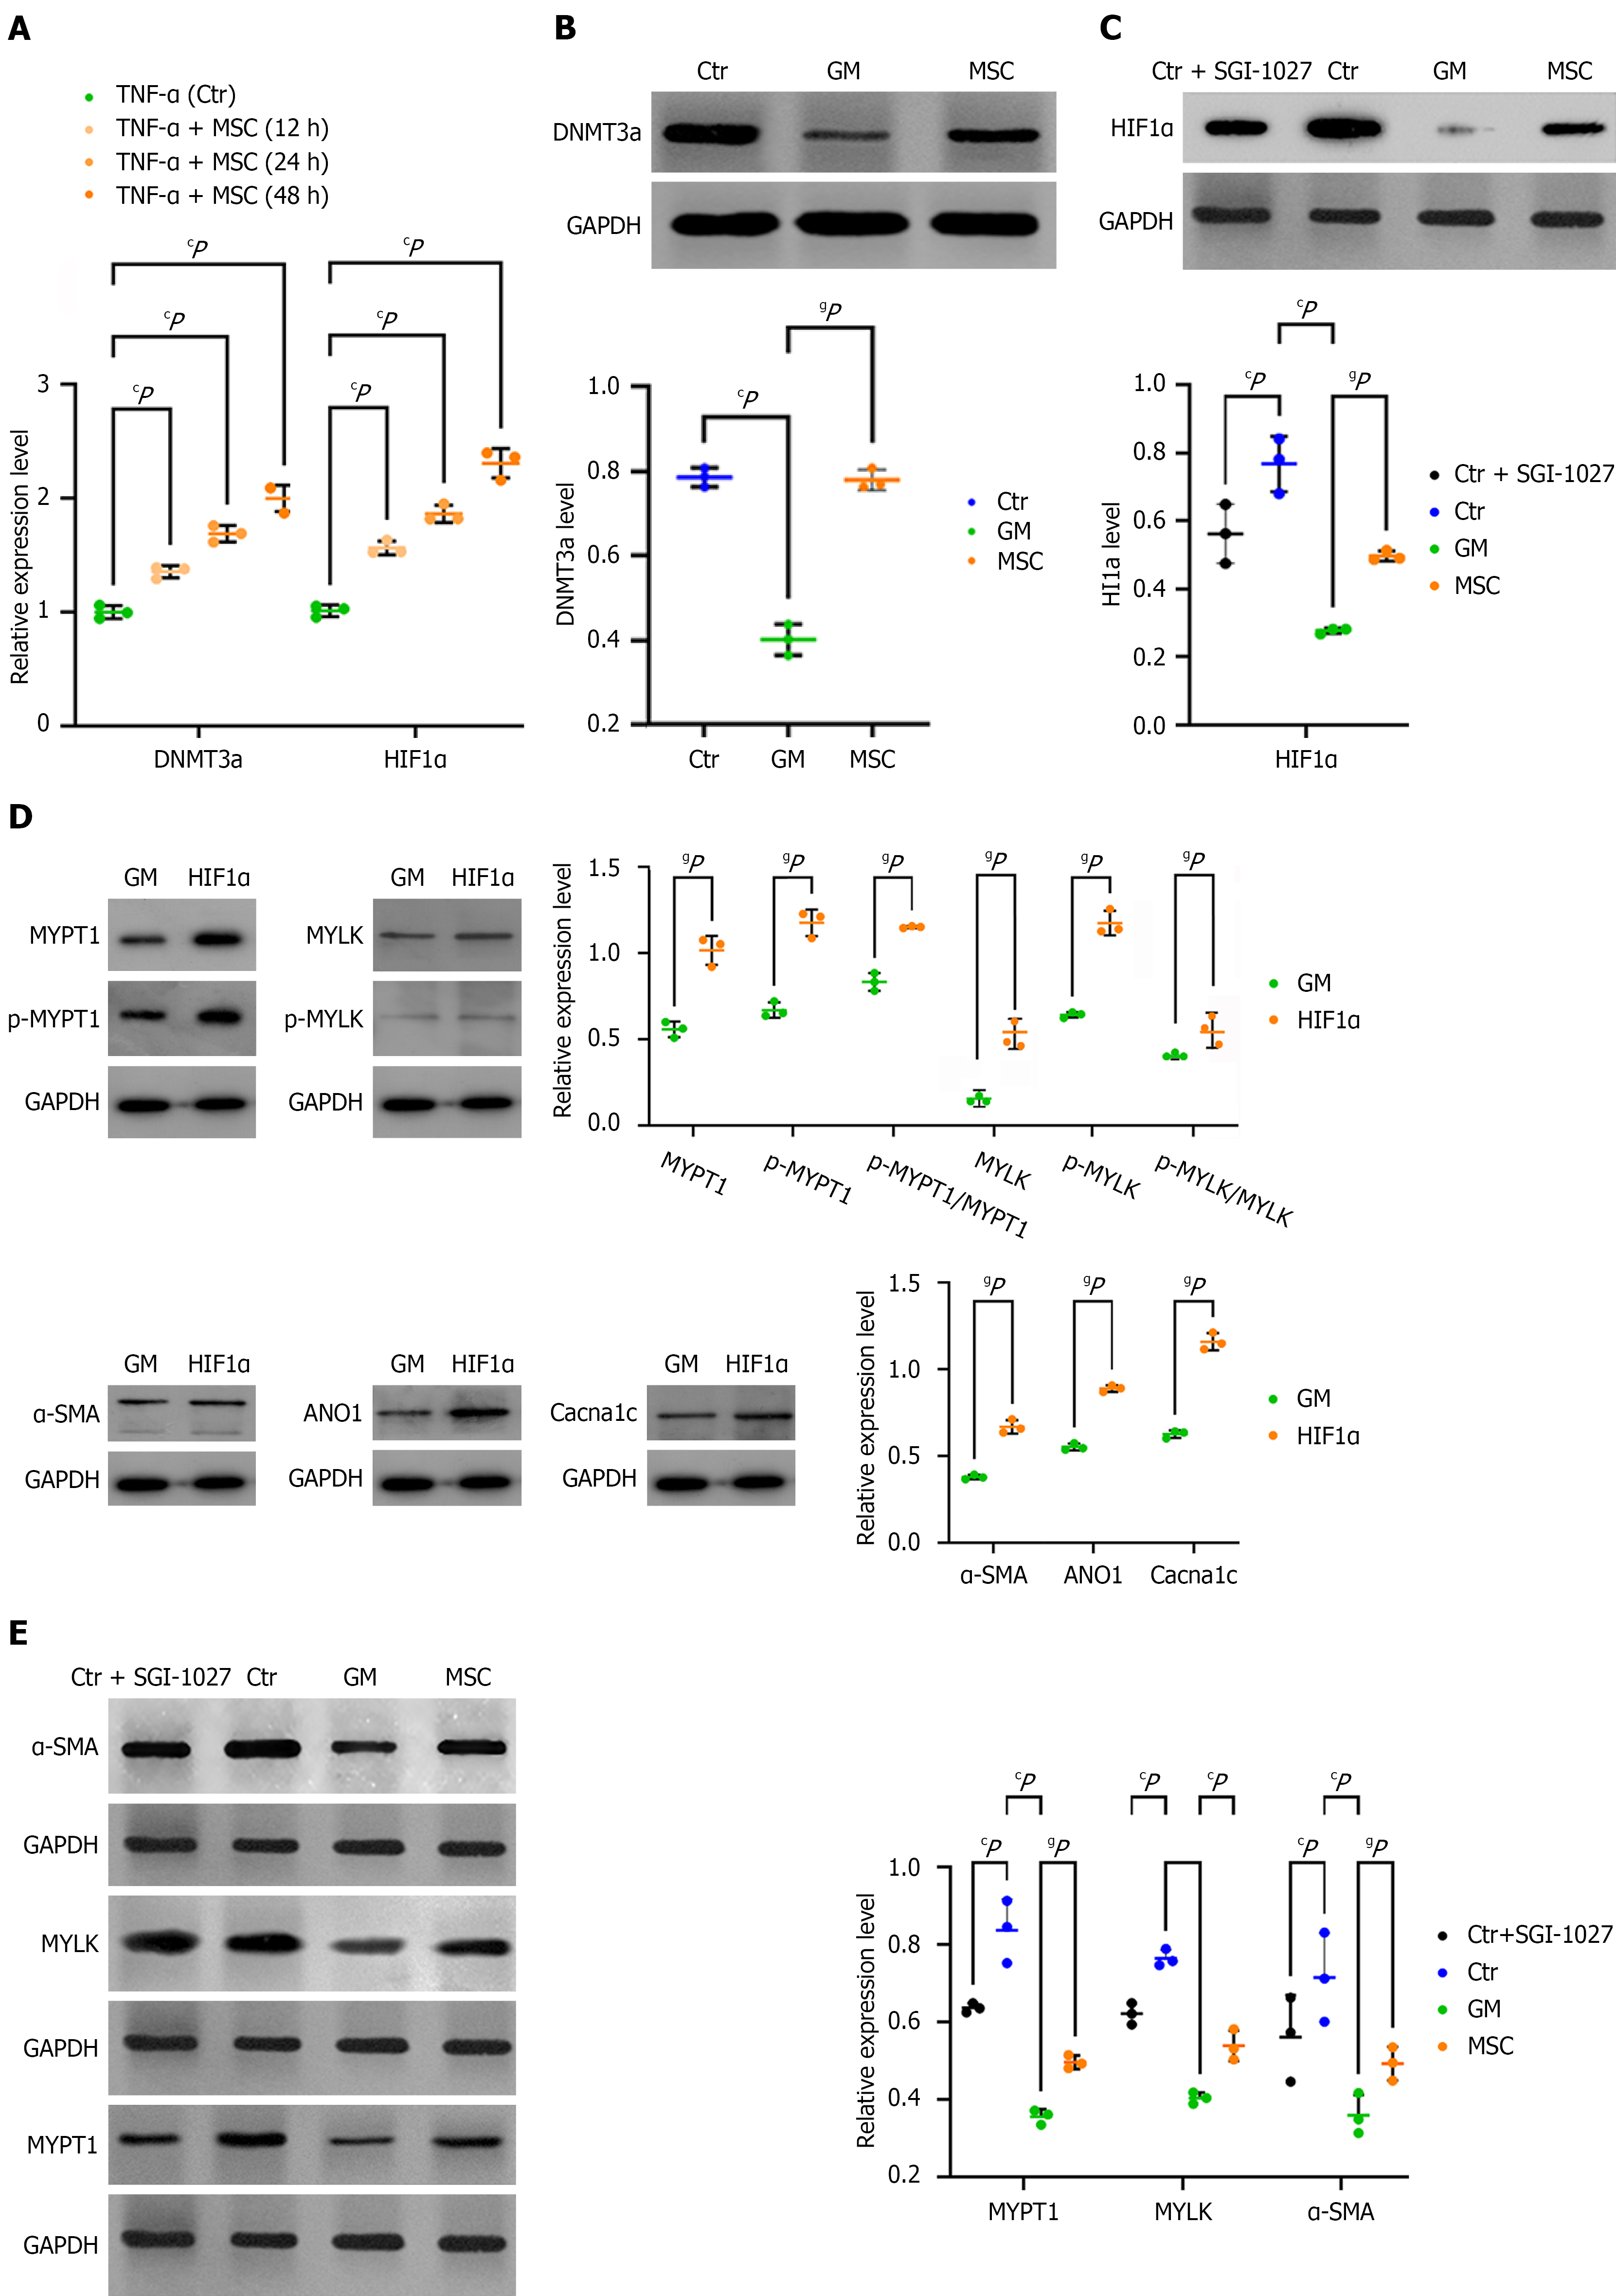
Figure 6 Mesenchymal stem cells modulate contraction-related proteins through DNA methyltransferase 3a and hypoxia-inducible factor 1 alpha pathway.
This figure explores the molecular pathways by which mesenchymal stem cells modulate contraction-related proteins. A: Time-dependent mRNA expression levels of DNA methyltransferase 3a (DNMT3a) and hypoxia-inducible factor 1 alpha (HIF1α), likely as line graphs; B and C: Western blot images and quantification for DNMT3a and HIF1α protein levels in human esophageal smooth muscle cells (HESMCs), respectively; D: Western blot images and quantification for alpha-smooth muscle actin, anoctamin 1, calcium voltage-gated channel subunit alpha1 C, myosin light chain kinase, phosphorylated-myosin light chain kinase, ratio analysis, myosin phosphatase target subunit 1, phosphorylated-myosin phosphatase target subunit 1, ratio analysis in HESMCs with HIF1α overexpression; E: Western blot images and quantification for myosin light chain kinase, myosin phosphatase target subunit 1, and alpha-smooth muscle actin in HESMCs treated with a DNMT3a inhibitor. Error bars represent SEM. cP < 0.001 vs control; gP < 0.001 vs gastroesophageal reflux disease model group. TNF: Tumor necrosis factor; MSC: Mesenchymal stem cell; Ctr: Control; GM: Gastroesophageal reflux disease model; α-SMA: Alpha-smooth muscle actin; MYLK: Myosin light chain kinase; p-MYLK: Phosphorylated-myosin light chain kinase; MYPT1: Myosin phosphatase target subunit 1; p-MYPT1: Phosphorylated-myosin phosphatase target subunit 1; ANO1: Anoctamin 1; CACNA1C: Calcium voltage-gated channel subunit alpha1 C; DNMT3a: DNA methyltransferase 3a; HIF1α: Hypoxia-inducible factor 1 alpha.
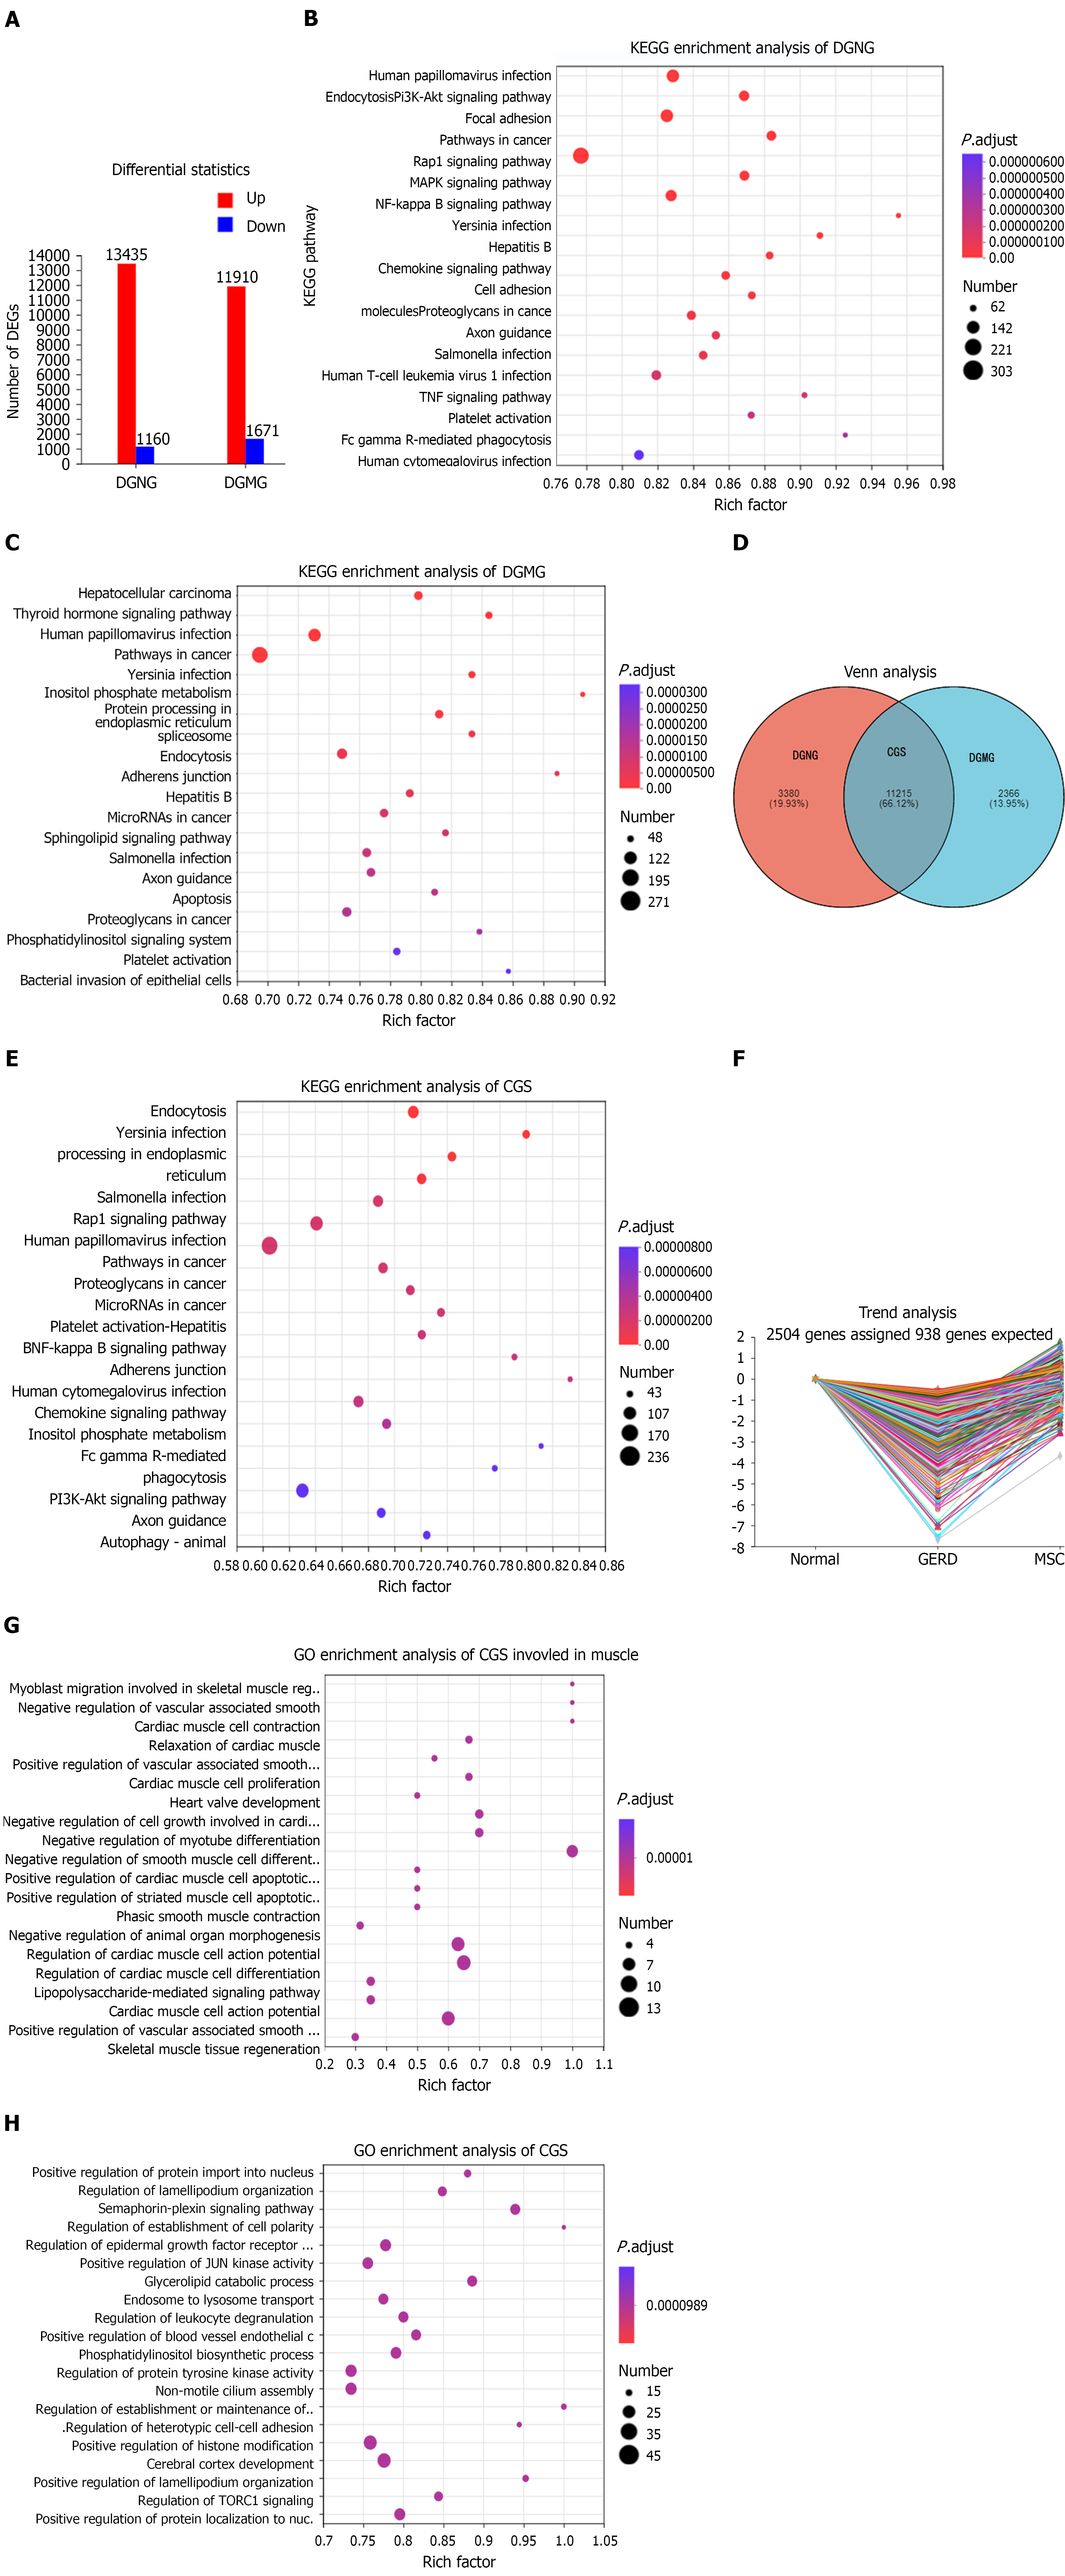
Figure 7 Transcriptomic analysis reveals mesenchymal stem cell-mediated pathway modulation.
This figure presents a series of bioinformatics analyses comparing gene expression. A: Bar chart illustrating the number of significantly differentially expressed genes; B: Kyoto Encyclopedia of Genes and Genomes (KEGG) pathway enrichment analysis of genes differentially expressed between the gastroesophageal reflux disease and normal groups (DGNG); C: KEGG pathway enrichment analysis of genes differentially expressed between the gastroesophageal reflux disease and mesenchymal stem cell groups (DGMG); D: Venn diagram illustrating the overlap between differentially expressed genes in DGNG and DGMG; E: KEGG pathway enrichment analysis of common genes; F: Trend analysis of common genes; G: Gene Ontology (GO) enrichment analysis specifically focusing on muscle-related clusters within common genes; H: GO enrichment analysis of common genes. The bubble plot shows enriched pathways, with bubble size indicating the number of genes and color representing the adjusted P-value in KEGG and GO enrichment analysis. DEGs: Differentially expressed genes; KEGG: Kyoto Encyclopedia of Genes and Genomes; CGS: Common genes; GERD: Gastroesophageal reflux disease; MSC: Mesenchymal stem cell; GO: Gene Ontology.
- Citation: Li Y, Zhu WY, Zhang B, Wang ZR, Chen ZY, Chen QQ, Linghu EQ. Mesenchymal stem cells therapy ameliorates esophageal dysmotility in gastroesophageal reflux disease by modulating smooth muscle contractility, alleviating senescence by targeting the DNMT3a-HIF1α axis. World J Stem Cells 2026; 18(8): 120831
- URL: https://www.wjgnet.com/1948-0210/full/v18/i8/120831.htm
- DOI: https://dx.doi.org/10.4252/wjsc.120831