
















Copyright: ©Author(s) 2026.
World J Stem Cells. Aug 26, 2026; 18(8): 117617
Published online Aug 26, 2026. doi: 10.4252/wjsc.117617
Published online Aug 26, 2026. doi: 10.4252/wjsc.117617
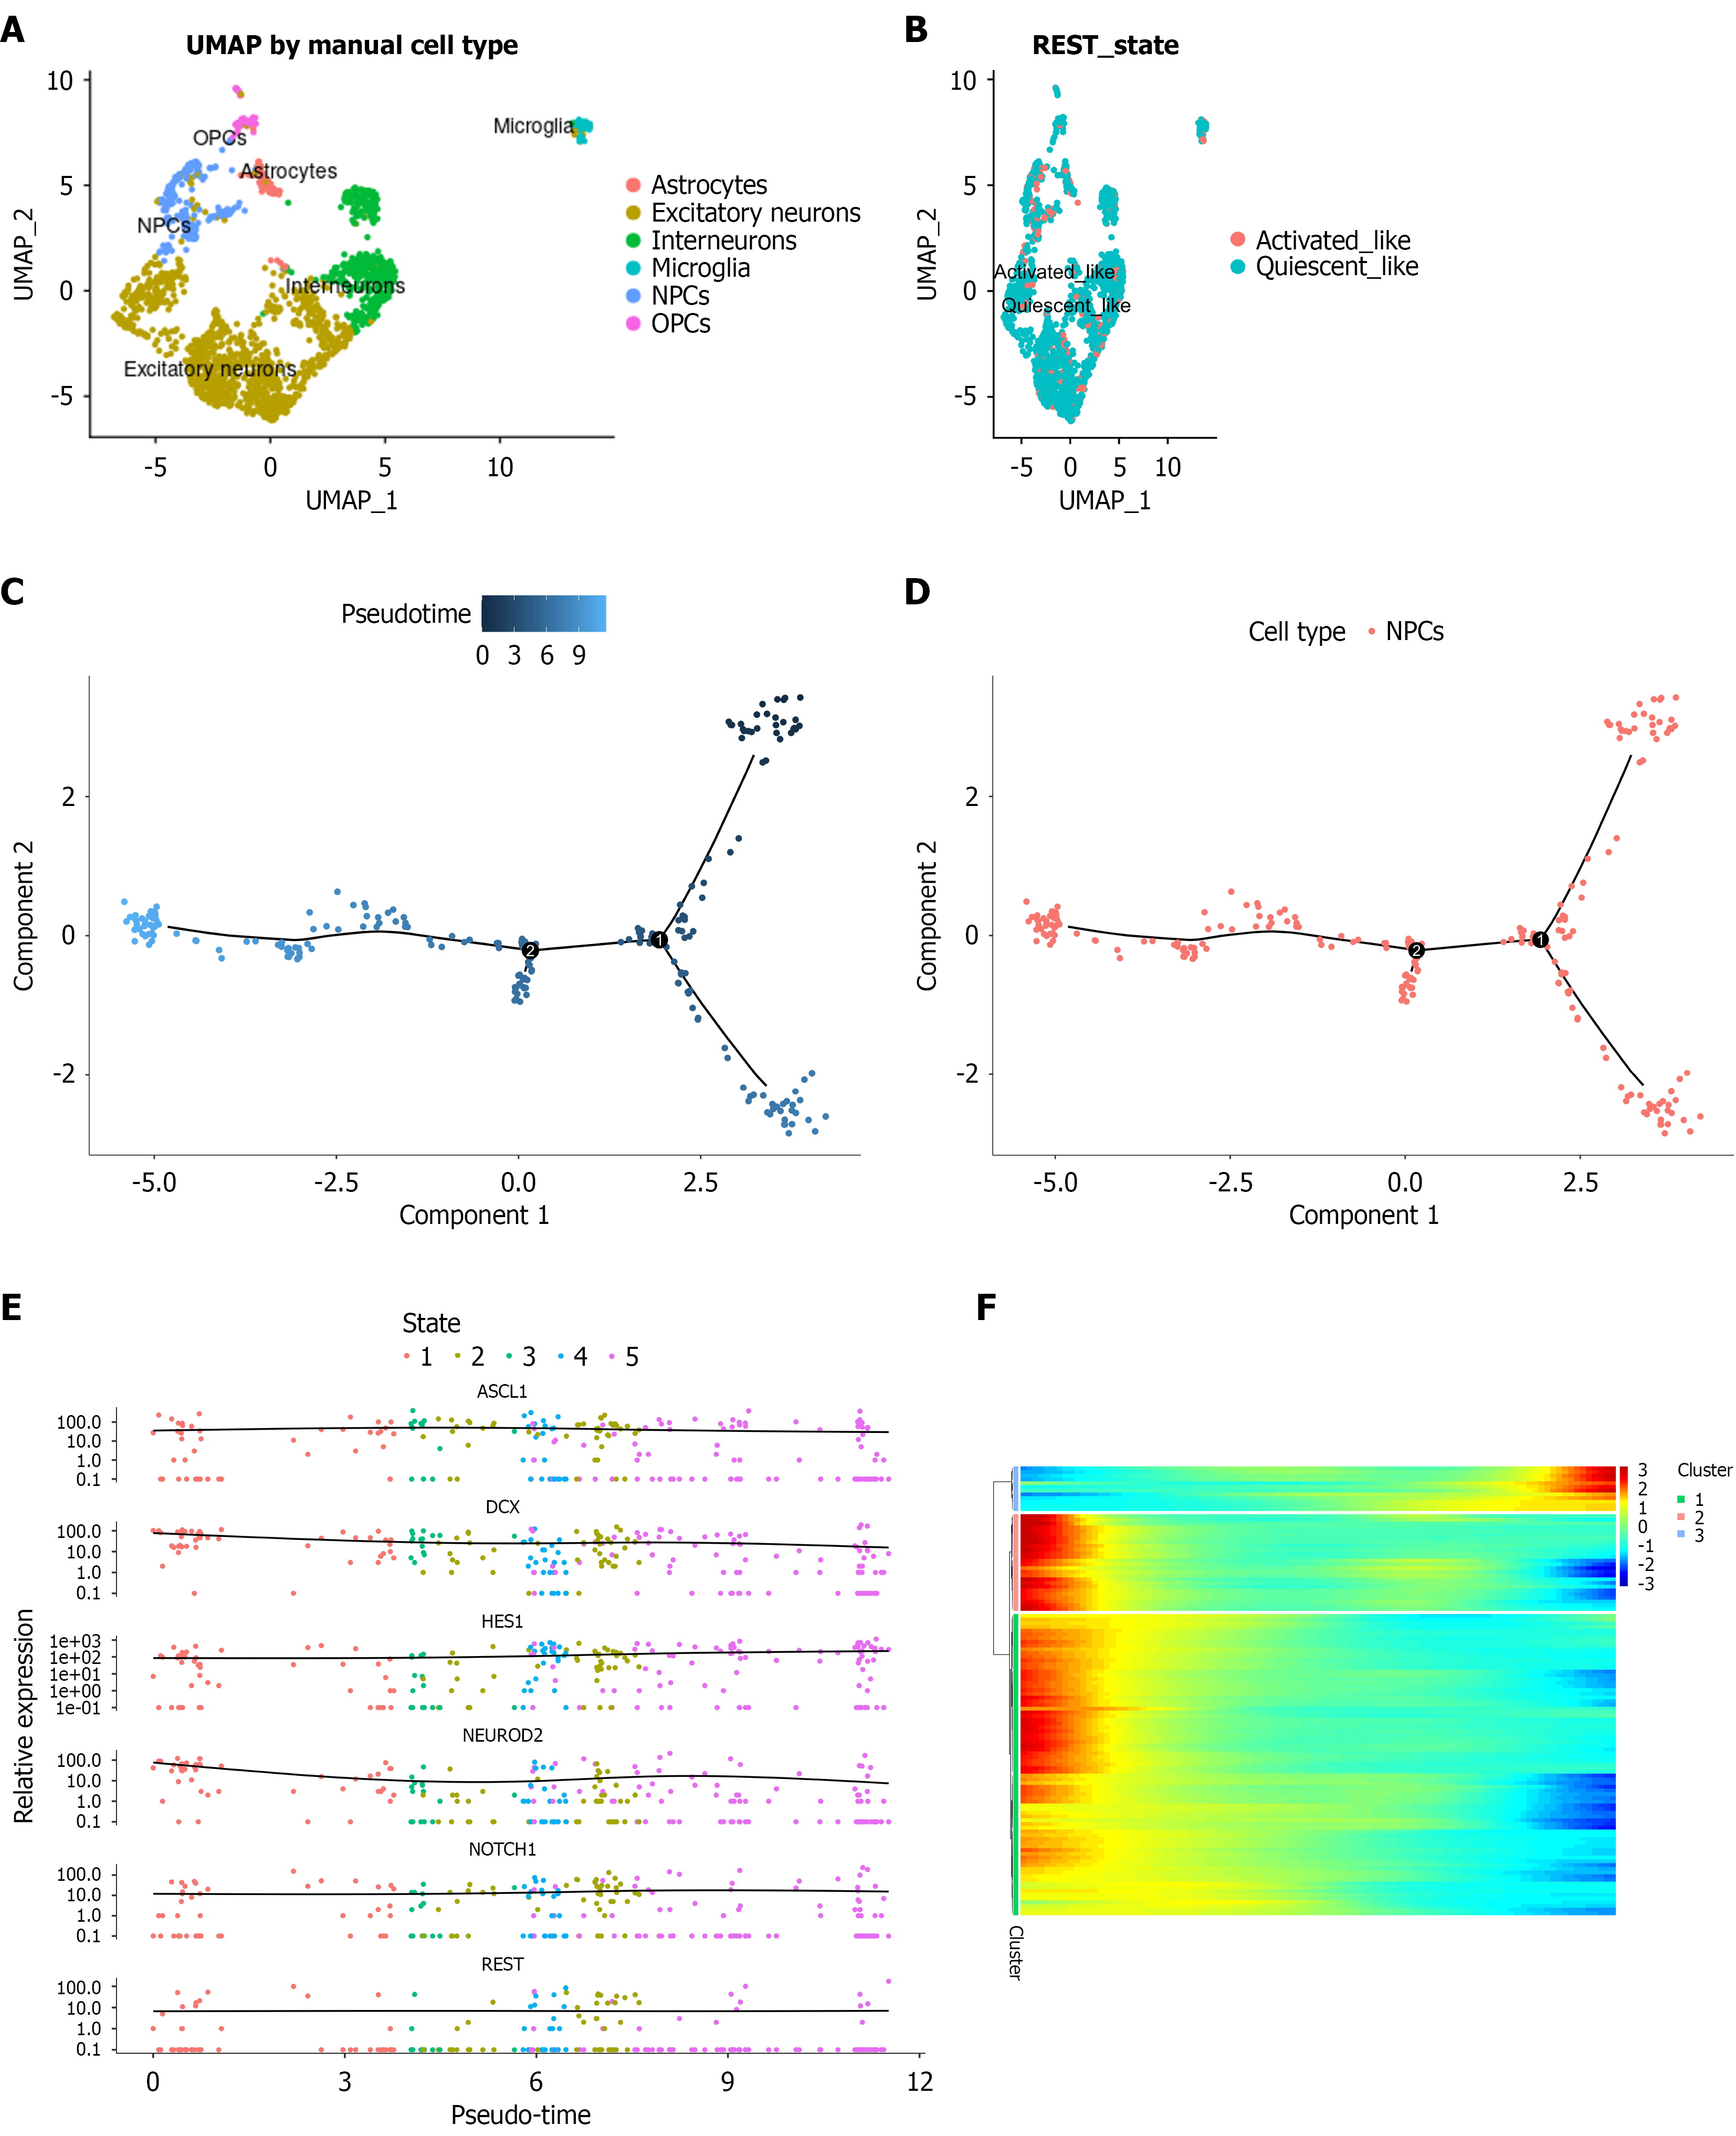
Figure 1 Inverse dynamic changes of RE1-silencing transcription factor and neurogenic locus notch homolog protein 1 reveal tran
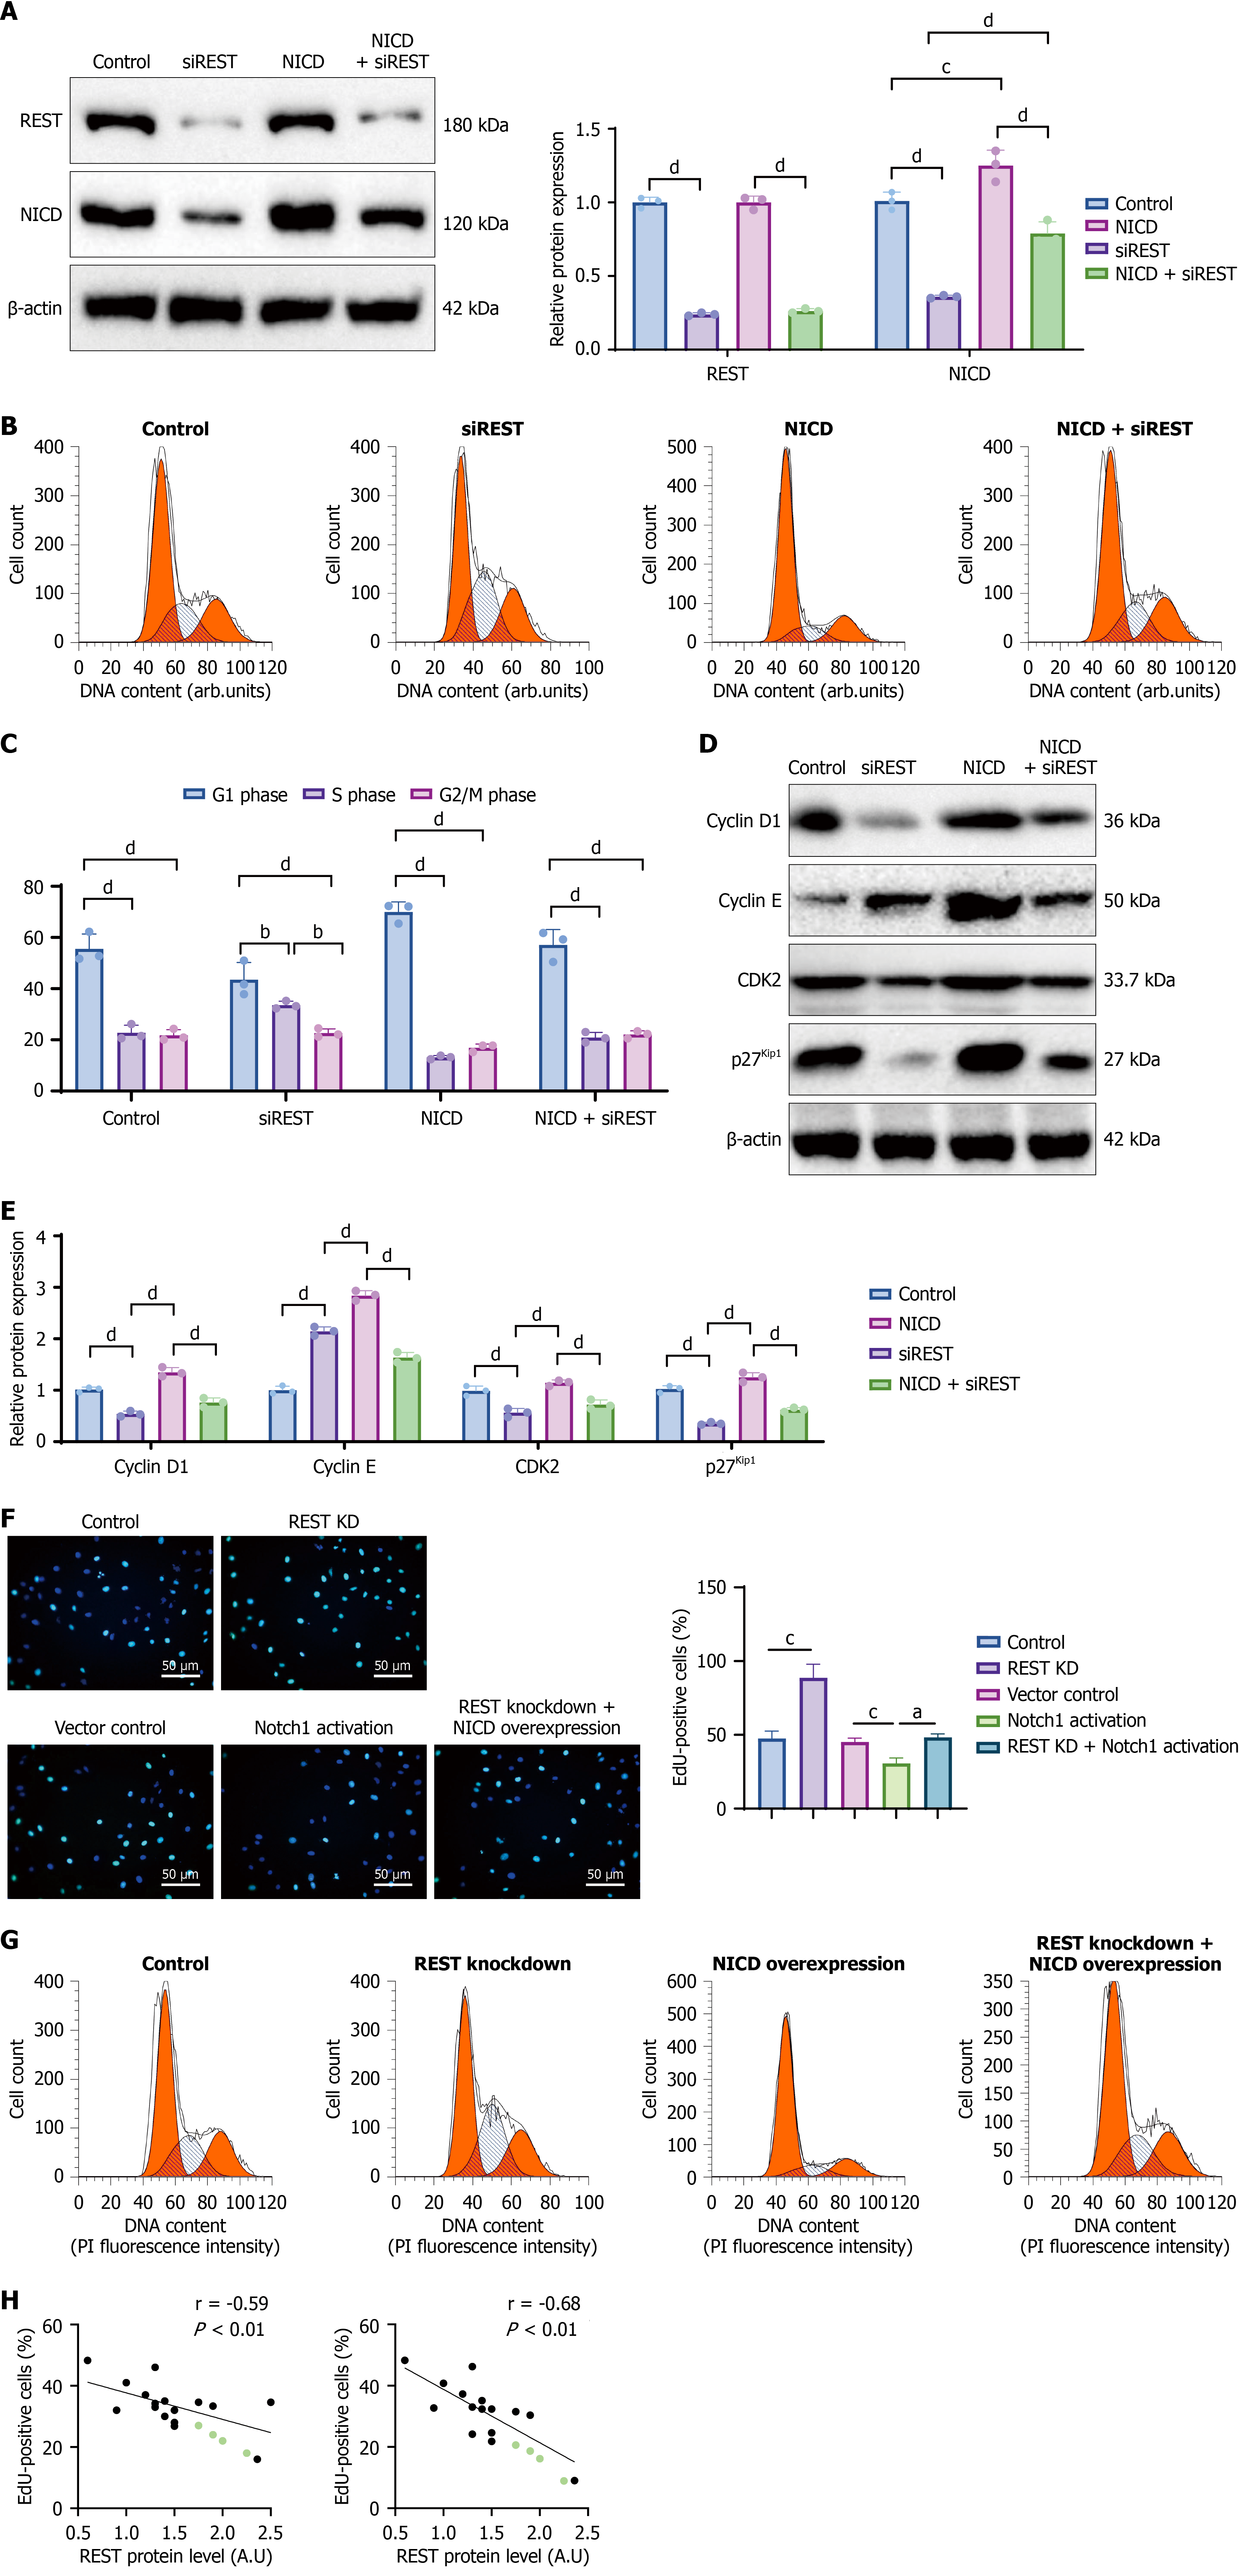
Figure 2 Antagonistic effects of RE1-silencing transcription factor and neurogenic locus notch homolog protein 1 on cell cycle regulation in neural stem cells.
A: Western blot analysis was performed to detect the expression of RE1-silencing transcription factor and NICD in each group, with β-actin used as the internal control; B: Representative histograms from flow cytometry analysis showing cell cycle distribution across experimental groups; C: Quantitative analysis of the proportion of cells in G1, S, and G2/M phases; D: Western blot analysis of cyclin D1, cyclin E, CDK2, and p27Kip1 protein levels; β-actin served as the loading control; E: QPCR analysis of CDC6 and MCM2 mRNA expression levels (normalized to GAPDH); F: Representative EdU staining images across treatment groups. EdU-positive cells indicate proliferating cells, and nuclei were counterstained with DAPI; G: Flow cytometry analysis of cell cycle distribution based on propidium iodide staining; H: Scatter plot of Pearson correlation between RE1-silencing transcription factor/neurogenic locus notch homolog protein 1 protein levels and the proportion of EdU-positive cells. Data are presented as mean ± SD from three independent biological replicates. Statistical analyses were performed using one-way ANOVA followed by Tukey’s post hoc test or two-tailed Student’s t-test where appropriate. aP < 0.05, bP < 0.01, cP < 0.001, dP < 0.0001. REST: RE1-silencing transcription factor.
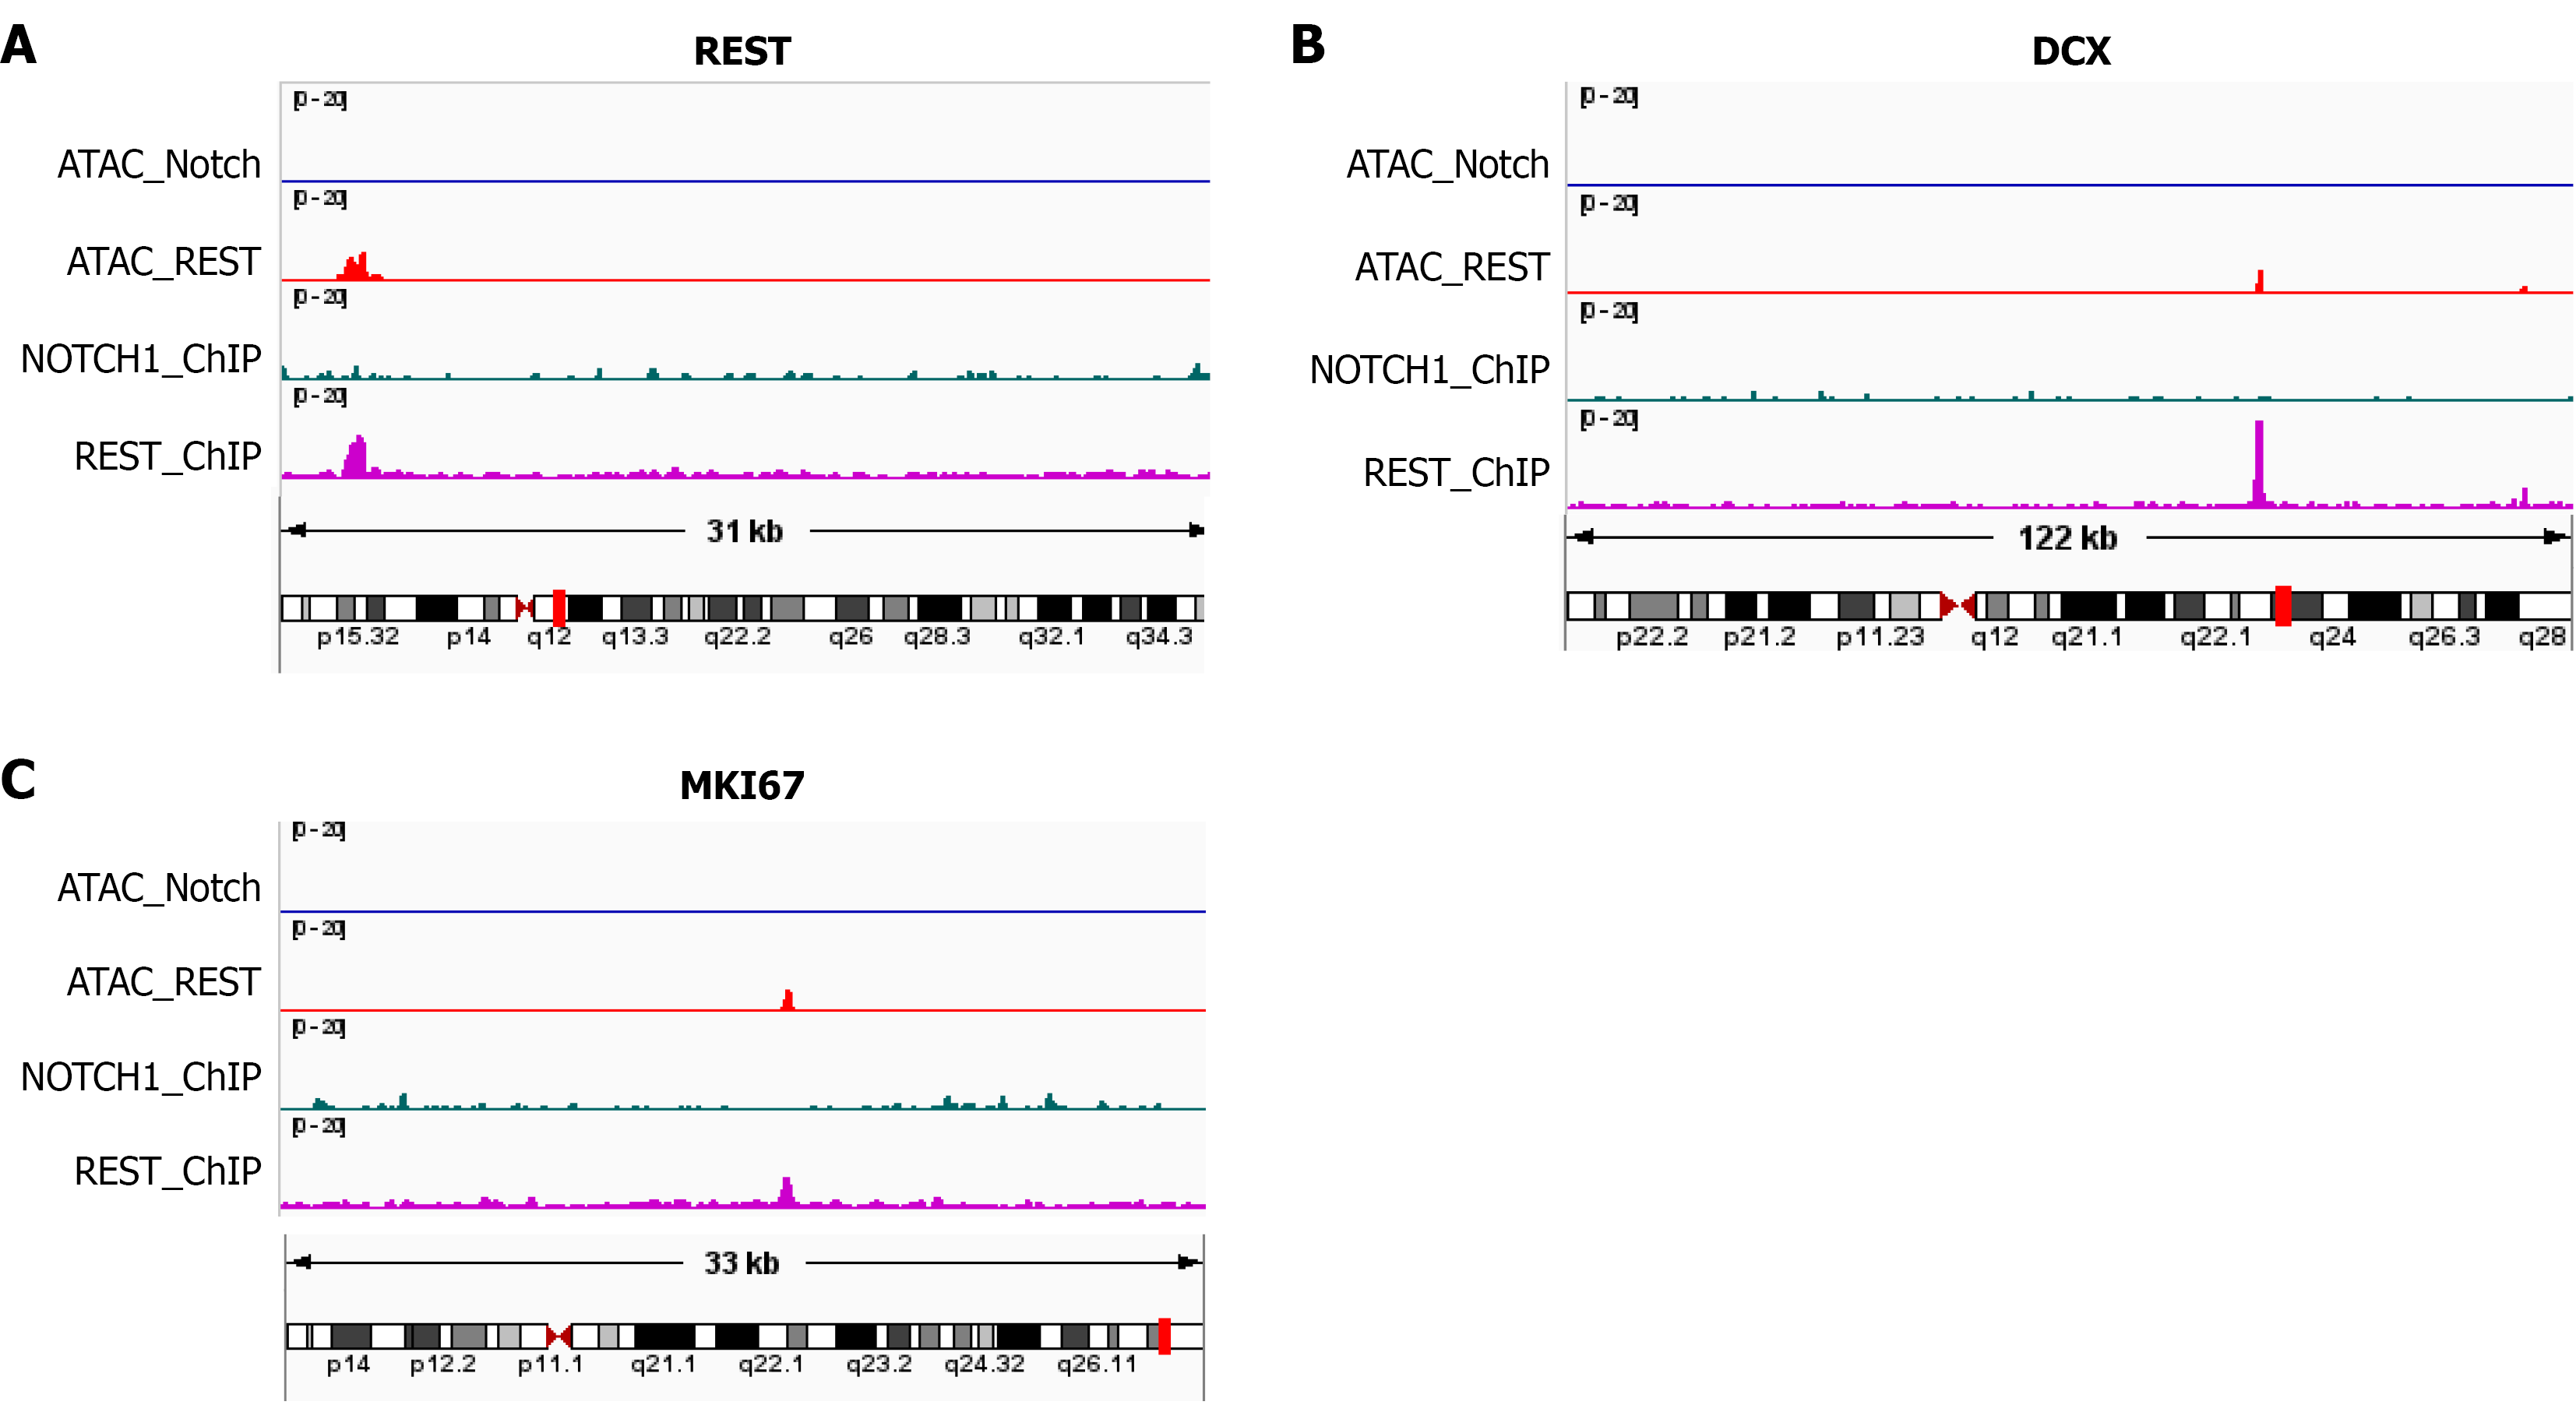
Figure 3 Chromatin accessibility and binding profiles of RE1-silencing transcription factor and neurogenic locus notch homolog protein 1 at representative target gene loci.
A-C: The panels respectively display assay for transposase-accessible chromatin using sequencing (ATAC-seq) and chromatin immunoprecipitation sequencing (ChIP-seq) signal distributions at the genomic loci of RE1-silencing transcription factor (REST), DCX, and MKI67. ATAC-seq data were obtained from human neural stem cells under conditions of high REST expression and neurogenic locus notch homolog protein 1 activation. ChIP-seq data include binding signals for REST and neurogenic locus notch homolog protein 1. Signal intensities are presented as normalized read counts (p-2q range). Genomic annotations and scale bars are based on the hg38 reference genome. The horizontal axis represents the genomic coordinate range, with chromosome position and interval length indicated; the scale is shown in kb, and arrows denote the direction of gene transcription. It should be noted that the ATAC-seq and ChIP-seq data for each condition were derived from a single sample (n = 1). The figure therefore presents representative signals from selected genomic regions for exploratory mechanistic analysis. ATAC-seq and ChIP-seq tracks are representative genome-browser views from one biologically independent sample per condition. These data were used for exploratory visualization only, and no statistical differential accessibility or binding analysis was performed. Signal intensity was normalized as reads per genomic content. REST: RE1-silencing transcription factor; ATAC-seq: Assay for transposase-accessible chromatin using sequencing; ChIP-seq: Chromatin immunoprecipitation sequencing.
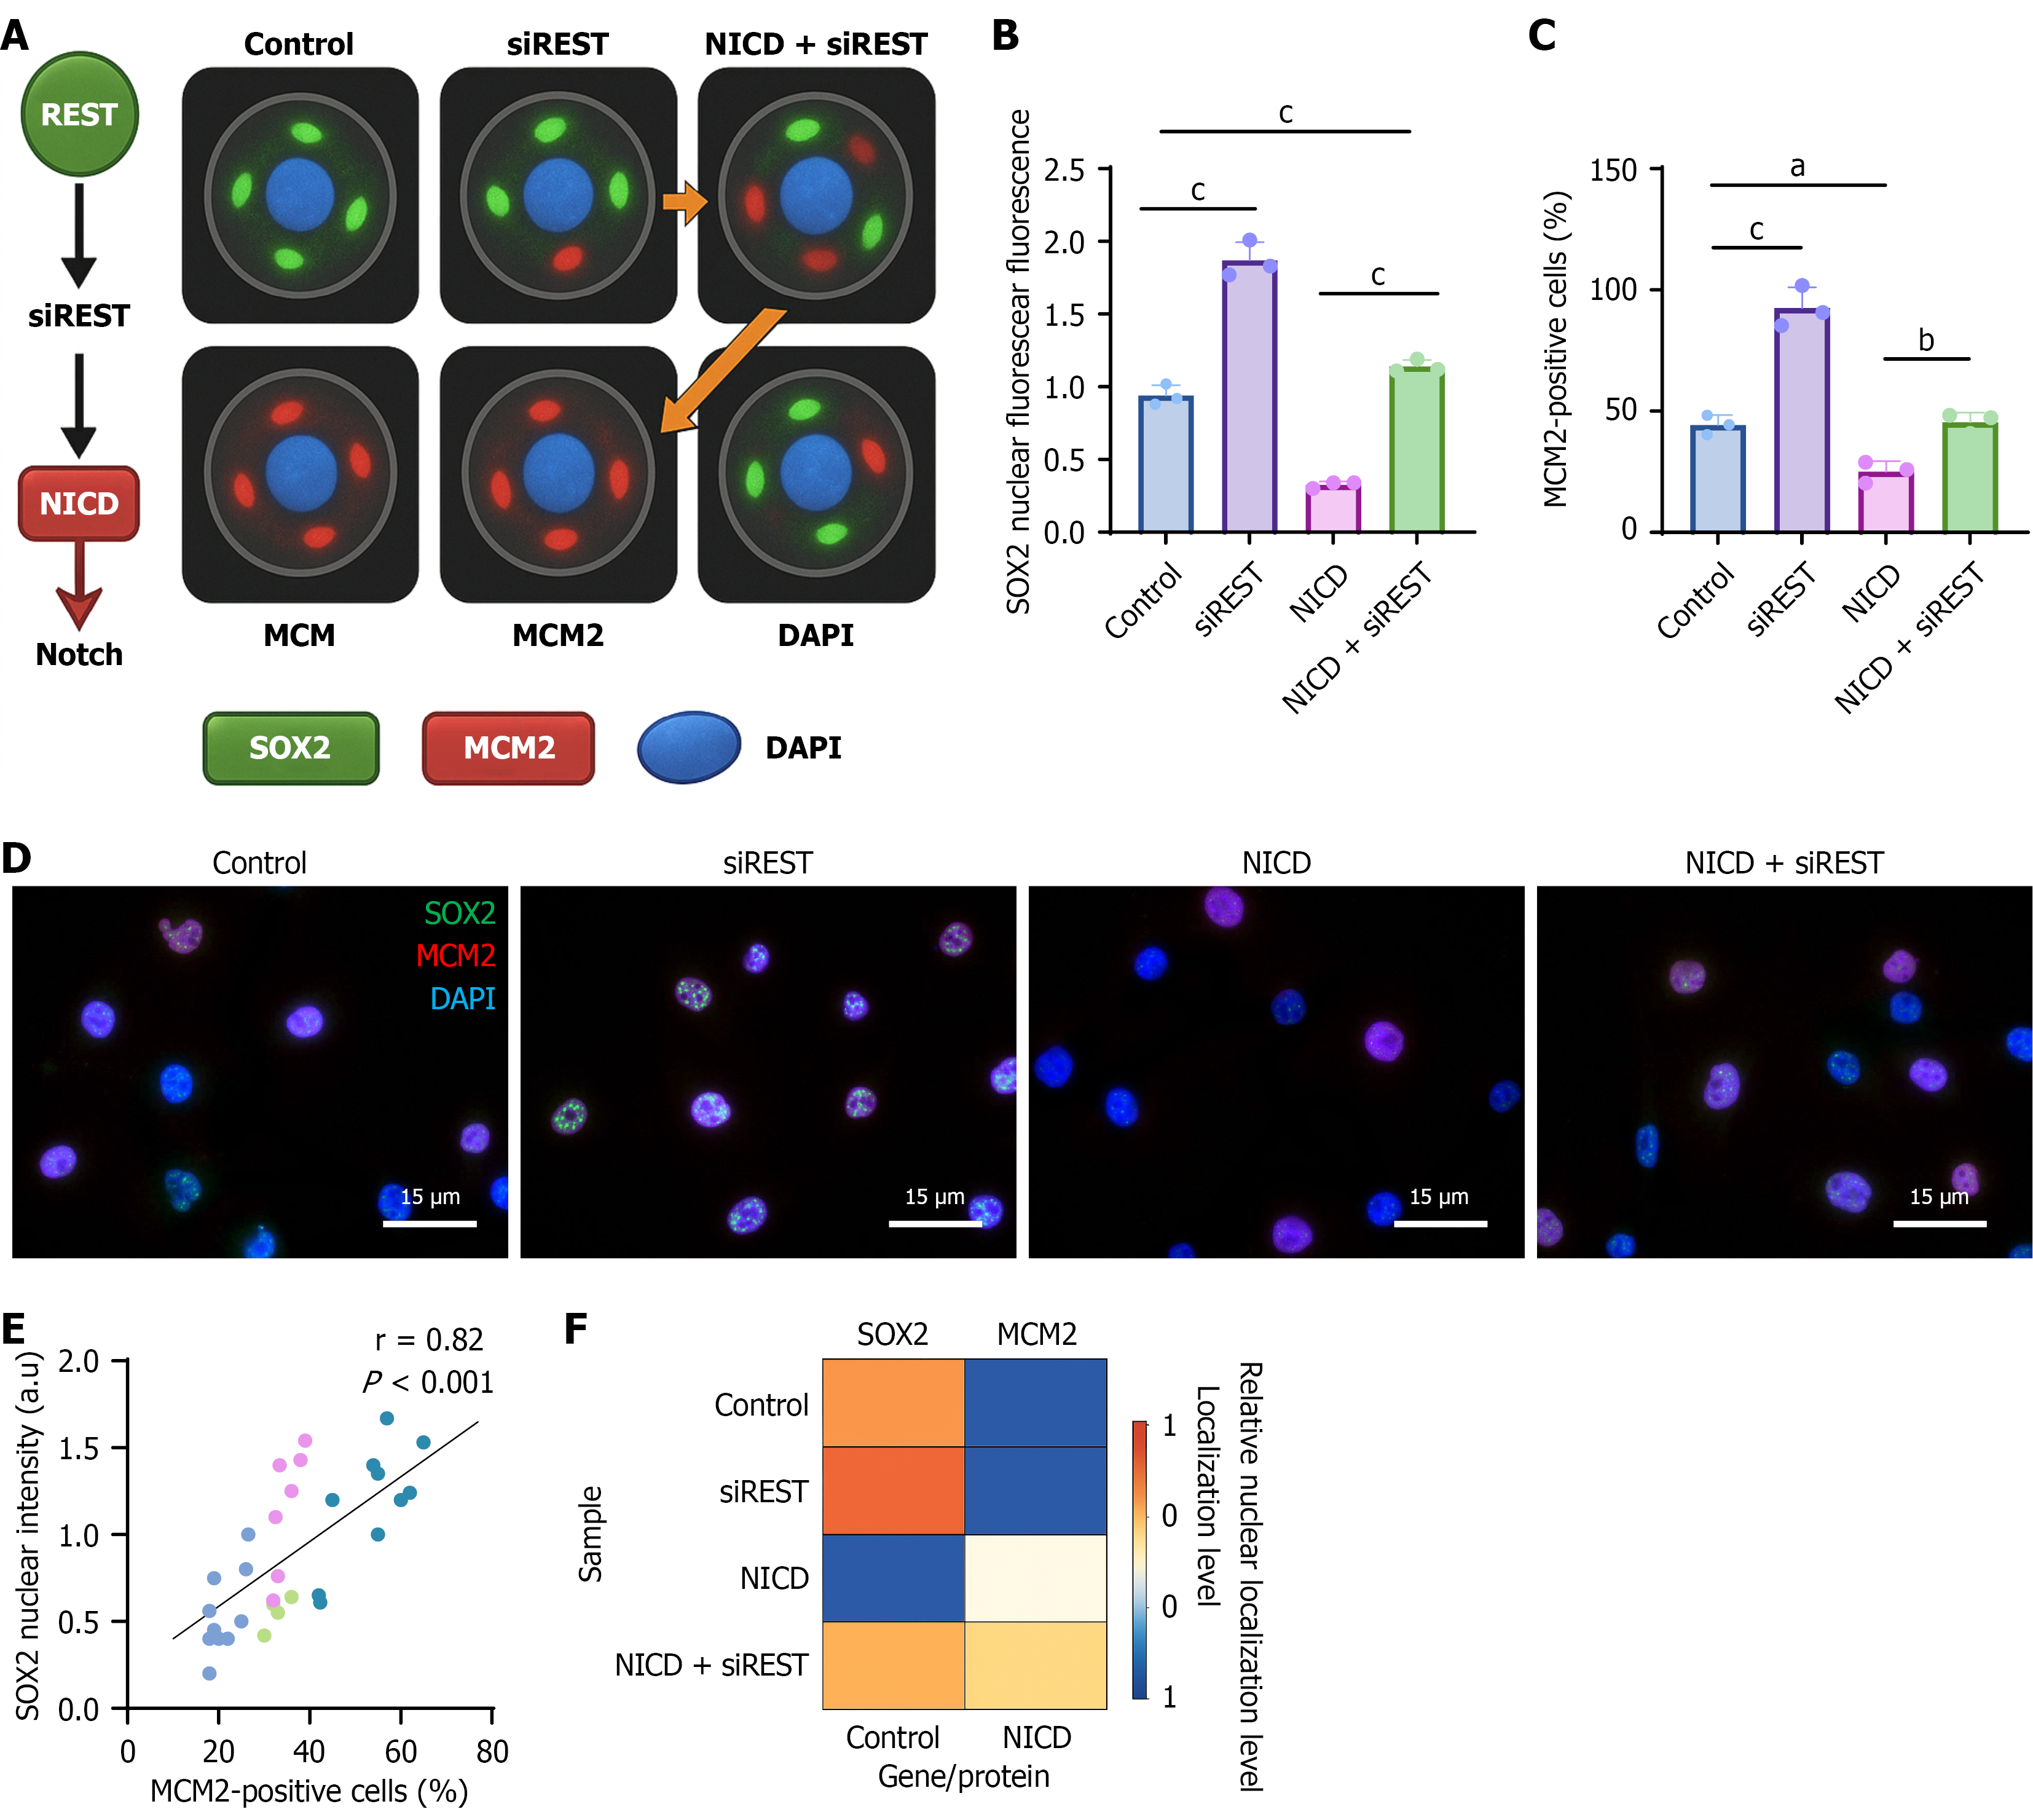
Figure 4 Nuclear localization changes of SOX2 and MCM2 under RE1-silencing transcription factor and Notch signaling regulation.
A: Schematic diagram illustrating the regulatory mechanism; B: Quantification of nuclear fluorescence intensity of SOX2 across groups, presented as bar plots; statistical significance was determined by two-tailed t-test; C: Bar graph showing the percentage of MCM2-positive cells in each group; D: Representative high-magnification images demonstrating enhanced nuclear accumulation of SOX2 in the RE1-silencing transcription factor interference group (white arrows); E: Pearson correlation scatter plot with fitted curve illustrating the relationship between SOX2 nuclear intensity and the proportion of MCM2-positive cells; F: Heatmap of SOX2 and MCM2 nuclear localization levels. Colors represent relative expression levels; rows indicate samples, and columns denote gene/protein signal channels. aP < 0.05, bP < 0.01, cP < 0.001. REST: RE1-silencing transcription factor.
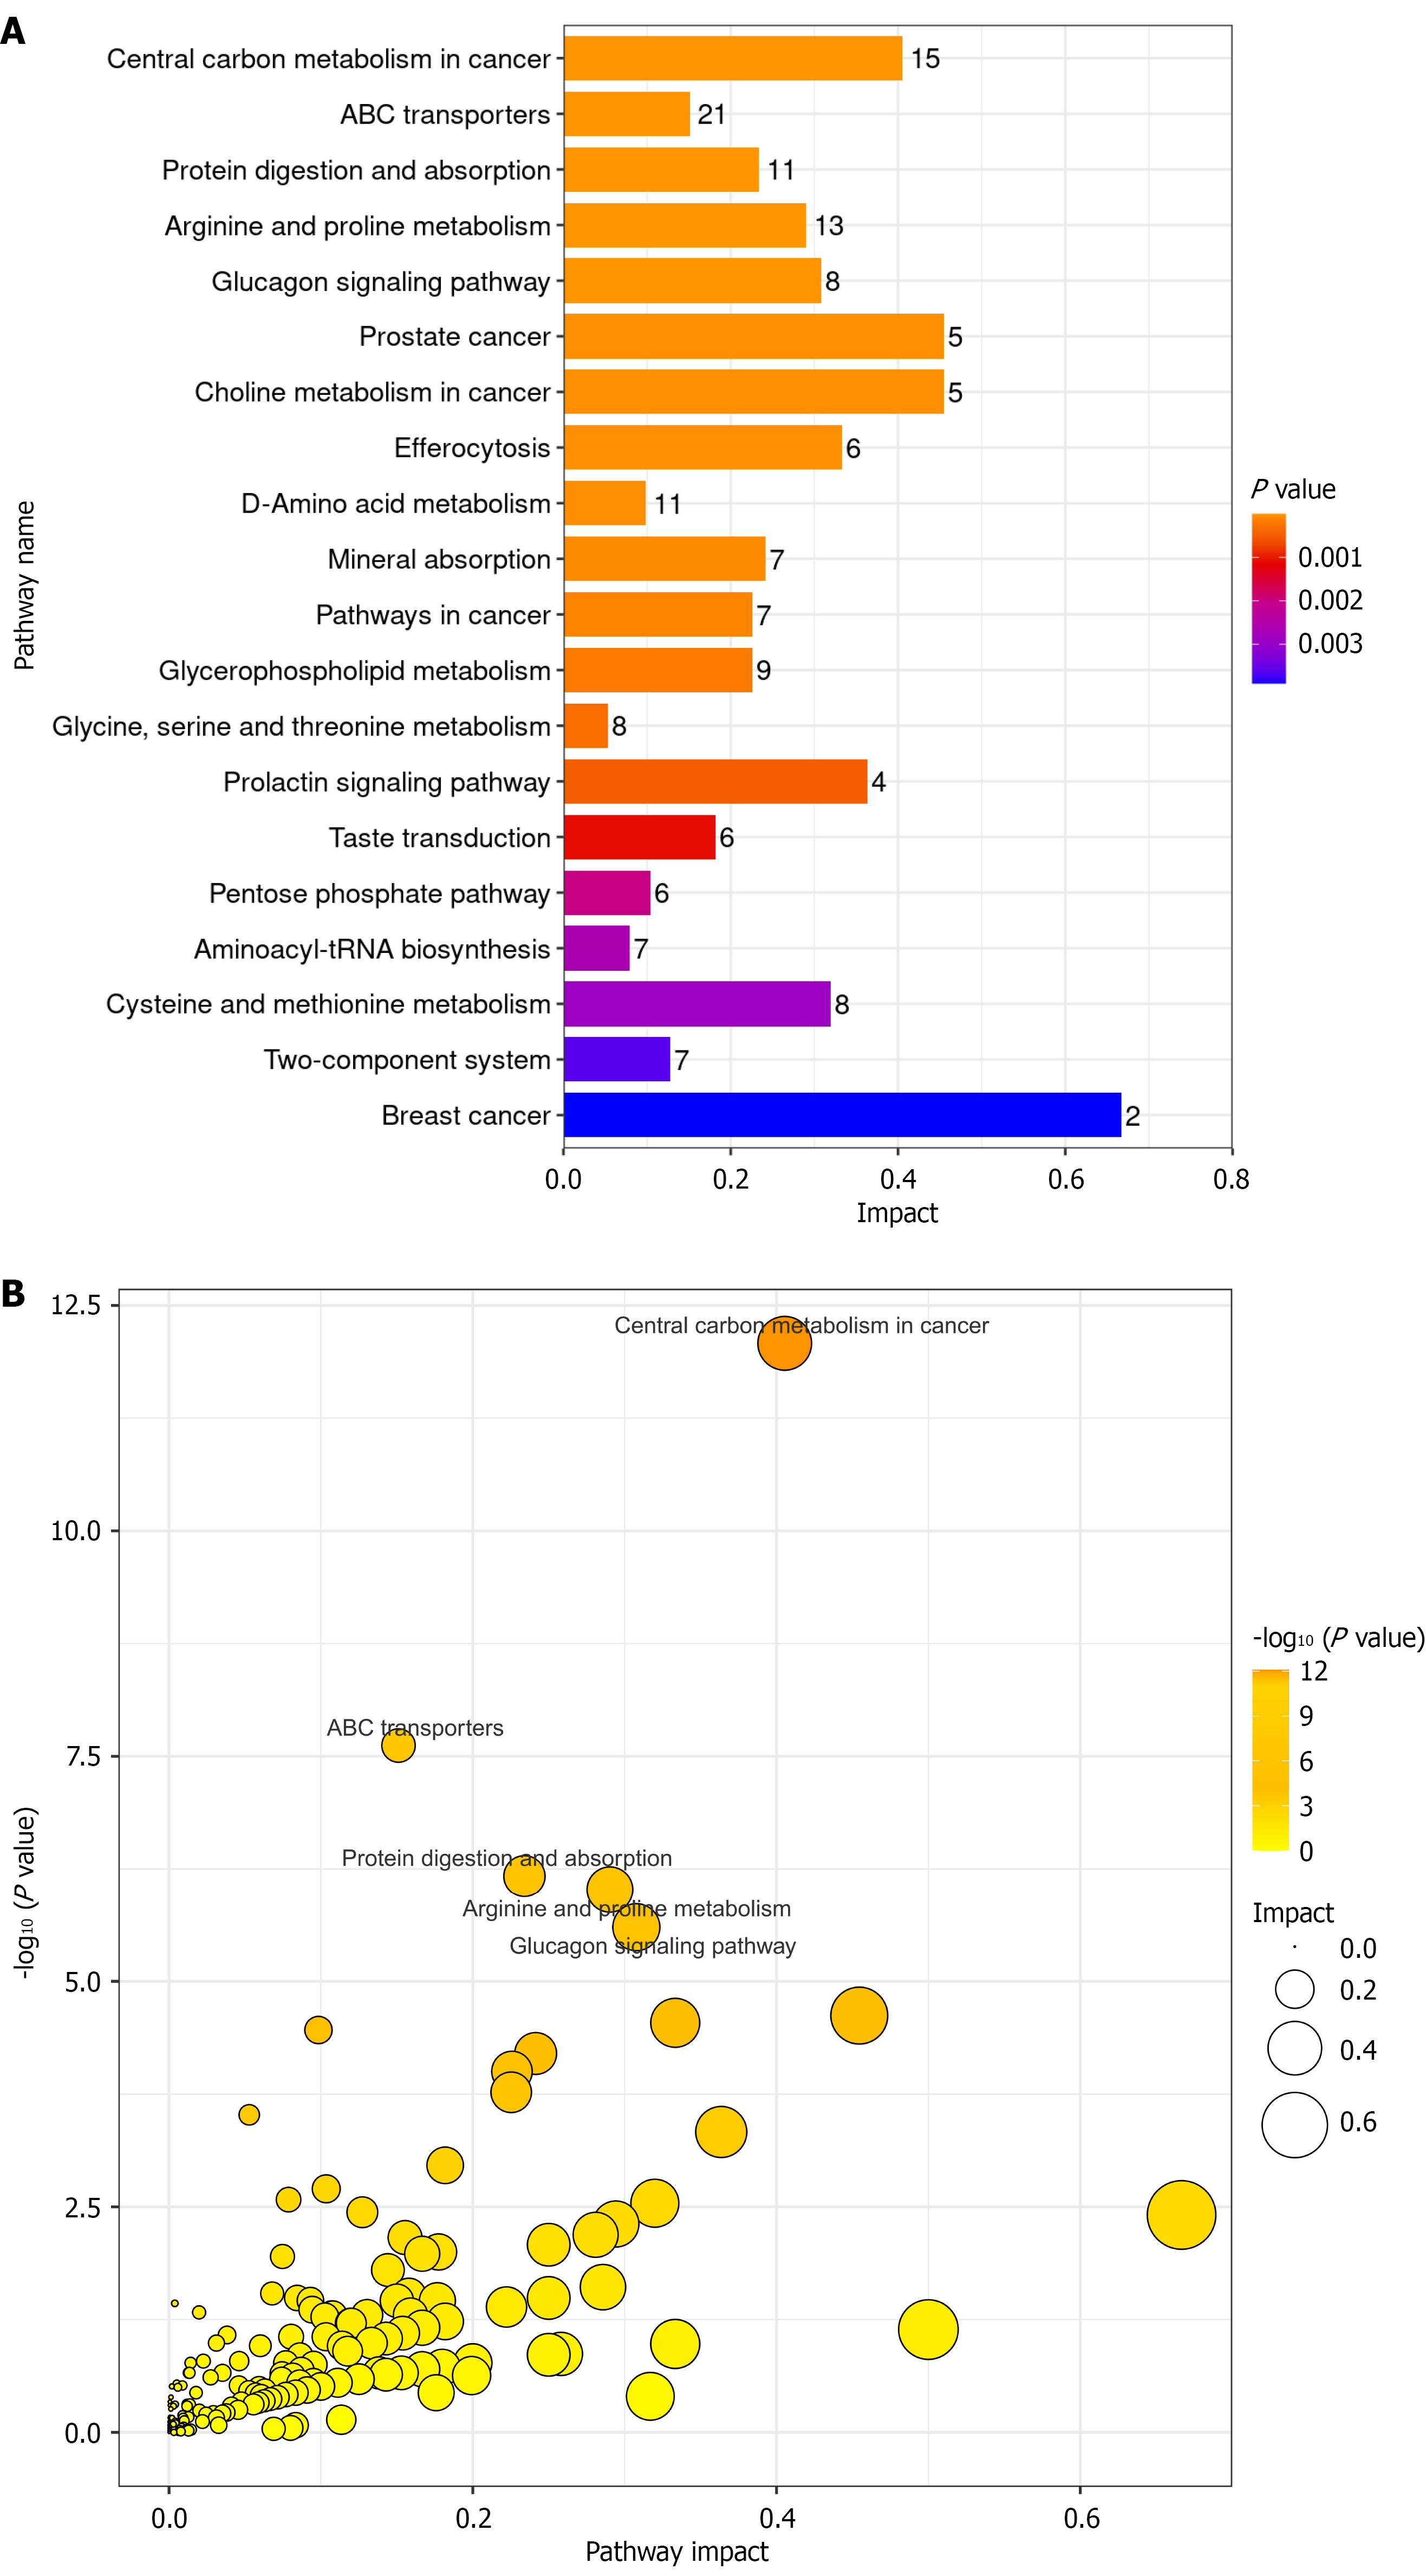
Figure 5 Enrichment and distribution analysis of metabolic pathways affected by RE1-silencing transcription factor inhibition in human neural stem cells.
A: Bar plot of enriched differential metabolic pathways between RE1-silencing transcription factor inhibition and control groups. Differential metabolites were identified via liquid chromatography tandem mass spectrometry and analyzed for Kyoto Encyclopedia of Genes and Genomes pathway enrichment using the BioDeep platform. Enrichment significance is expressed as -log10(P); B: Bubble plot displaying enriched differential pathways. Significance [-log10(P)] and impact values were calculated via topological analysis; bubble size corresponds to the number of differential metabolites involved in each pathway. Data were obtained from four independent biological replicates per group (n = 4 per group; total n = 8).
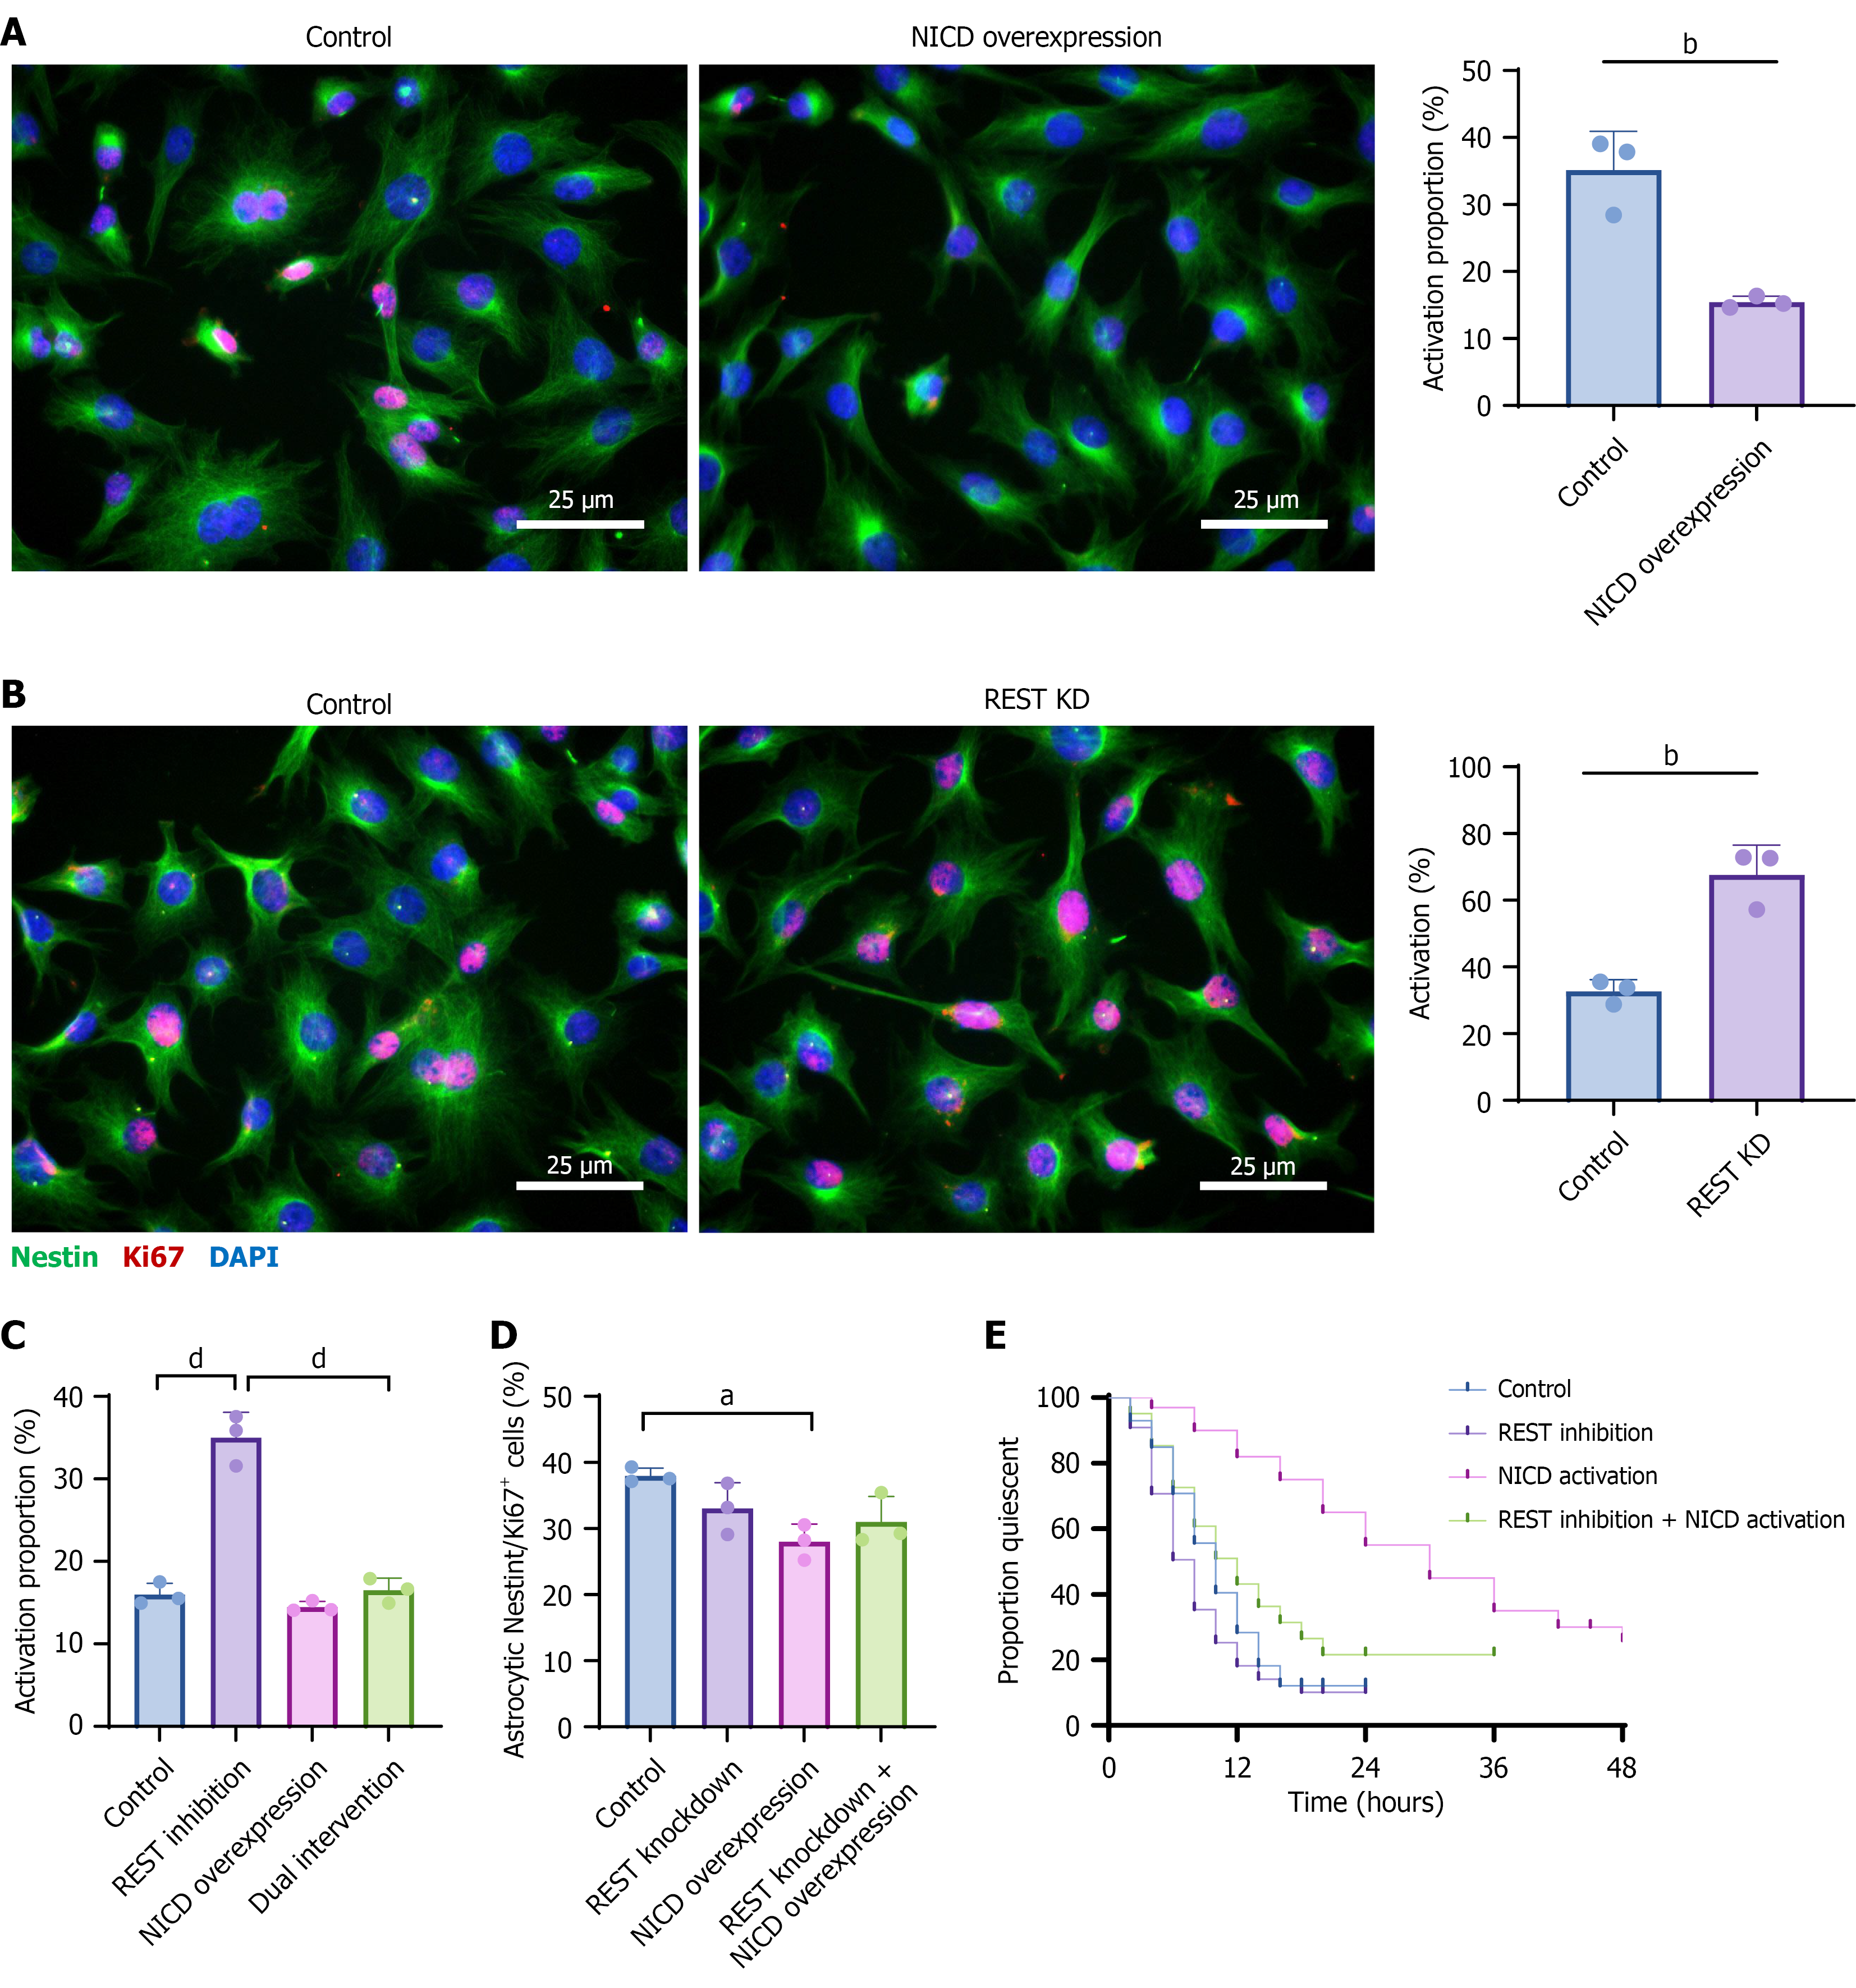
Figure 6 Multiphoton imaging reveals that RE1-silencing transcription factor inhibition accelerates the transition of neural stem cells from dormancy to activation.
A: Representative multiphoton images of Nestin+/Ki67+ cells in the NICD overexpression and control groups at 0 hour and 48 hours (Nestin: Green; Ki67: Red; DAPI: Blue), along with bar graphs showing the proportion of activated cells; B: Representative imaging and quantification of activation proportions in the RE1-silencing transcription factor (REST) inhibition and control groups; C: Comparison of activation rates across four treatment groups (vector control, REST inhibition, NICD activation, dual intervention), with statistical significance indicated; D: Time-course activation curves of neural stem cells based on 48 hours continuous imaging data, showing a marked increase within the first 24 hours in the REST inhibition group and a delayed activation in the NICD activation group; E: Kaplan-Meier-style analysis of neural stem cell activation latency, comparing the time distribution for transition from dormancy to activation across treatment groups. aP < 0.05, bP < 0.01, dP < 0.0001. REST: RE1-silencing transcription factor.
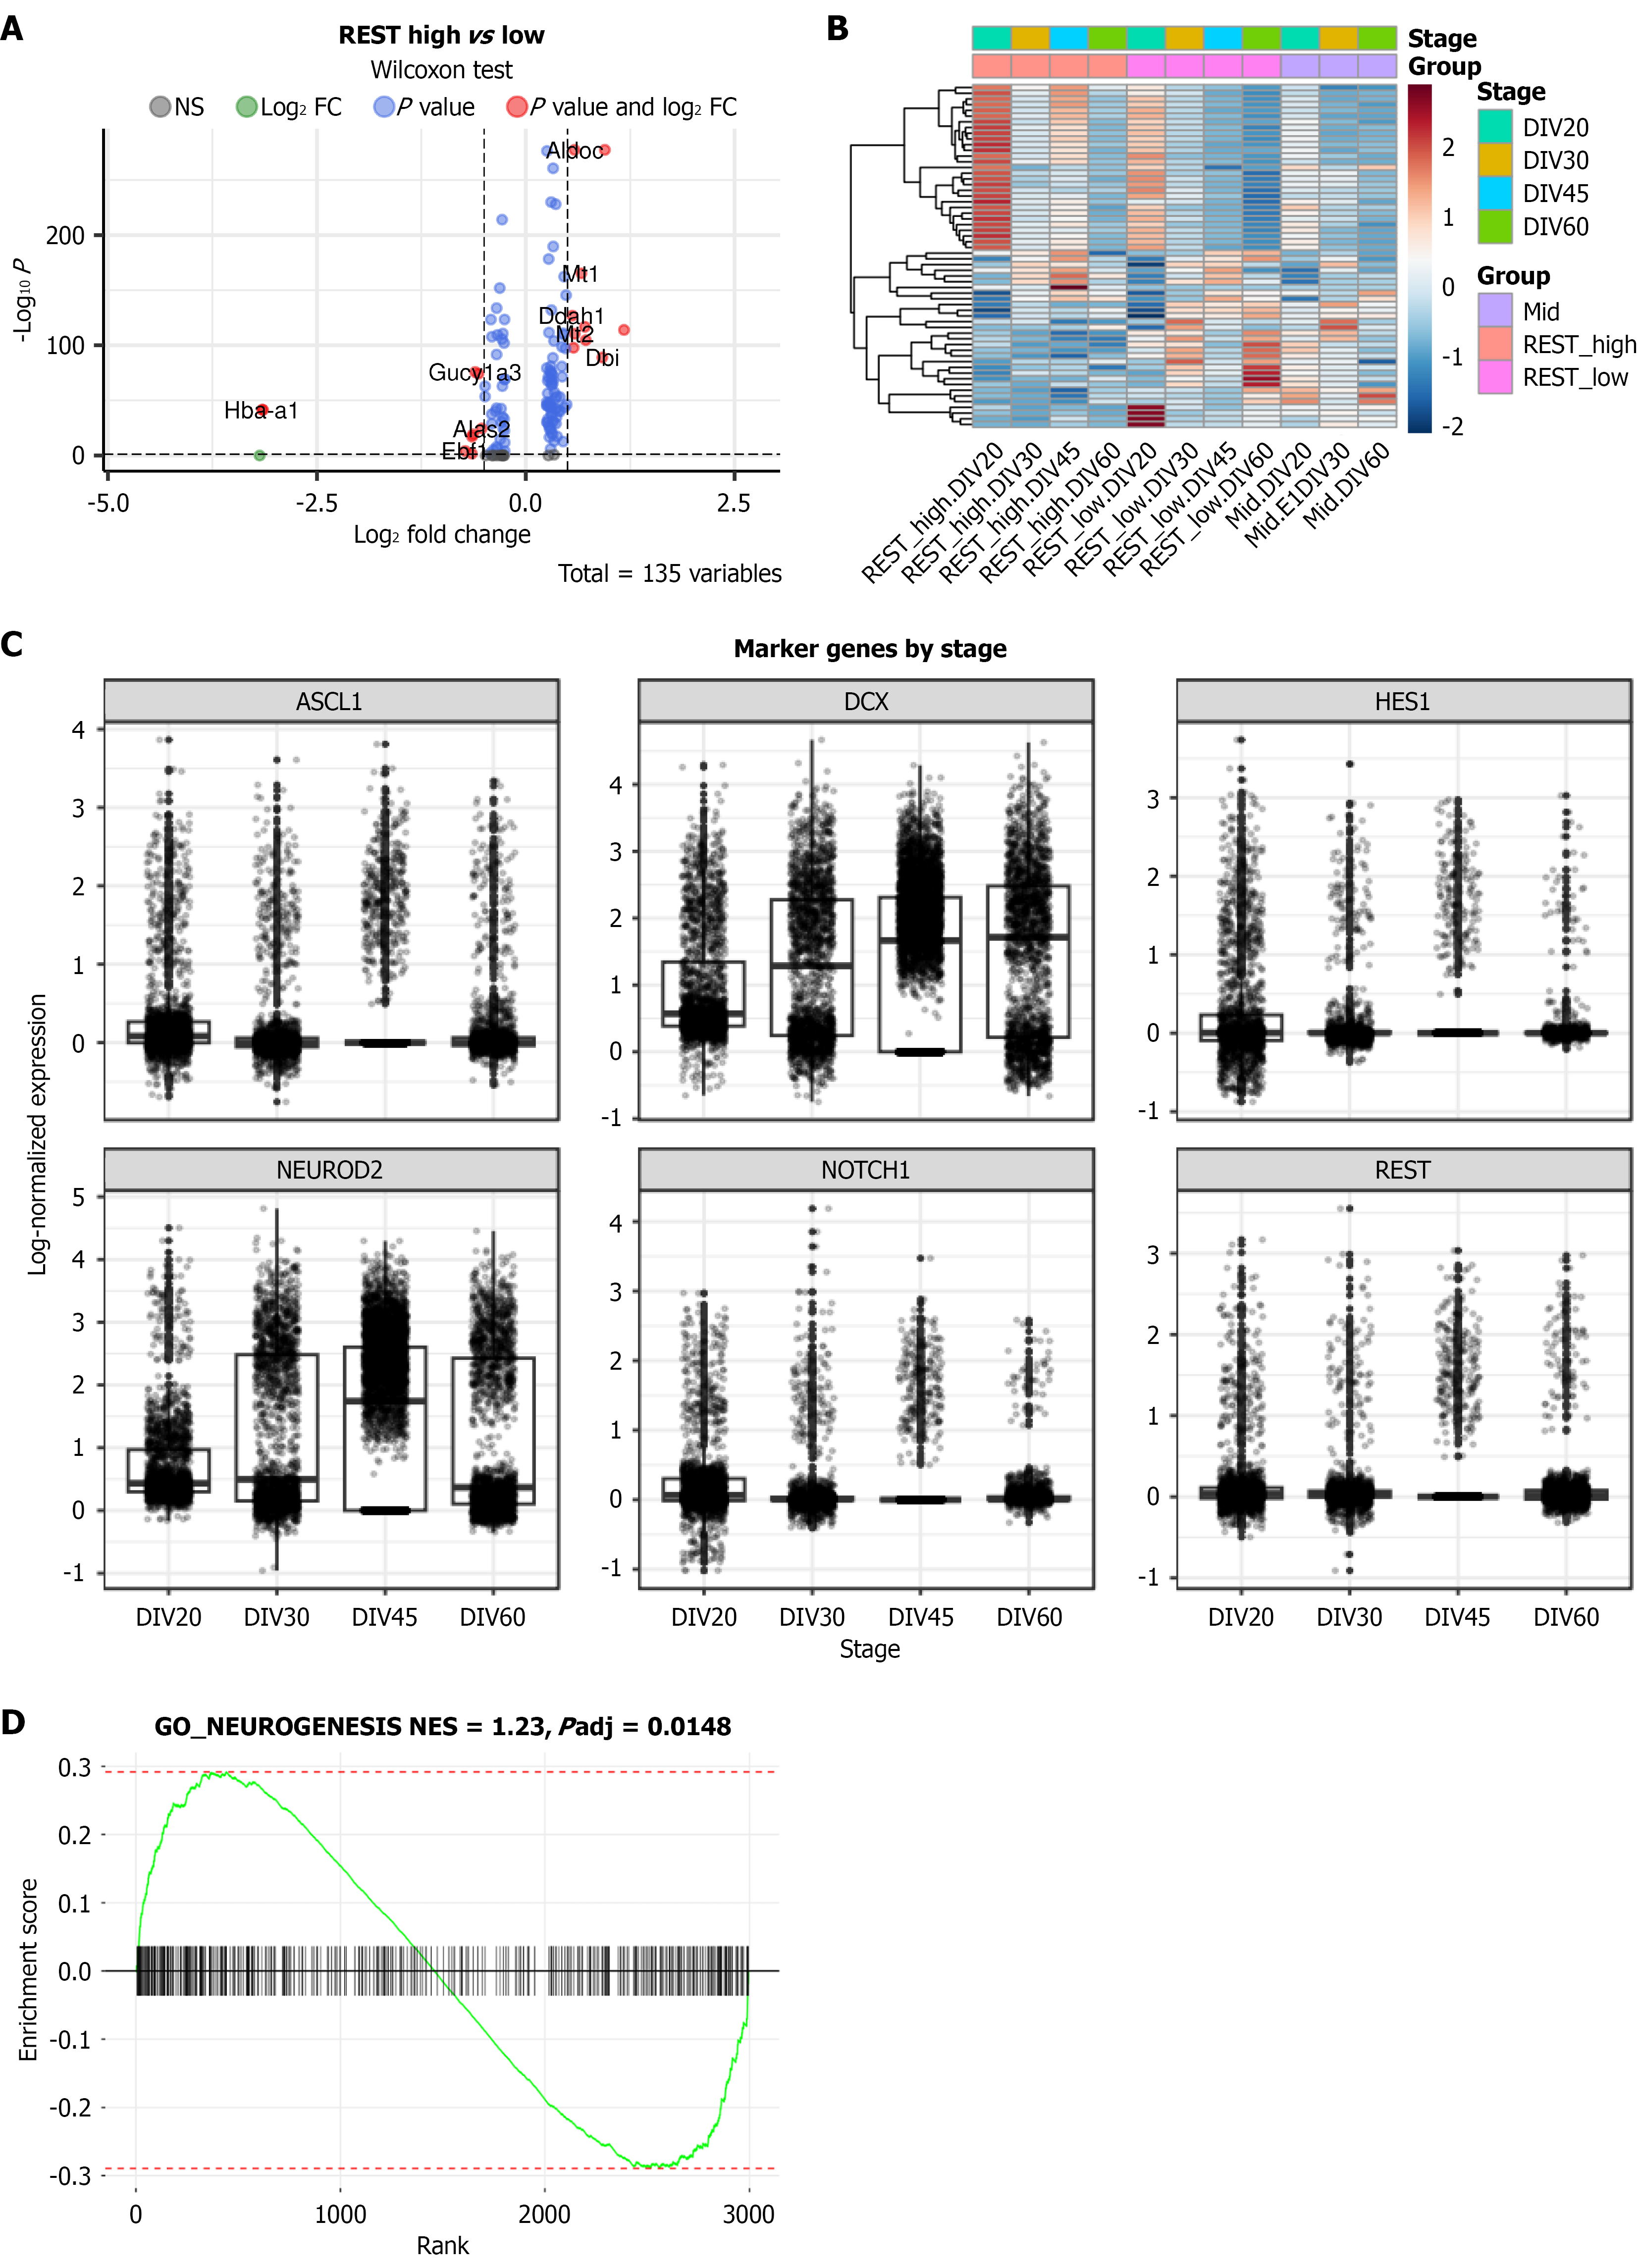
Figure 7 Single-cell RNA sequencing of organoids reveal RE1-silencing transcription factor activity variations and their association with neurogenesis.
A: Volcano plot illustrating the differentially expressed genes between RE1-silencing transcription factor (REST) high-expression and low-expression groups; B: Heatmap of differentially expressed genes between REST high- and low-expression cells. Data were integrated and normalized across developmental stages (DIV20, DIV30, DIV45, DIV60), and visualized using hierarchical clustering; C: Expression profiles of key developmental marker genes (ASCL1, DCX, HES1, NEUROD2, neurogenic locus notch homolog protein 1, REST) across different developmental stages; D: Gene set enrichment analysis enrichment curve for the neurogenesis-related gene set (GO_NEUROGENESIS), calculated based on ranked differential gene expression, showing significant enrichment of neurogenesis pathways in REST low-expression cells. REST: RE1-silencing transcription factor.
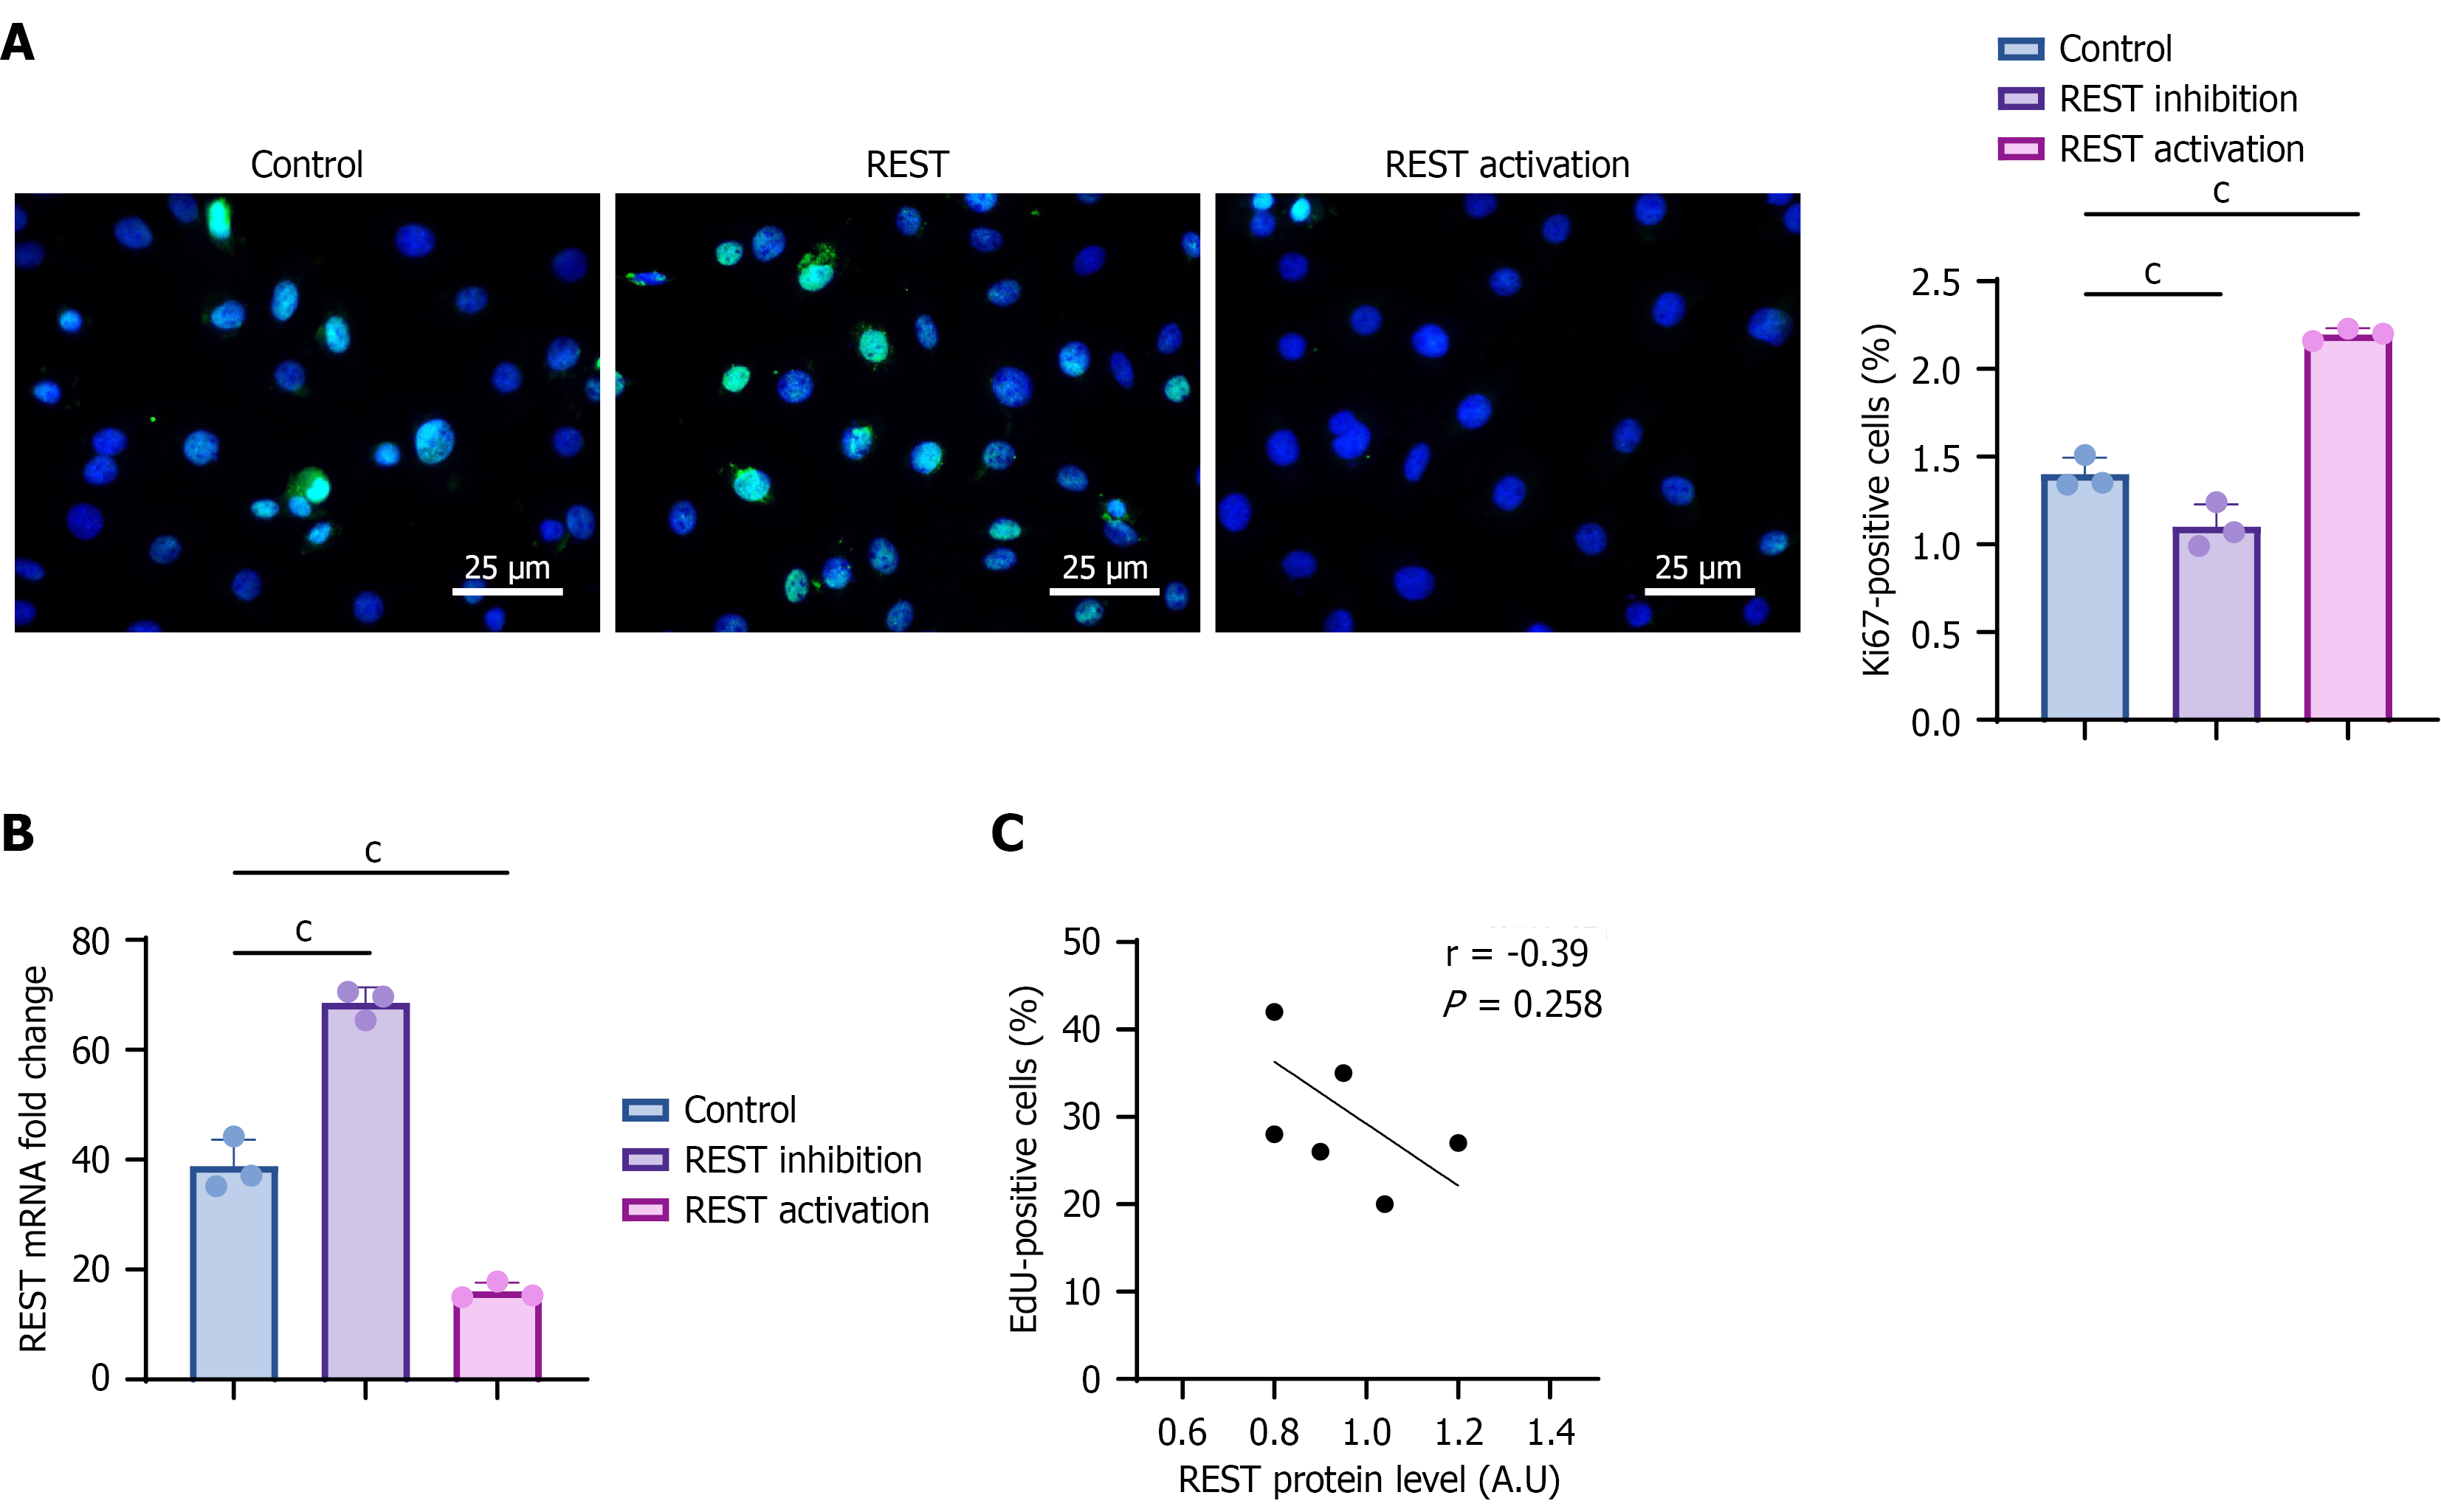
Figure 8 The organoid model reveals time-dependent regulation of cell states by the Notch-RE1-silencing transcription factor axis in a three-dimensional microenvironment.
A: Immunofluorescence images and quantitative analysis of Ki67+ cell proportions following RE1-silencing transcription factor (REST) inhibition and activation treatments. Ki67 is shown in green, DAPI in blue. Scale bar = 50 μm; B: Effects of REST inhibition and REST activation on REST mRNA expression levels (n = 3); C: Correlation analysis between REST expression and Ki67+ cell proportions at different time points under Jagged1 treatment, showing a non-significant negative trend (r = -0.39, P = 0.258). cP < 0.001. REST: RE1-silencing transcription factor.
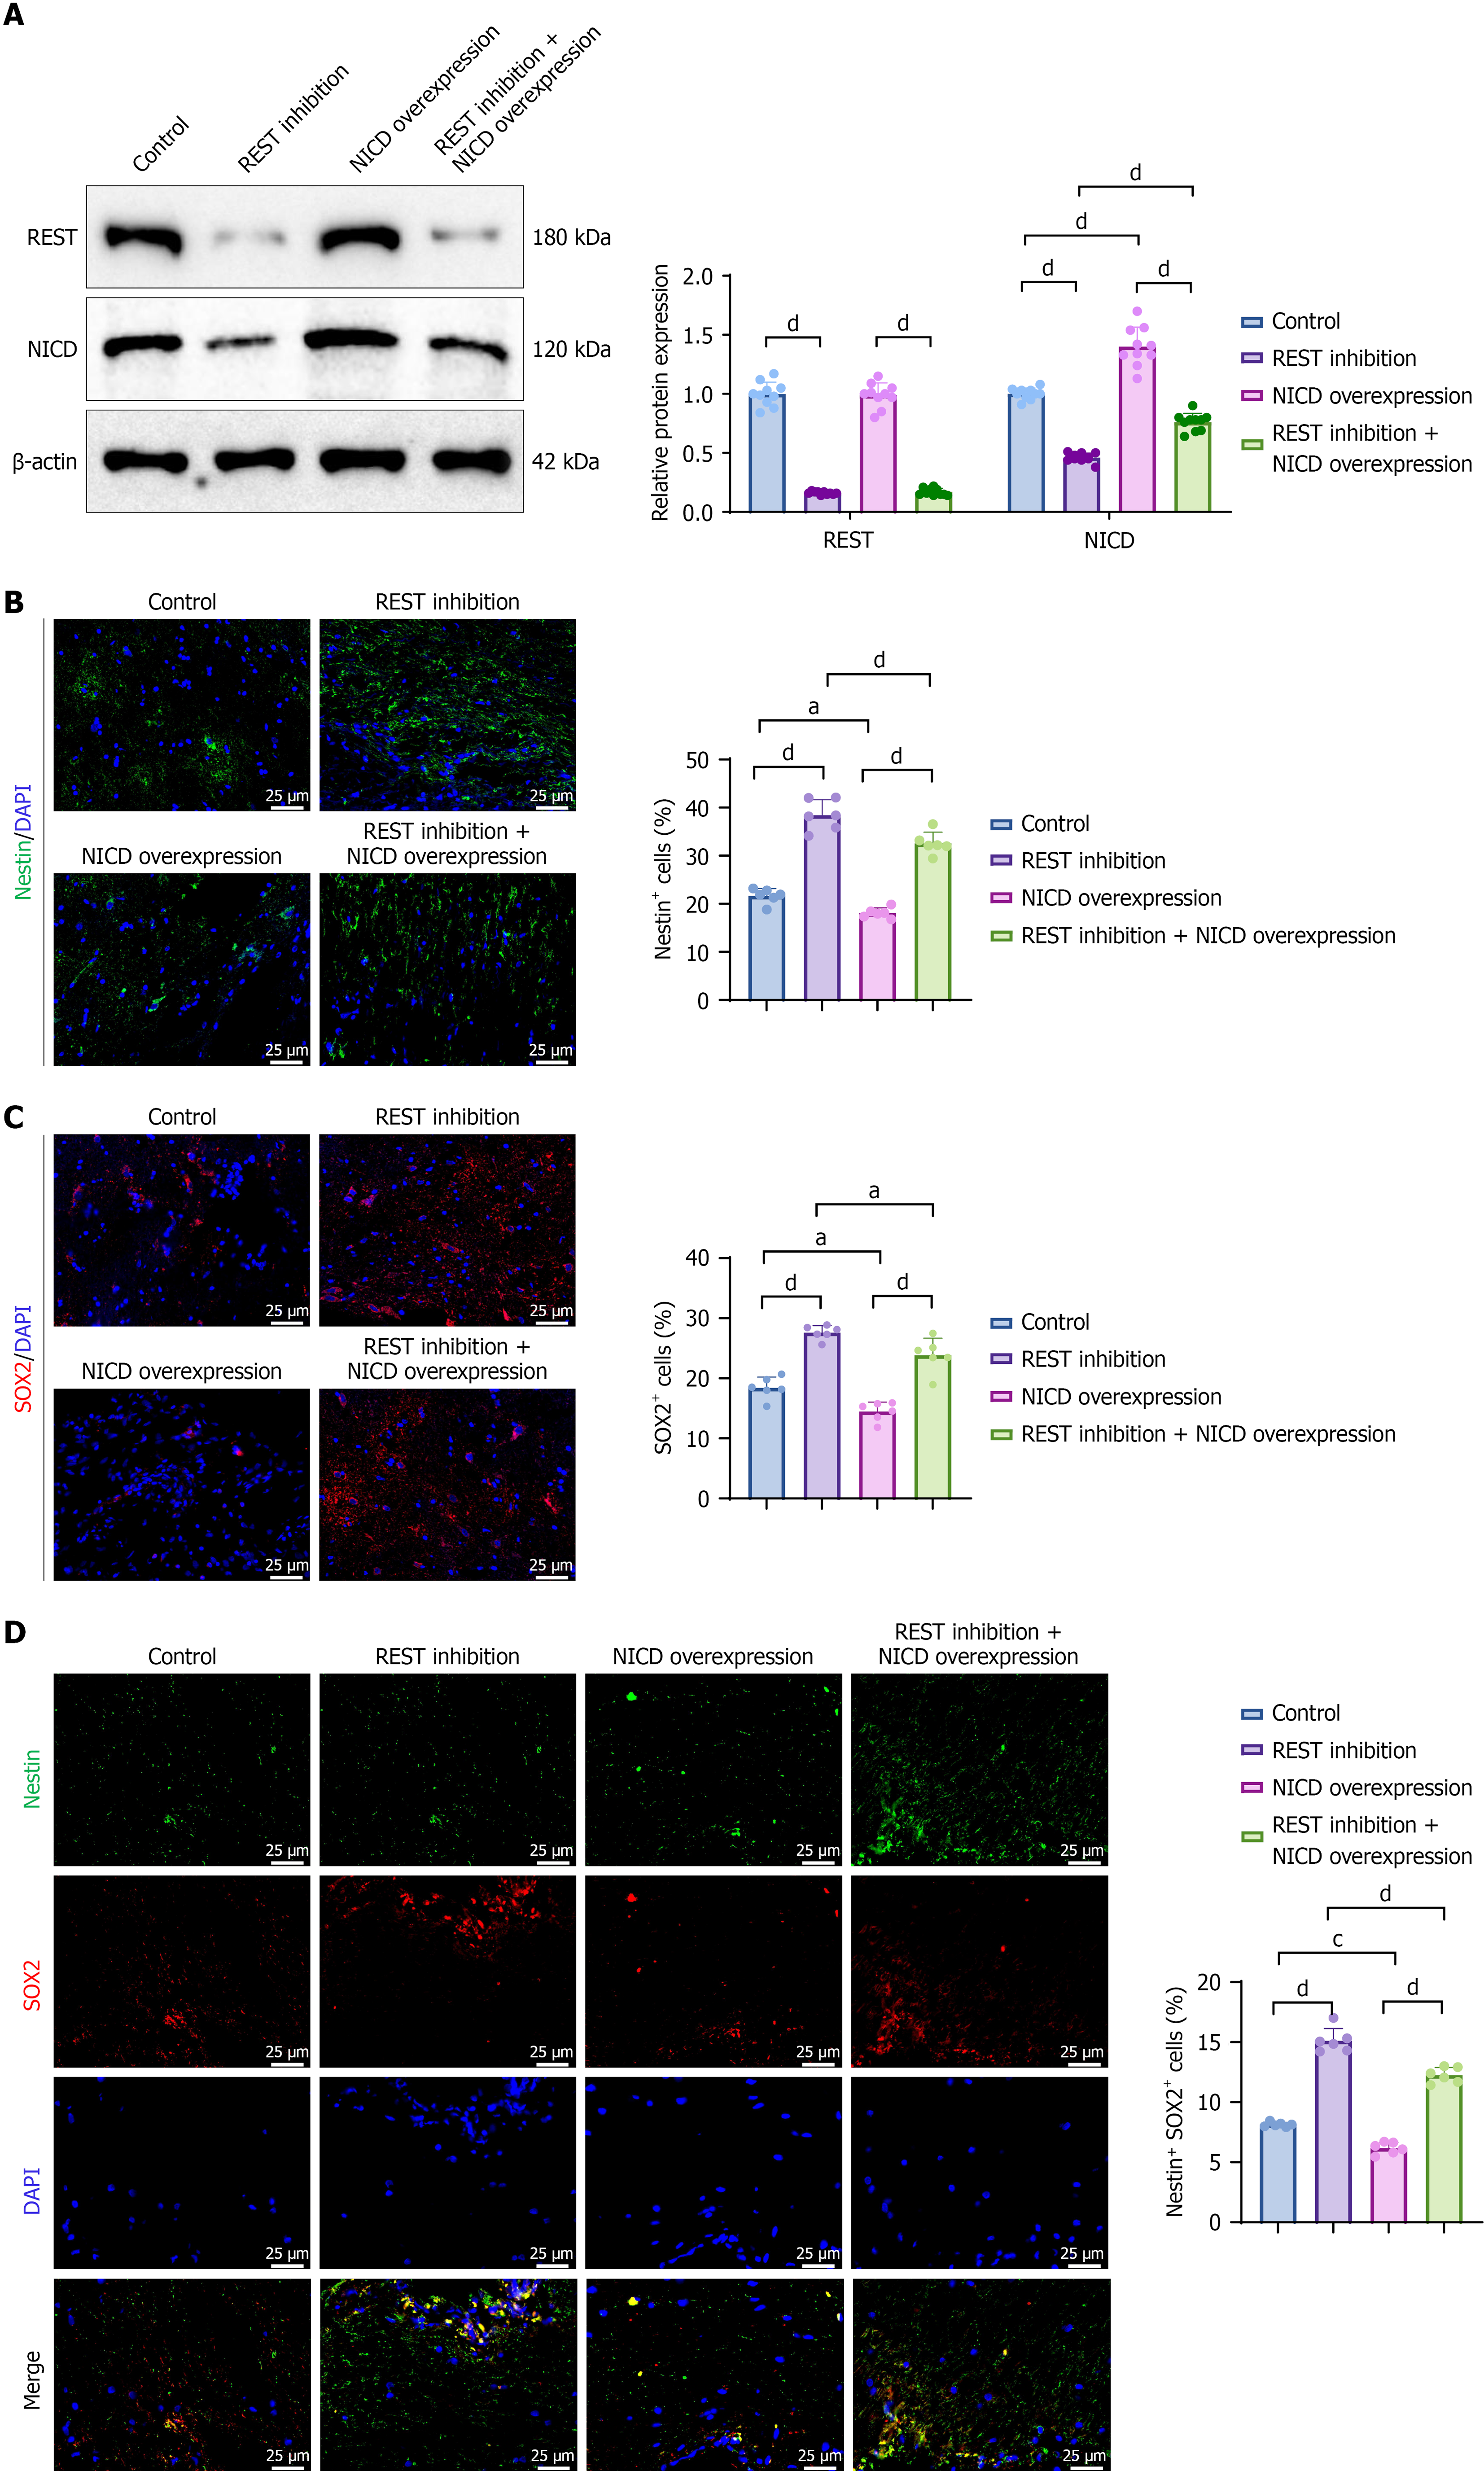
Figure 9 RE1-silencing transcription factor inhibition promotes the re-expression of neural stem cell markers in the lesion area.
A: Western blot analysis of RE1-silencing transcription factor (REST) and NICD protein expression in each group, with β-actin used as the internal control; B: Immunofluorescence images showing the distribution of Nestin (green) and DAPI (blue) signals in the control and REST inhibition groups. Scale bar = 25 μm. The bar graph on the right shows the quantitative comparison of the proportion of Nestin+ cells (n = 6, three fields per group); C: Immunofluorescence images displaying SOX2 (red) and DAPI (blue) signals in the control and REST inhibition groups. Scale bar = 25 μm. The bar graph on the right shows the quantitative comparison of the proportion of SOX2+ cells (n = 6, three fields per group); D: Co-localization images of Nestin (green) and SOX2 (red) double-positive cells. Scale bar = 25 μm. The bar graph below shows the quantitative comparison of the proportion of Nestin (green) and SOX2 (red) double-positive cells (n = 6, three fields per group). Statistical analysis was performed using one-way analysis of variance (ANOVA) followed by Tukey’s post hoc test, with significance set at P < 0.05. aP < 0.05, cP < 0.001, dP < 0.0001. REST: RE1-silencing transcription factor.
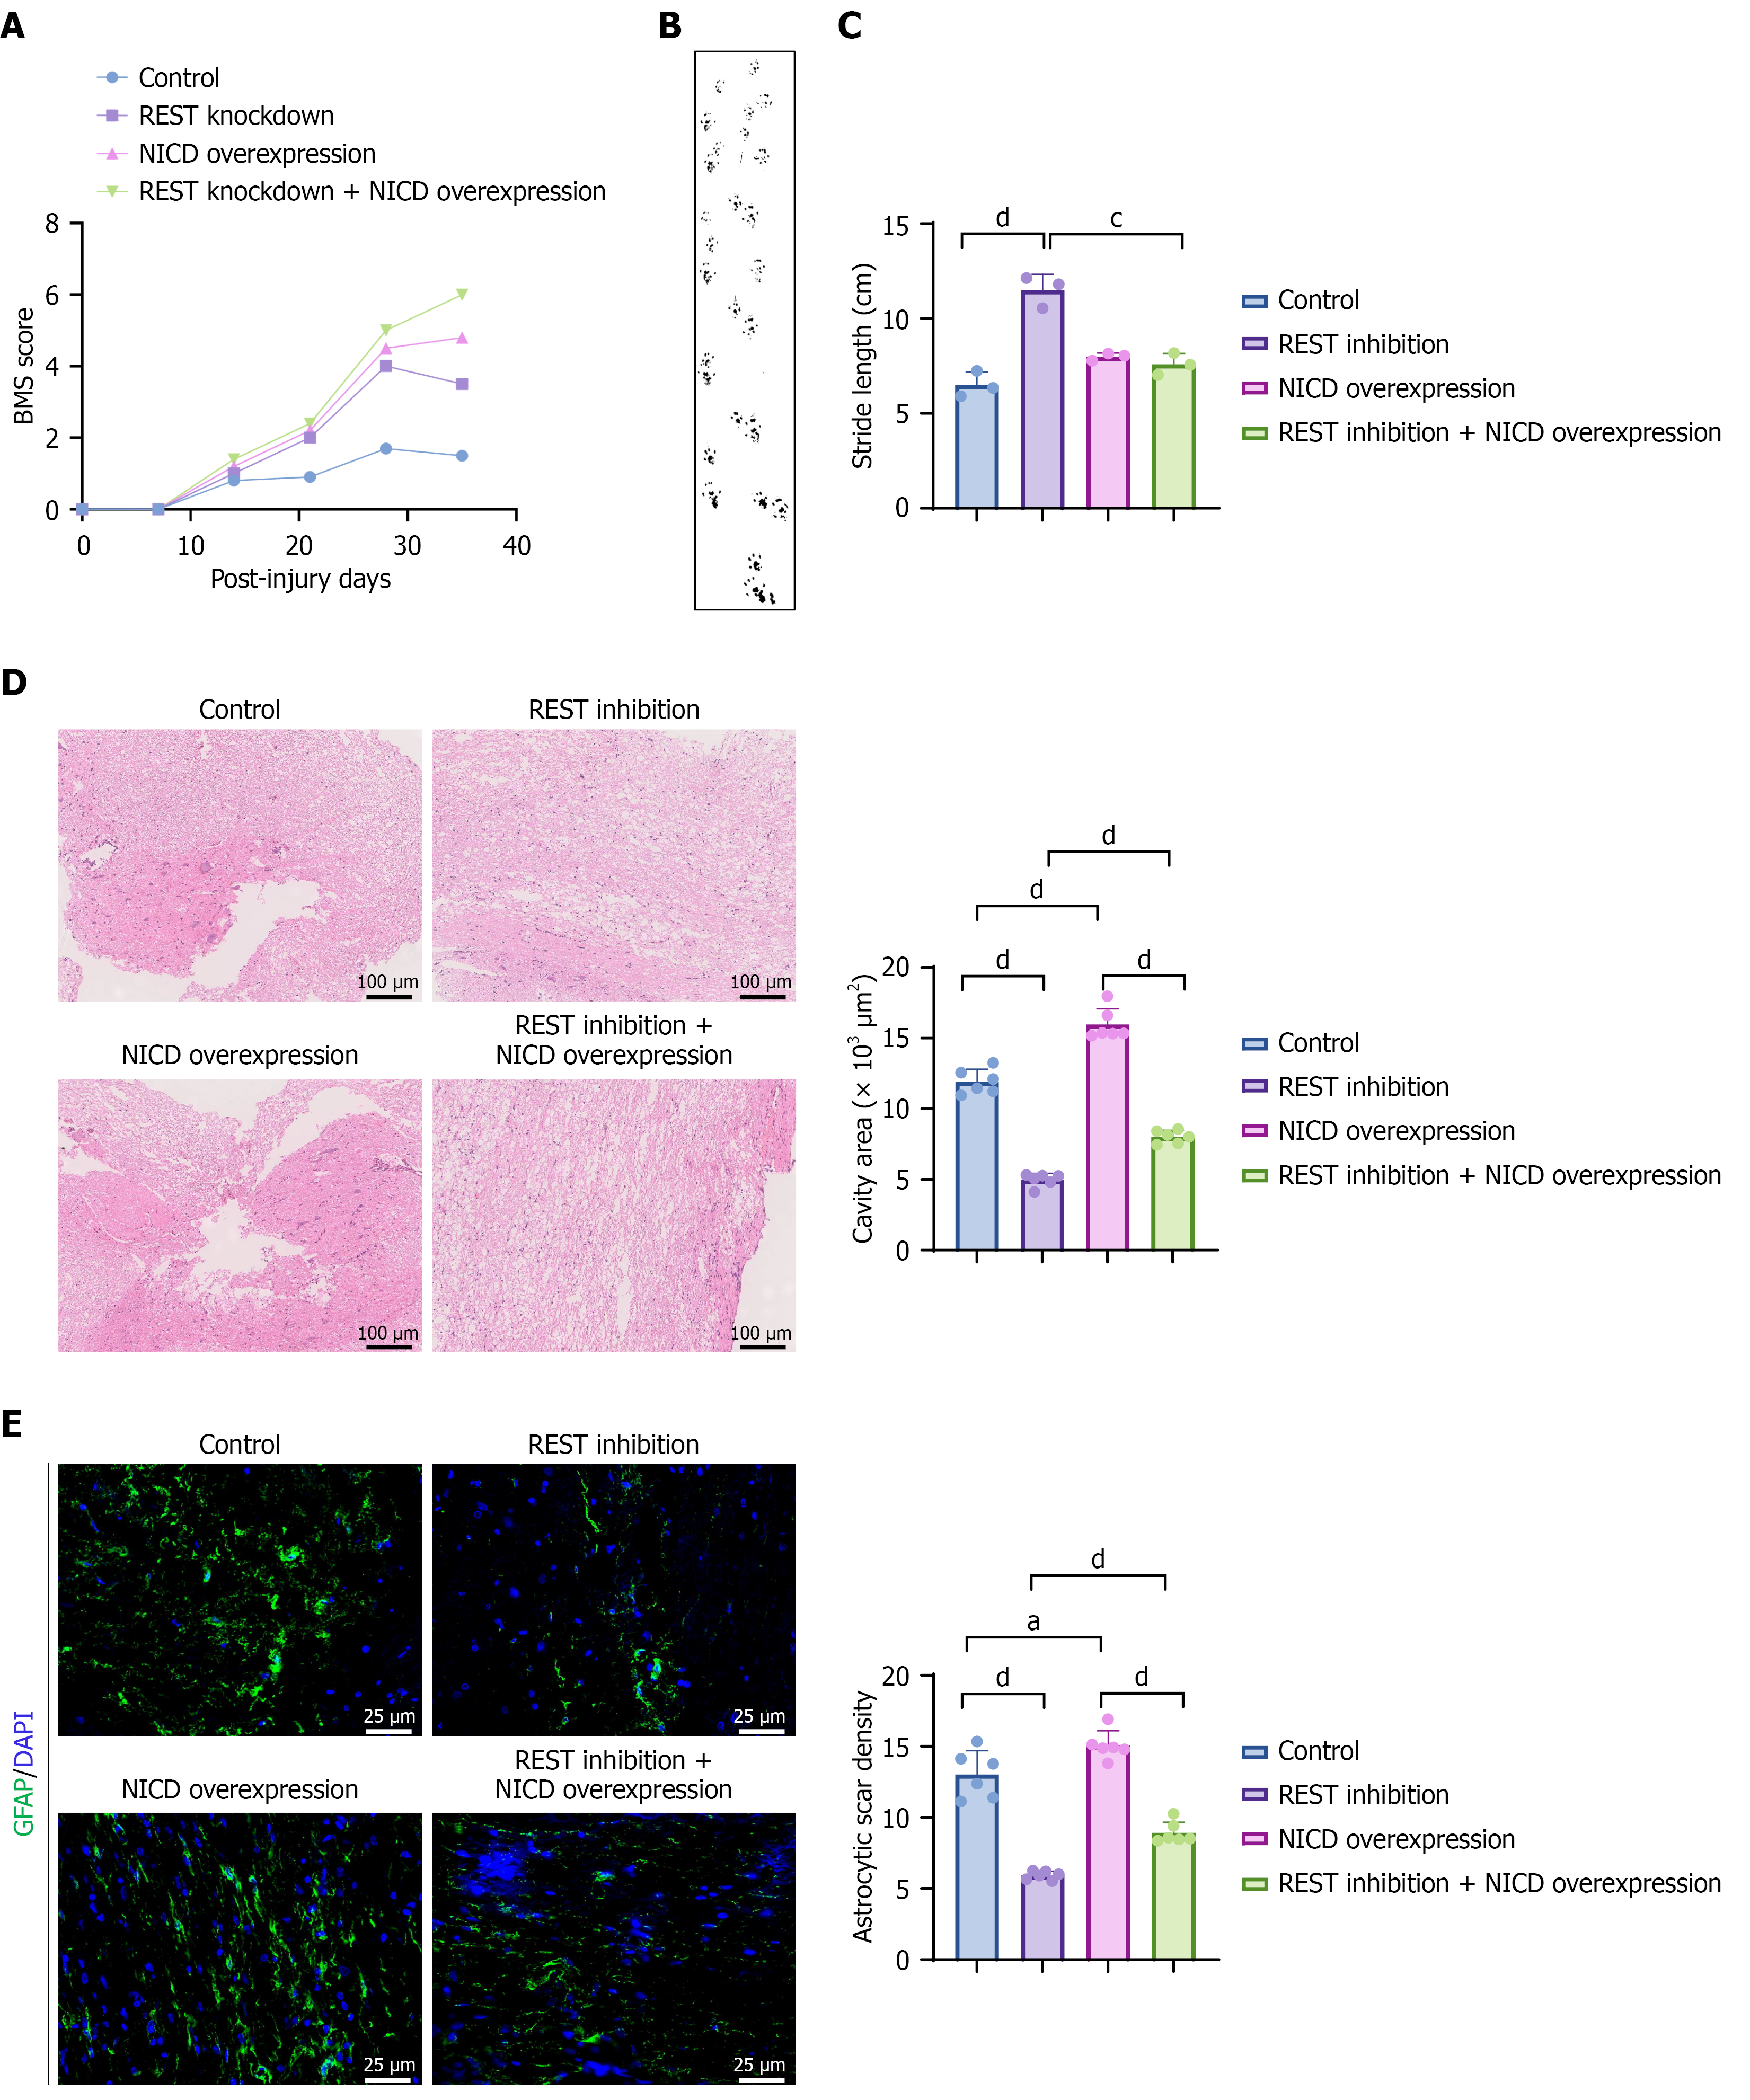
Figure 10 RE1-silencing transcription factor inhibition significantly enhances motor function recovery following spinal cord injury in mice.
A: Basso Mouse Scale score time-course line graph showing significantly higher scores in the RE1-silencing transcription factor inhibition group compared to controls, with the dual-intervention group exhibiting intermediate levels; B: Schematic illustration of footprint-based gait analysis; C: Quantification of hindlimb stride length, revealing a marked increase in the RE1-silencing transcription factor inhibition group; D: Representative hematoxylin and eosin staining images and quantitative analysis of cavity area; E: Representative GFAP immunofluorescence images and quantification of astroglial scar density. aP < 0.05, cP < 0.001, dP < 0.0001. BMS: Basso Mouse Scale; REST: RE1-silencing transcription factor.
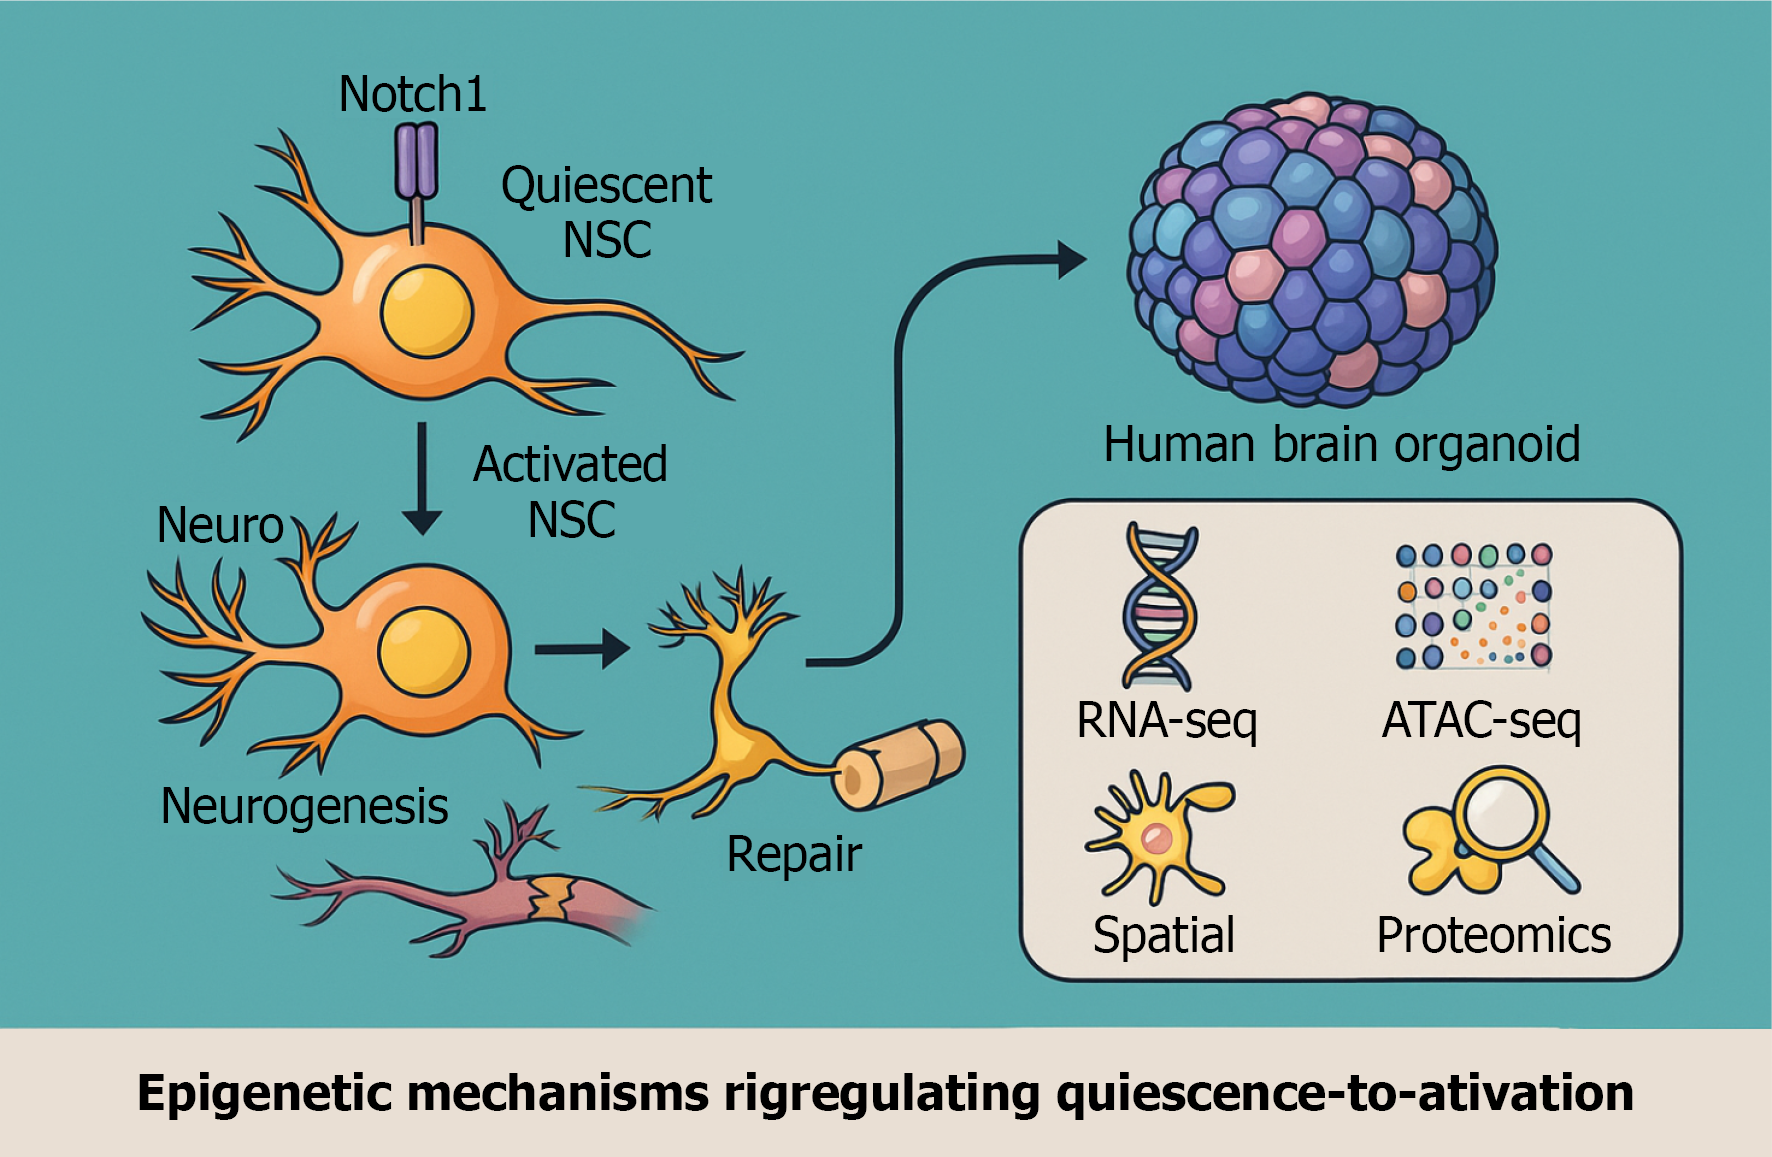
Figure 11 Graphical abstract.
Schematic of the multi-omics mechanism by which the neurogenic locus notch homolog protein 1-RE1-silencing transcription factor transcriptional axis regulates the dormancy-to-activation transition in human neural stem cells through epigenetic and metabolic reprogramming. Notch1: Neurogenic locus notch homolog protein 1; NSC: Neural stem cell; ATAC-seq: Assay for transposase-accessible chromatin using sequencing.
- Citation: Xie ZC, Zhao XY, Xiong RH, Zhang XL, Yang W. Dynamic regulation of neural stem cell state transitions by NOTCH1-REST transcriptional axis. World J Stem Cells 2026; 18(8): 117617
- URL: https://www.wjgnet.com/1948-0210/full/v18/i8/117617.htm
- DOI: https://dx.doi.org/10.4252/wjsc.117617