
















Copyright: ©Author(s) 2026.
World J Stem Cells. Jul 26, 2026; 18(7): 120578
Published online Jul 26, 2026. doi: 10.4252/wjsc.120578
Published online Jul 26, 2026. doi: 10.4252/wjsc.120578
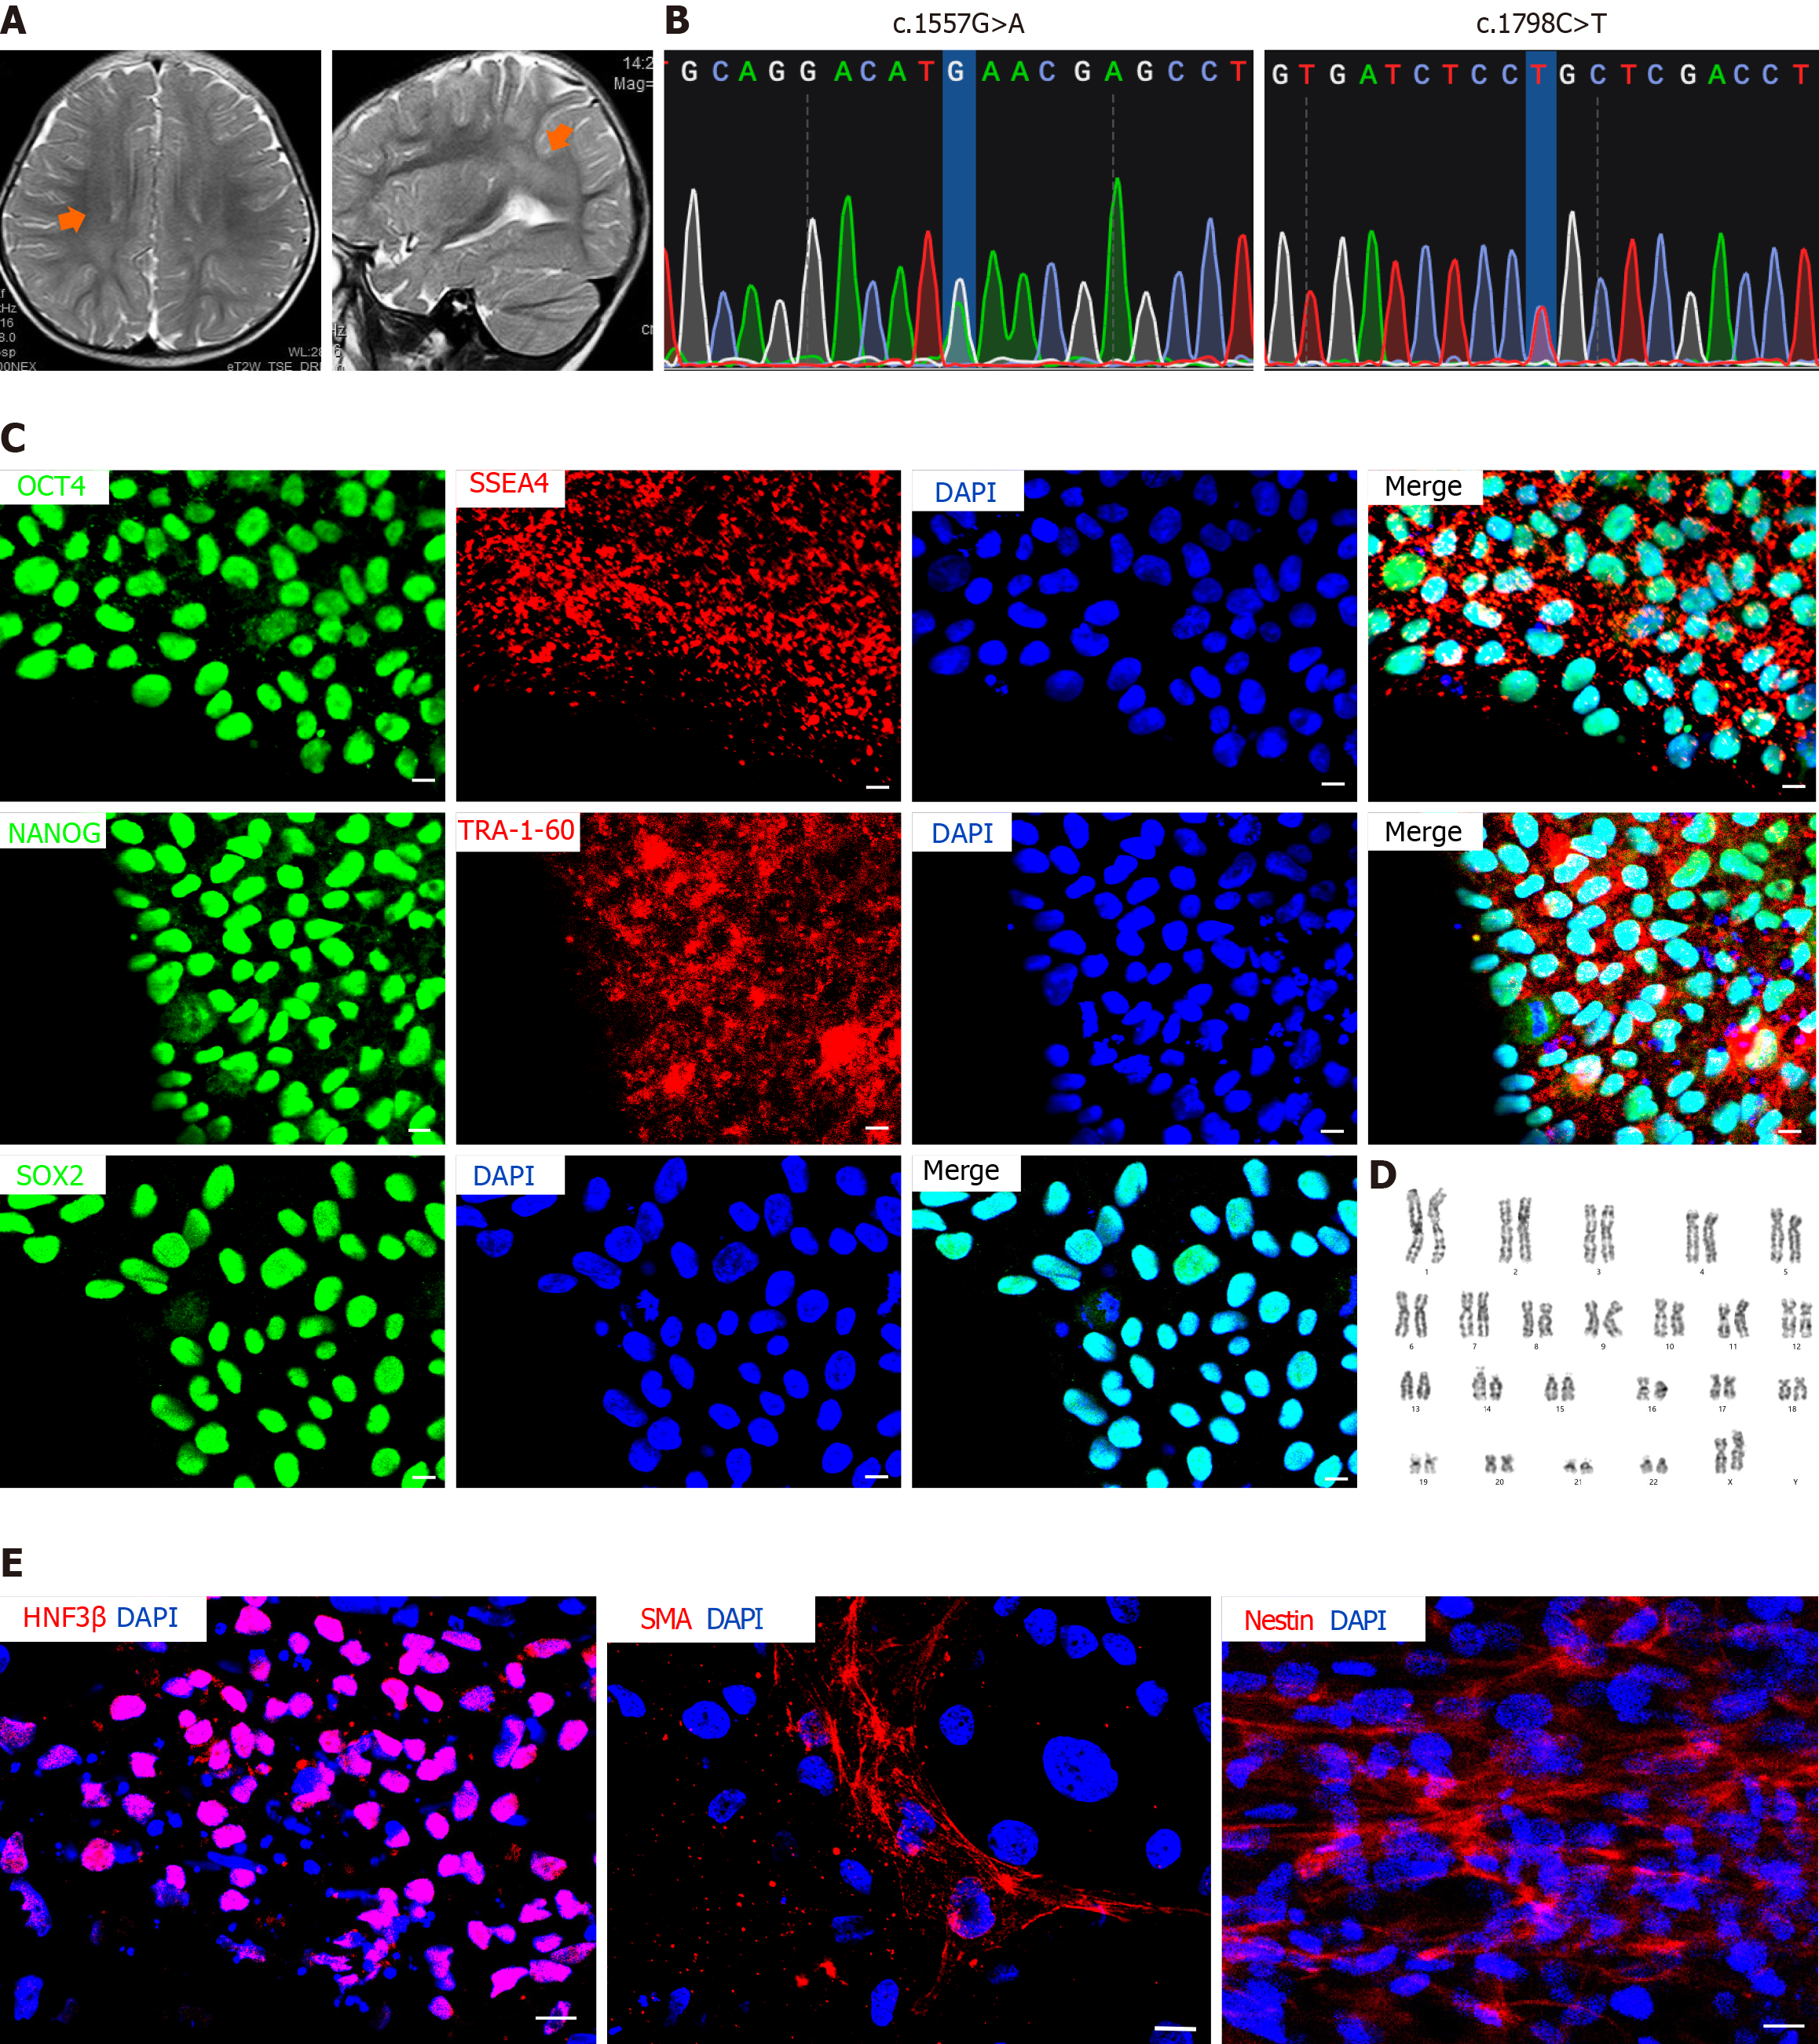
Figure 1 Generation and validation of induced pluripotent stem cell line from an infantile-onset Pompe disease patient with central nervous system involvement.
A: Cranial T2-weighted magnetic resonance imaging reveals bilateral frontoparietal white matter mild hyperintensity (orange arrows); B: Sanger sequencing confirms pathogenic variants in the acid α-glucosidase gene: C.1557G>A (p.M519I) and c.1798C>T (p.R600C); C: Immunofluorescence staining demonstrates expression of pluripotency markers (OCT4, SSEA4, NANOG, TRA1-60, and SOX2) in patient-derived induced pluripotent stem cells. Scale bar = 100 μm; D: G-banding shows a normal 46, XX karyotype in the established infantile-onset Pompe disease patient - specific induced pluripotent stem cell line; E: In vitro EB formation and immunofluorescence staining confirm trilineage differentiation potential, as evidenced by expression of hepatocyte nuclear factor 3-β (endoderm), α-smooth muscle actin (mesoderm), and Nestin (ectoderm). Scale bar = 100 μm. HNF3β: Hepatocyte nuclear factor 3-β; SMA: Smooth muscle actin.
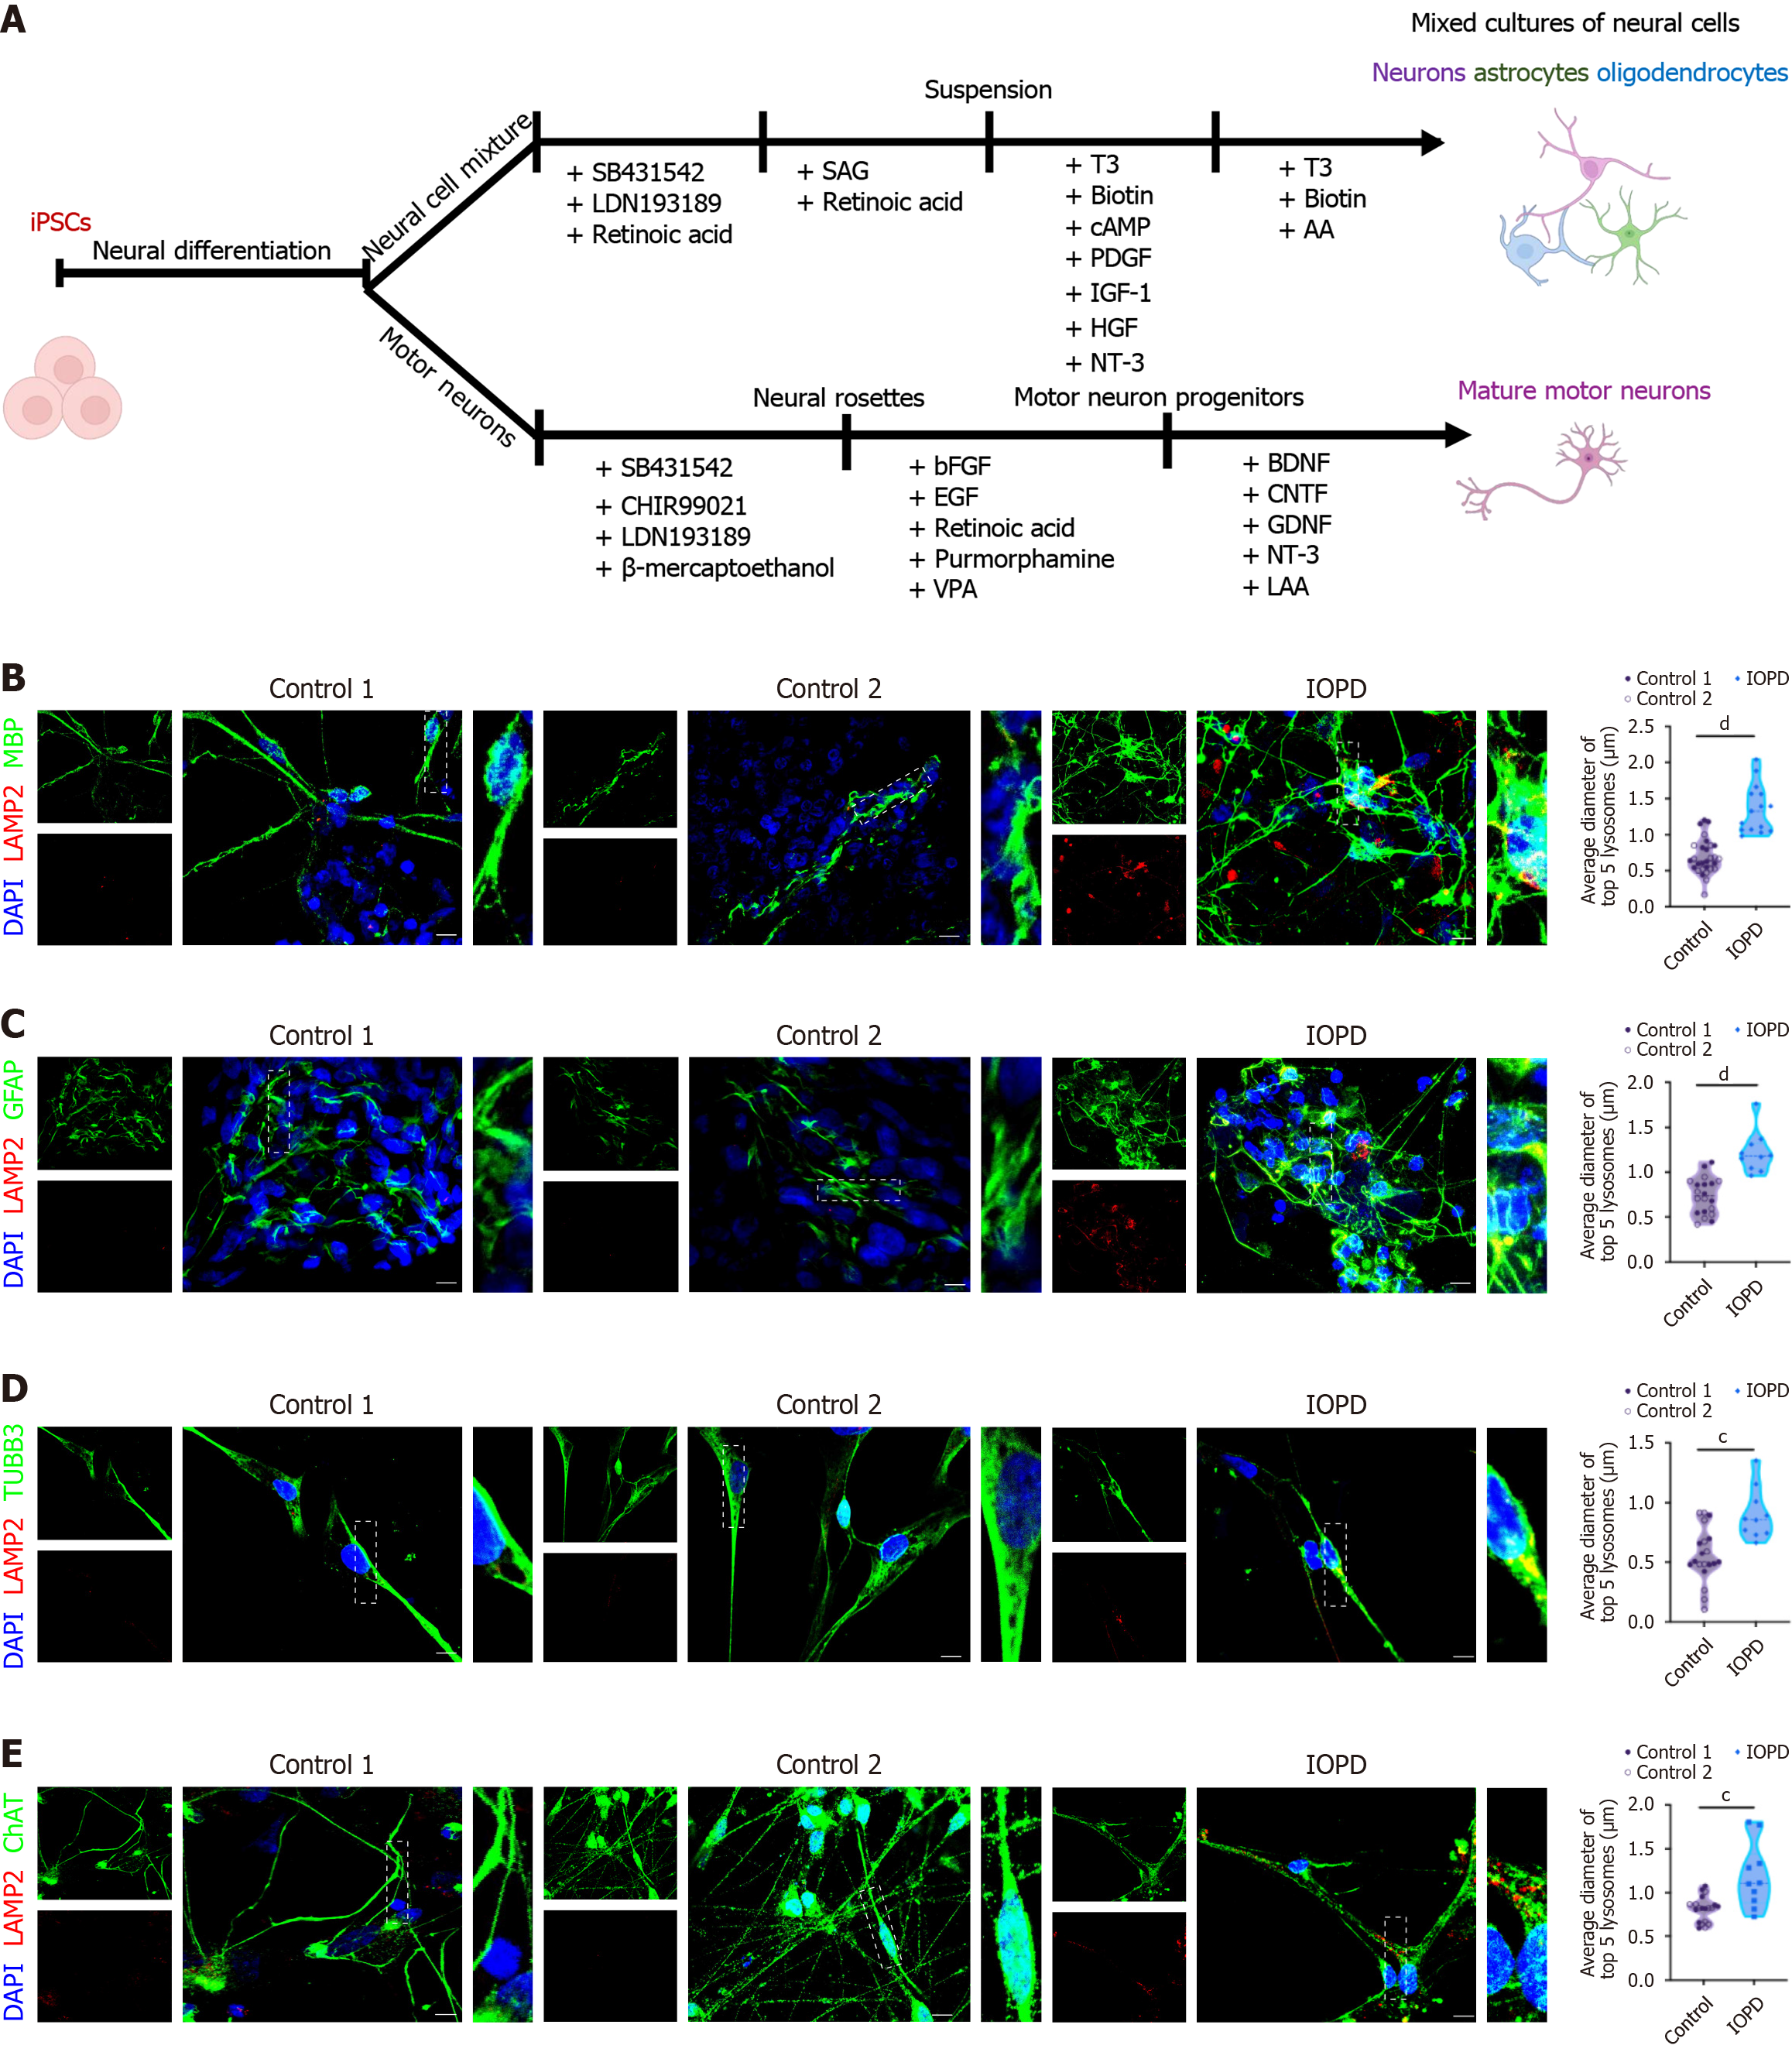
Figure 2 Patient-specific induced pluripotent stem cell-derived neural cells exhibit cell-type-specific lysosomal pathology.
A: Schematic diagram of the differentiation protocol to generate cortical neurons, astrocytes, oligodendrocytes, and spinal motor neurons; B-E: Representative immunofluorescence images and quantification of lysosomal size showing co-localization of the lysosomal marker LAMP2 (red) with lineage-specific markers (green): MBP (oligodendrocytes, B), GFAP (astrocytes, C), TUBB3 (cortical neurons, D), and ChAT (motor neurons, E). Nuclei were counterstained with DAPI (blue). Quantitative analysis revealed significant lysosomal enlargement in all infantile-onset Pompe disease-derived neural subtypes vs controls (oligodendrocytes: dP < 0.0001; astrocytes: dP < 0.0001; cortical neurons: cP < 0.001; motor neurons: cP < 0.001; unpaired two-tailed Student’s t-test). For each cell type, 10-15 cells were quantified per experiment from three independent differentiations. Data are presented as mean ± SEM. Scale bar = 50 μm. iPSCs: Induced pluripotent stem cell; IOPD: Infantile-onset Pompe disease.
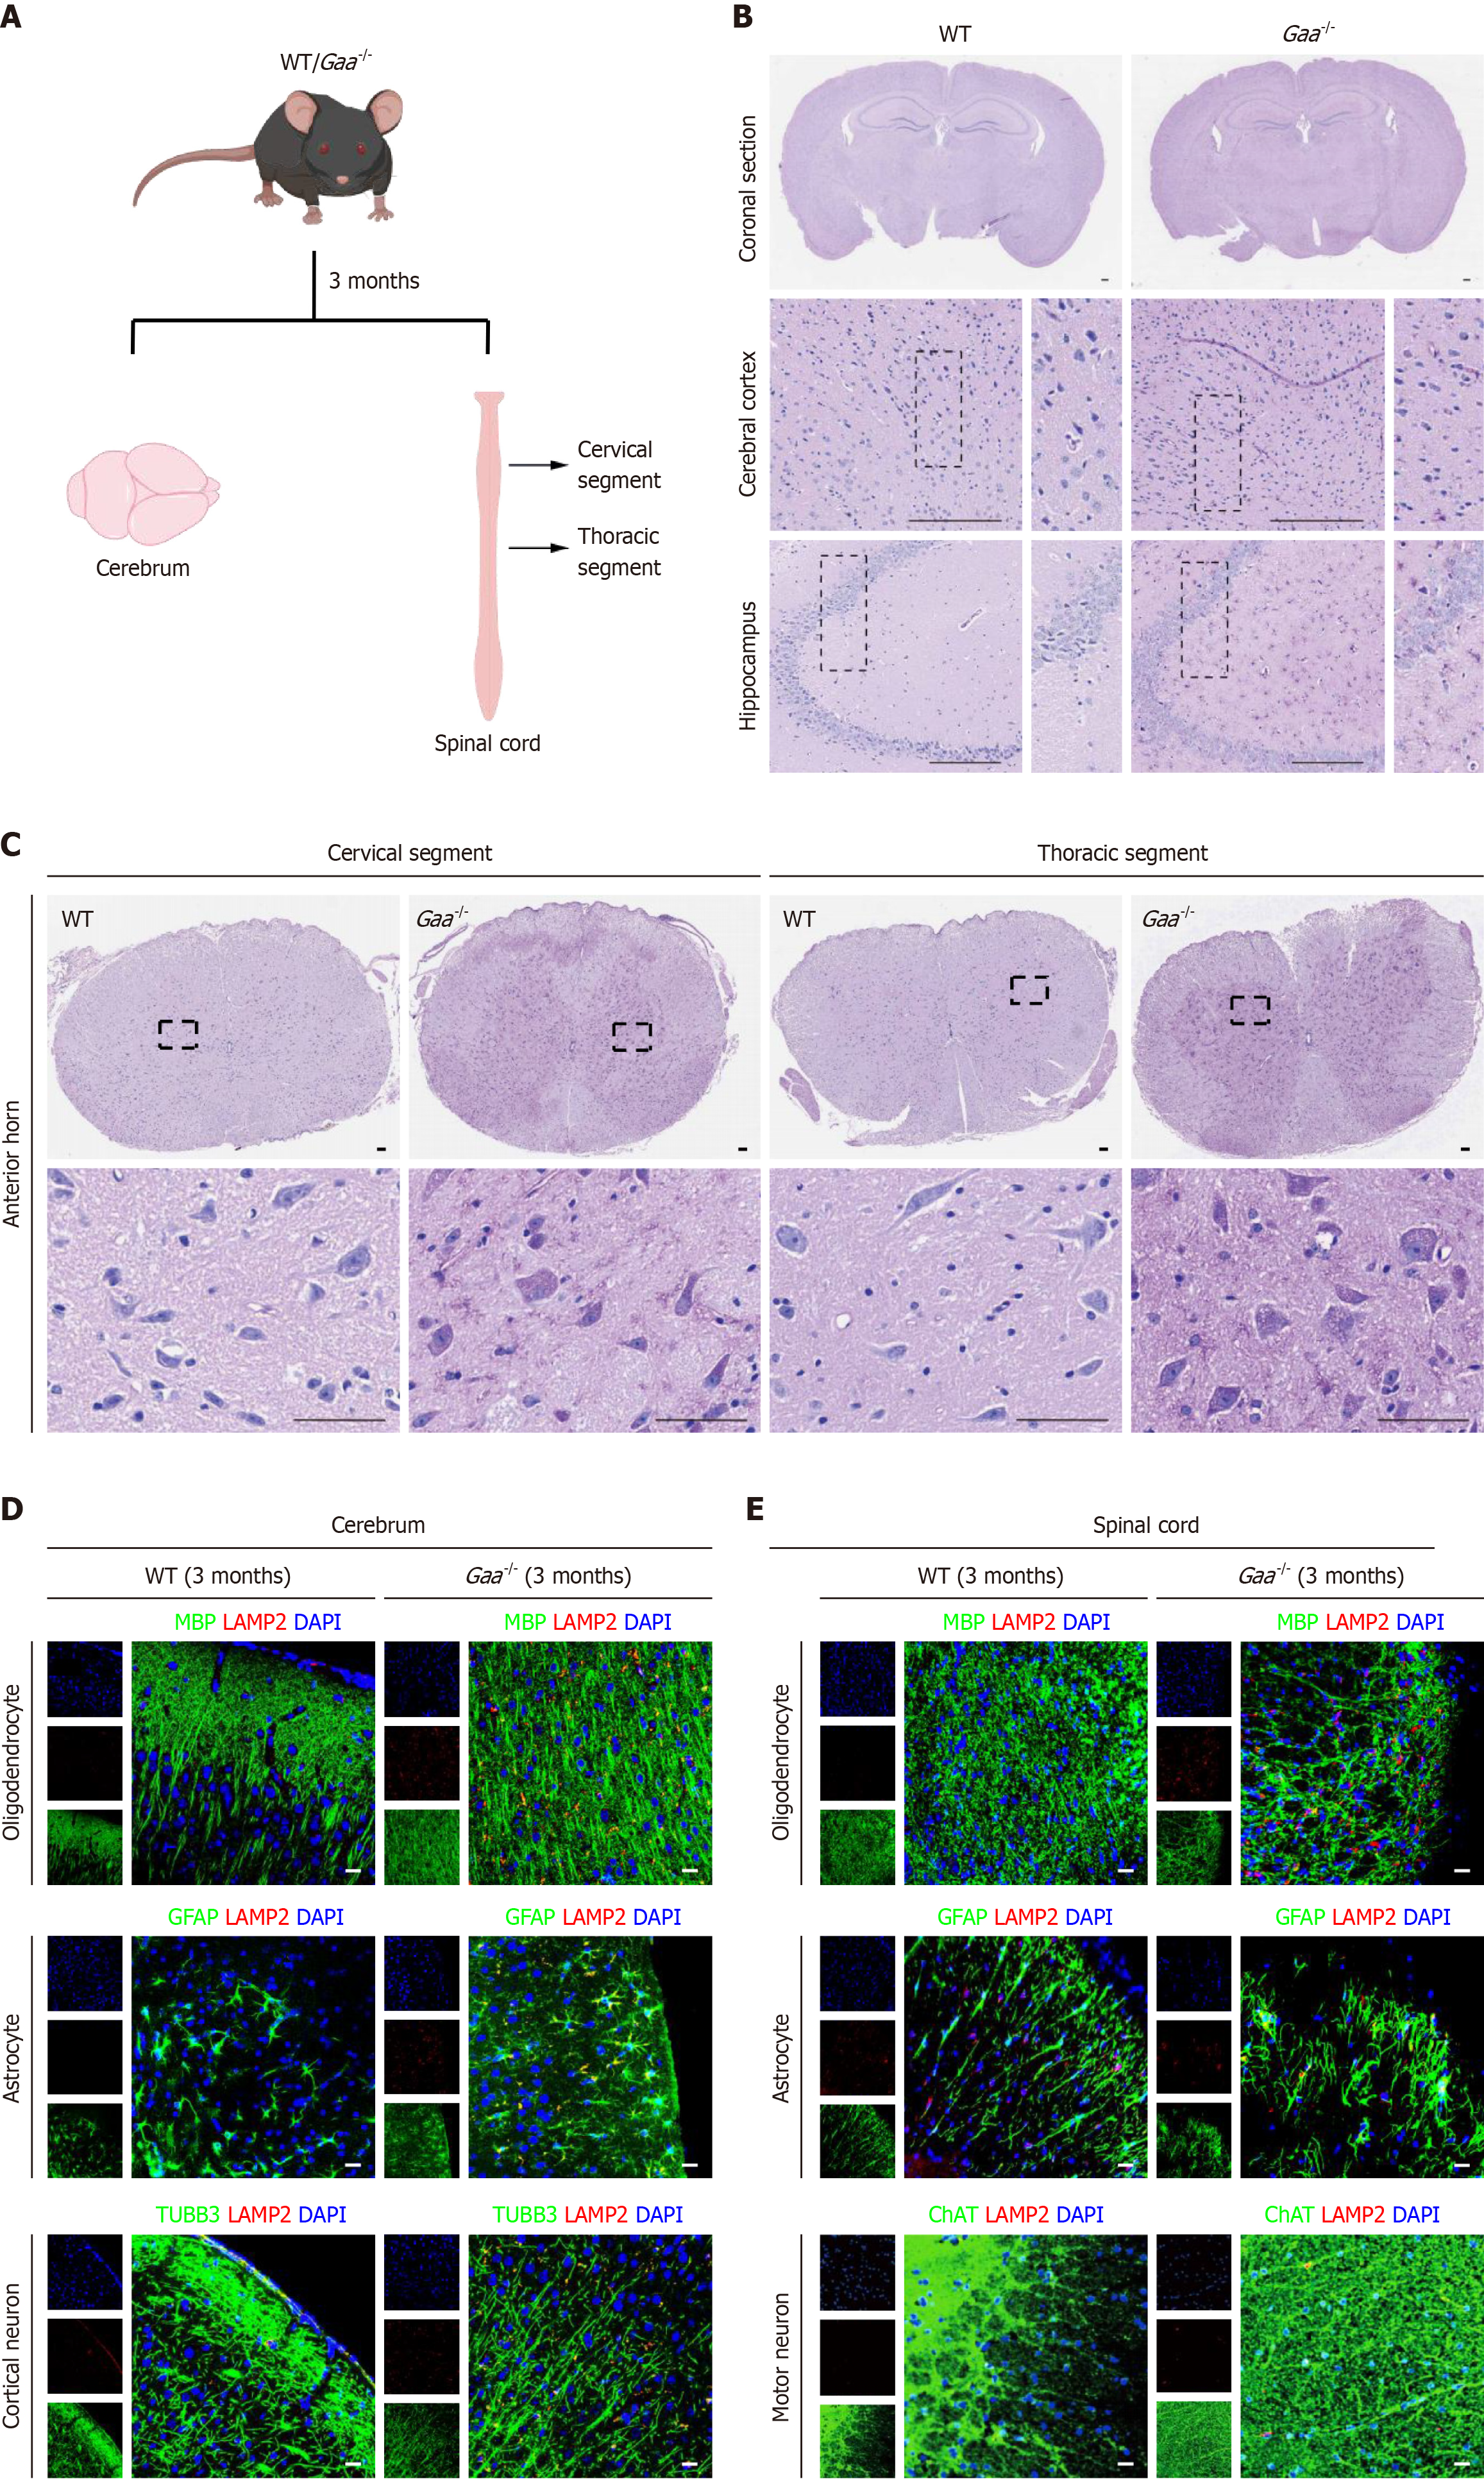
Figure 3 Central nervous system lysosomal pathology in Gaa-/- mice.
A: Schematic overview of tissue sampling from the brain and spinal cord of 3-month-old Gaa-/- mice; B: PAS staining reveals glycogen accumulation (magenta granules) in the cerebral cortex and hippocampus of Gaa-/- mice. Scale bar = 200 μm; C: PAS staining reveals glycogen accumulation (magenta granules) in the spinal cord ventral horn of Gaa-/- mice. Scale bar = 50 μm; D: Immunofluorescence co-staining of neural markers MBP, GFAP or TUBB3 with the lysosomal marker LAMP2 revealed pronounced lysosomal pathology in the cerebrum of Gaa-/- mice. Scale bar = 20 μm; E: Immunofluorescence co-staining for neural marker MBP, GFAP or ChAT with the lysosomal marker LAMP2 shows pronounced lysosomal pathology in the spinal cord of Gaa-/- mice. Scale bar = 20 μm. WT: Wild-type; GAA: Acid α-glucosidase.
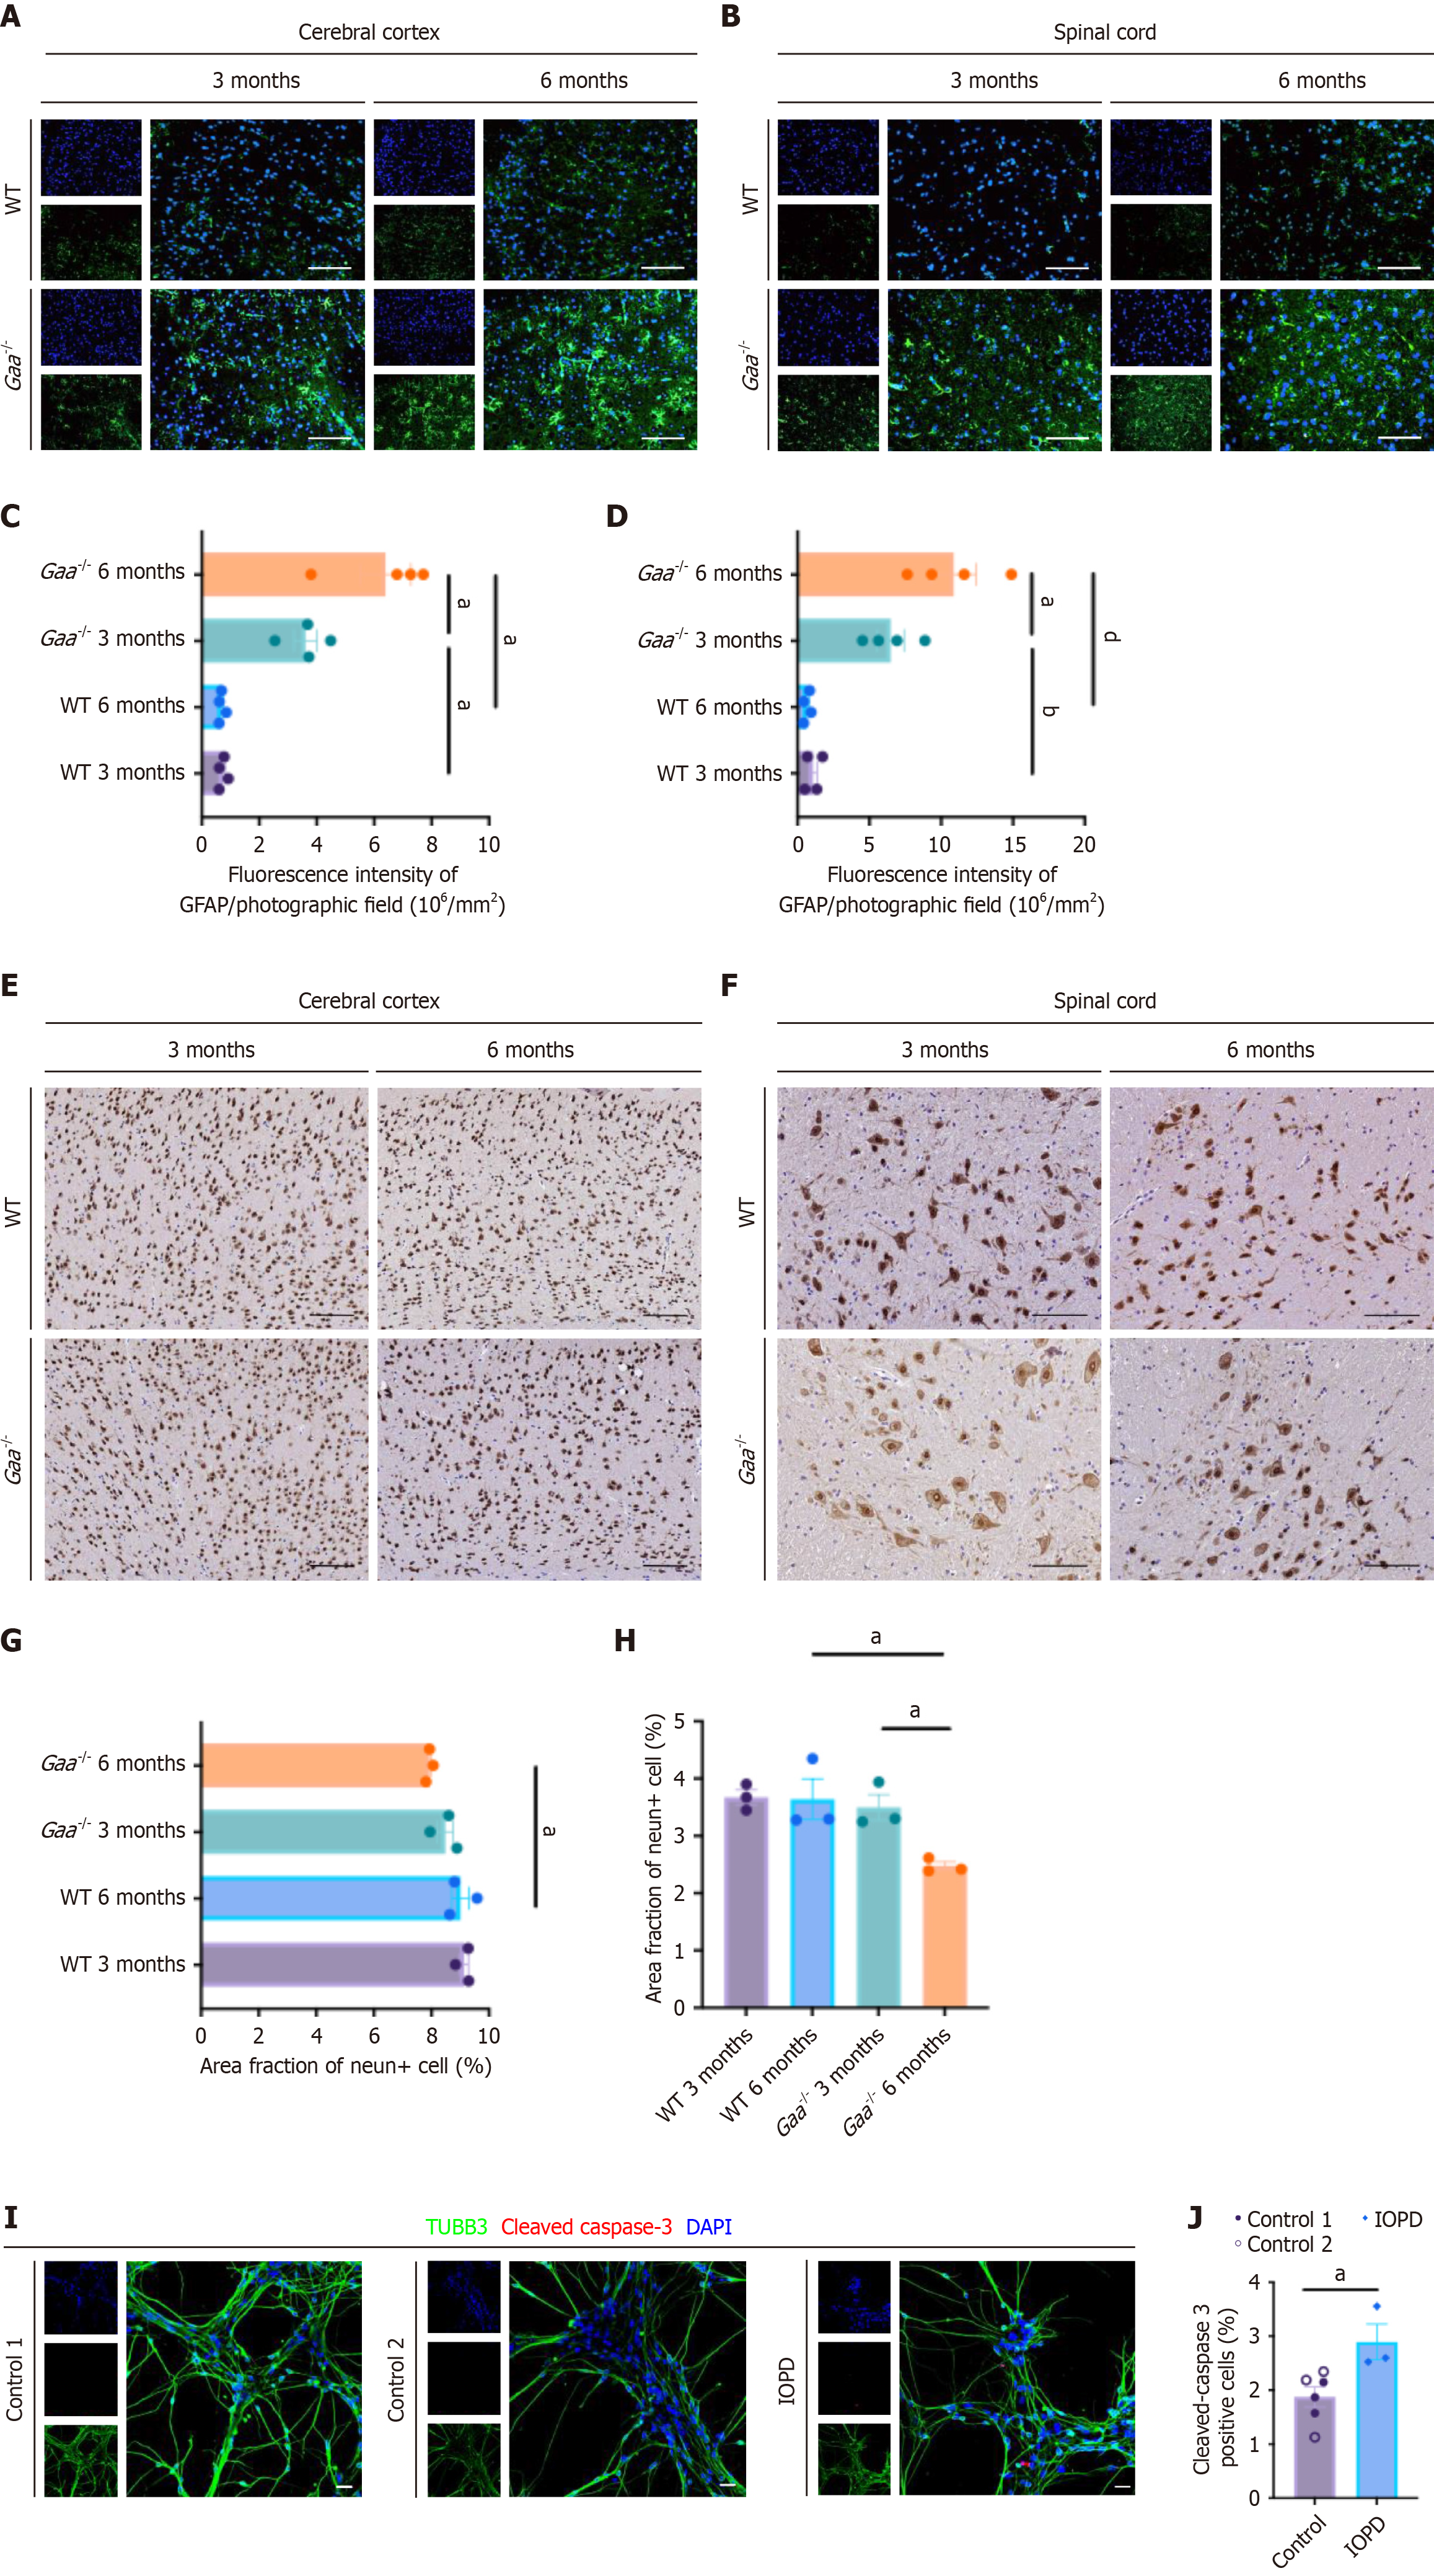
Figure 4 Progressive neurodegeneration in Gaa-/- mice and patient-derived neural cultures.
A: Representative GFAP immunofluorescence images of the cerebral cortex from 3- and 6-month-old wild-type (WT) and Gaa-/- mice. Scale bar = 100 μm; B: Representative GFAP immunofluorescence images of the spinal cord from 3- and 6-month-old WT and Gaa-/- mice. Scale bar = 100 μm; C: Quantification of GFAP fluorescence intensity in the cerebral cortex shown in A (n = 4 mice per group; data are presented as mean ± SEM; aP < 0.05, WT 3 months vs Gaa-/- 3 months; aP < 0.05, WT 6 months vs Gaa-/- 6 months; aP < 0.05, Gaa-/- 3 months vs Gaa-/- 6 months; one-way ANOVA); D: Quantification of GFAP fluorescence intensity in the spinal cord shown in B (n = 4 mice per group; data are presented as mean ± SEM; bP < 0.01, WT 3 months vs Gaa-/- 3 months; dP < 0.0001, WT 6 months vs Gaa-/- 6 months; aP < 0.05, Gaa-/- 3 months vs Gaa-/- 6 months; one-way ANOVA); E: Representative NeuN immunostaining of the cerebral cortex from 3- and 6-month-old WT and Gaa-/- mice. Scale bar = 100 μm; F: Representative NeuN immunostaining of the spinal cord from 3- and 6-month-old WT and Gaa-/- mice. Scale bar = 100 μm; G: Quantification of the NeuN+ area fraction in the cerebral cortex shown in E (n = 3 mice per group; data are presented as mean ± SEM; aP < 0.05, WT 6 months vs Gaa-/- 6 months; one-way ANOVA); H: Quantification of the NeuN+ area fraction in the spinal cord shown in F (n = 3 mice per group; data are presented as mean ± SEM; aP < 0.05, WT 6 months vs Gaa-/- 6 months; aP < 0.05, Gaa-/- 3 months vs Gaa-/- 6 months; one-way ANOVA); I: Immunofluorescence images of patient - derived induced pluripotent stem cell neurons cultured for 90 days, showing increased cleaved caspase-3 (red) positivity in TUBB3+ neurons (green) compared to controls. Nuclei counterstained with DAPI (blue). Scale bar = 20 μm; J: Quantification of cleaved caspase-3 positivity in TUBB3+ neurons shown in I (n = 3 independent differentiation; data are presented as mean ± SEM; aP < 0.05; unpaired two-tailed Student’s t-test). WT: Wild-type; GAA: Acid α-glucosidase; IOPD: Infantile-onset Pompe disease.
- Citation: Jiao YC, Zhao DD, Zhang HY, Liu FC. Integrated patient induced pluripotent stem cell models and Gaa-/- mice reveal central nervous system neural pathology in infantile-onset Pompe disease. World J Stem Cells 2026; 18(7): 120578
- URL: https://www.wjgnet.com/1948-0210/full/v18/i7/120578.htm
- DOI: https://dx.doi.org/10.4252/wjsc.120578