
















Copyright: ©Author(s) 2026.
World J Stem Cells. Oct 26, 2026; 18(10): 124640
Published online Oct 26, 2026. doi: 10.4252/wjsc.124640
Published online Oct 26, 2026. doi: 10.4252/wjsc.124640
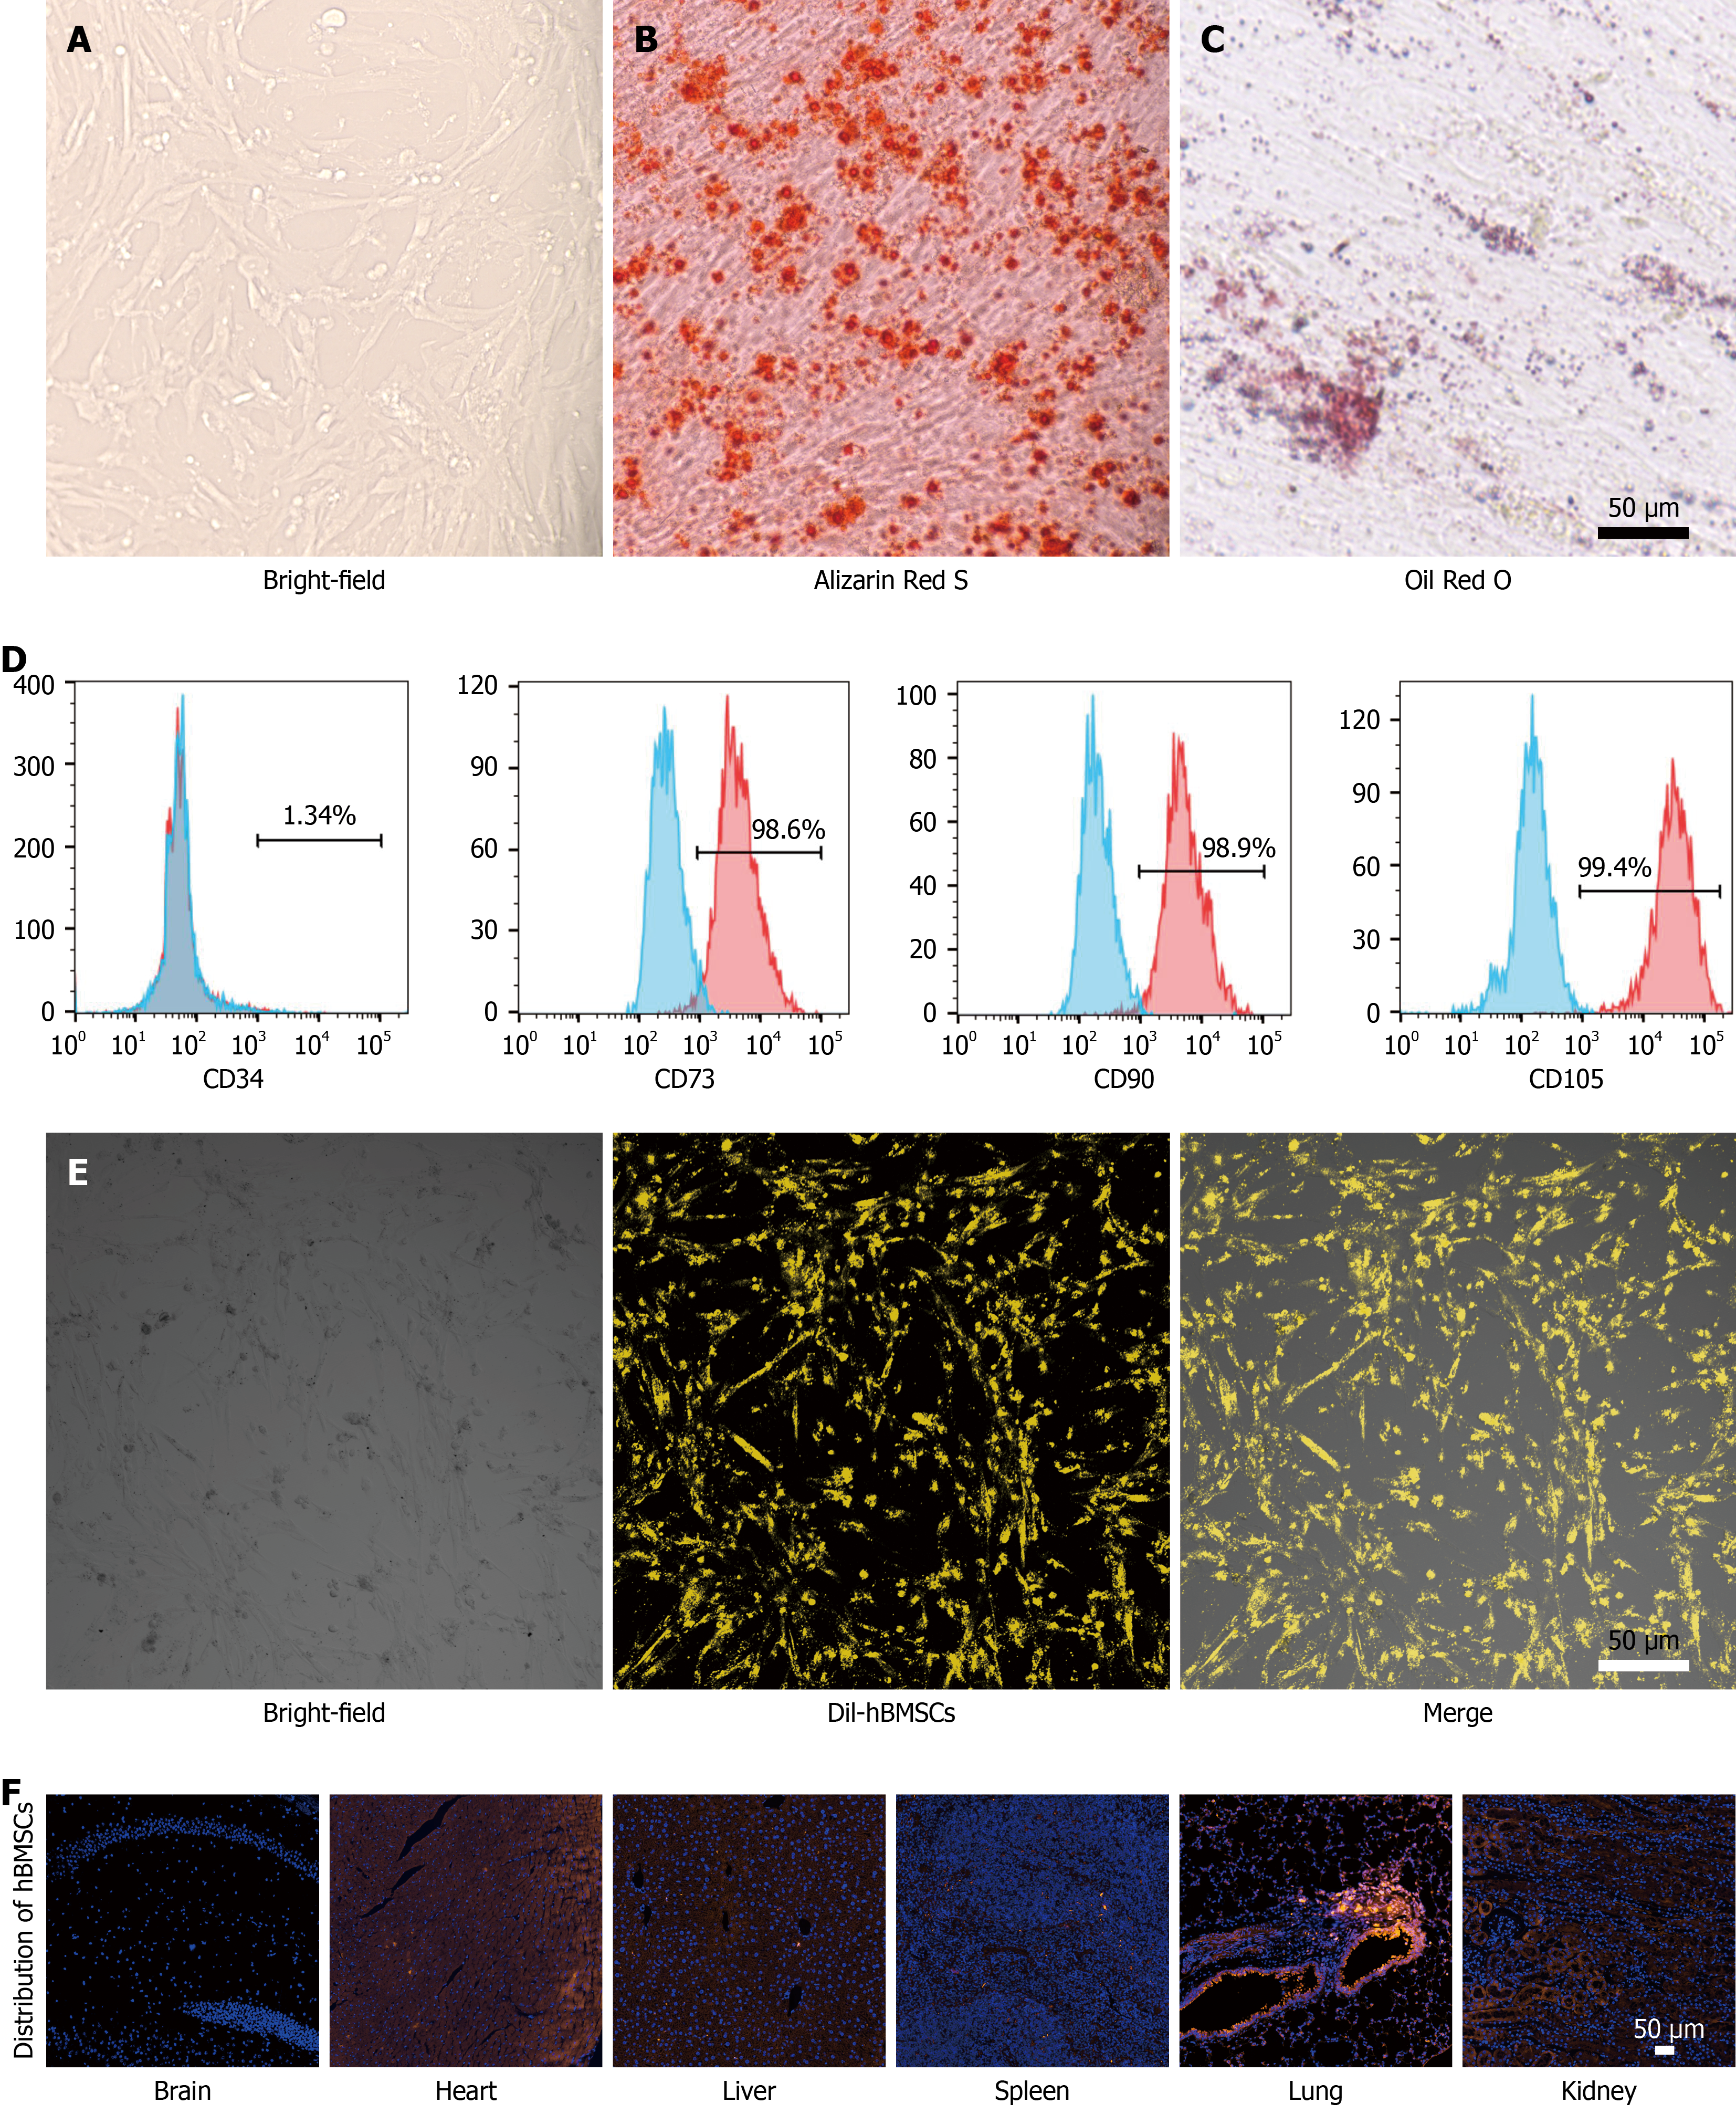
Figure 1 Characterization of human bone-marrow-derived mesenchymal stem cells.
A: Representative bright-field image showing the morphology of human bone-marrow-derived mesenchymal stem cells (hBMSCs); B: Alizarin Red S staining; C: Oil Red O staining; D: Surface marker profiling of hBMSCs by flow cytometry. Mesenchymal stem cells showed higher levels of CD73, CD90, and CD105, and lower levels of CD34; E: Representative images of the DiI-labeled hBMSCs; F: The fluorescence imaging of different organs. hBMSCs: Human bone-marrow-derived mesenchymal stem cells.
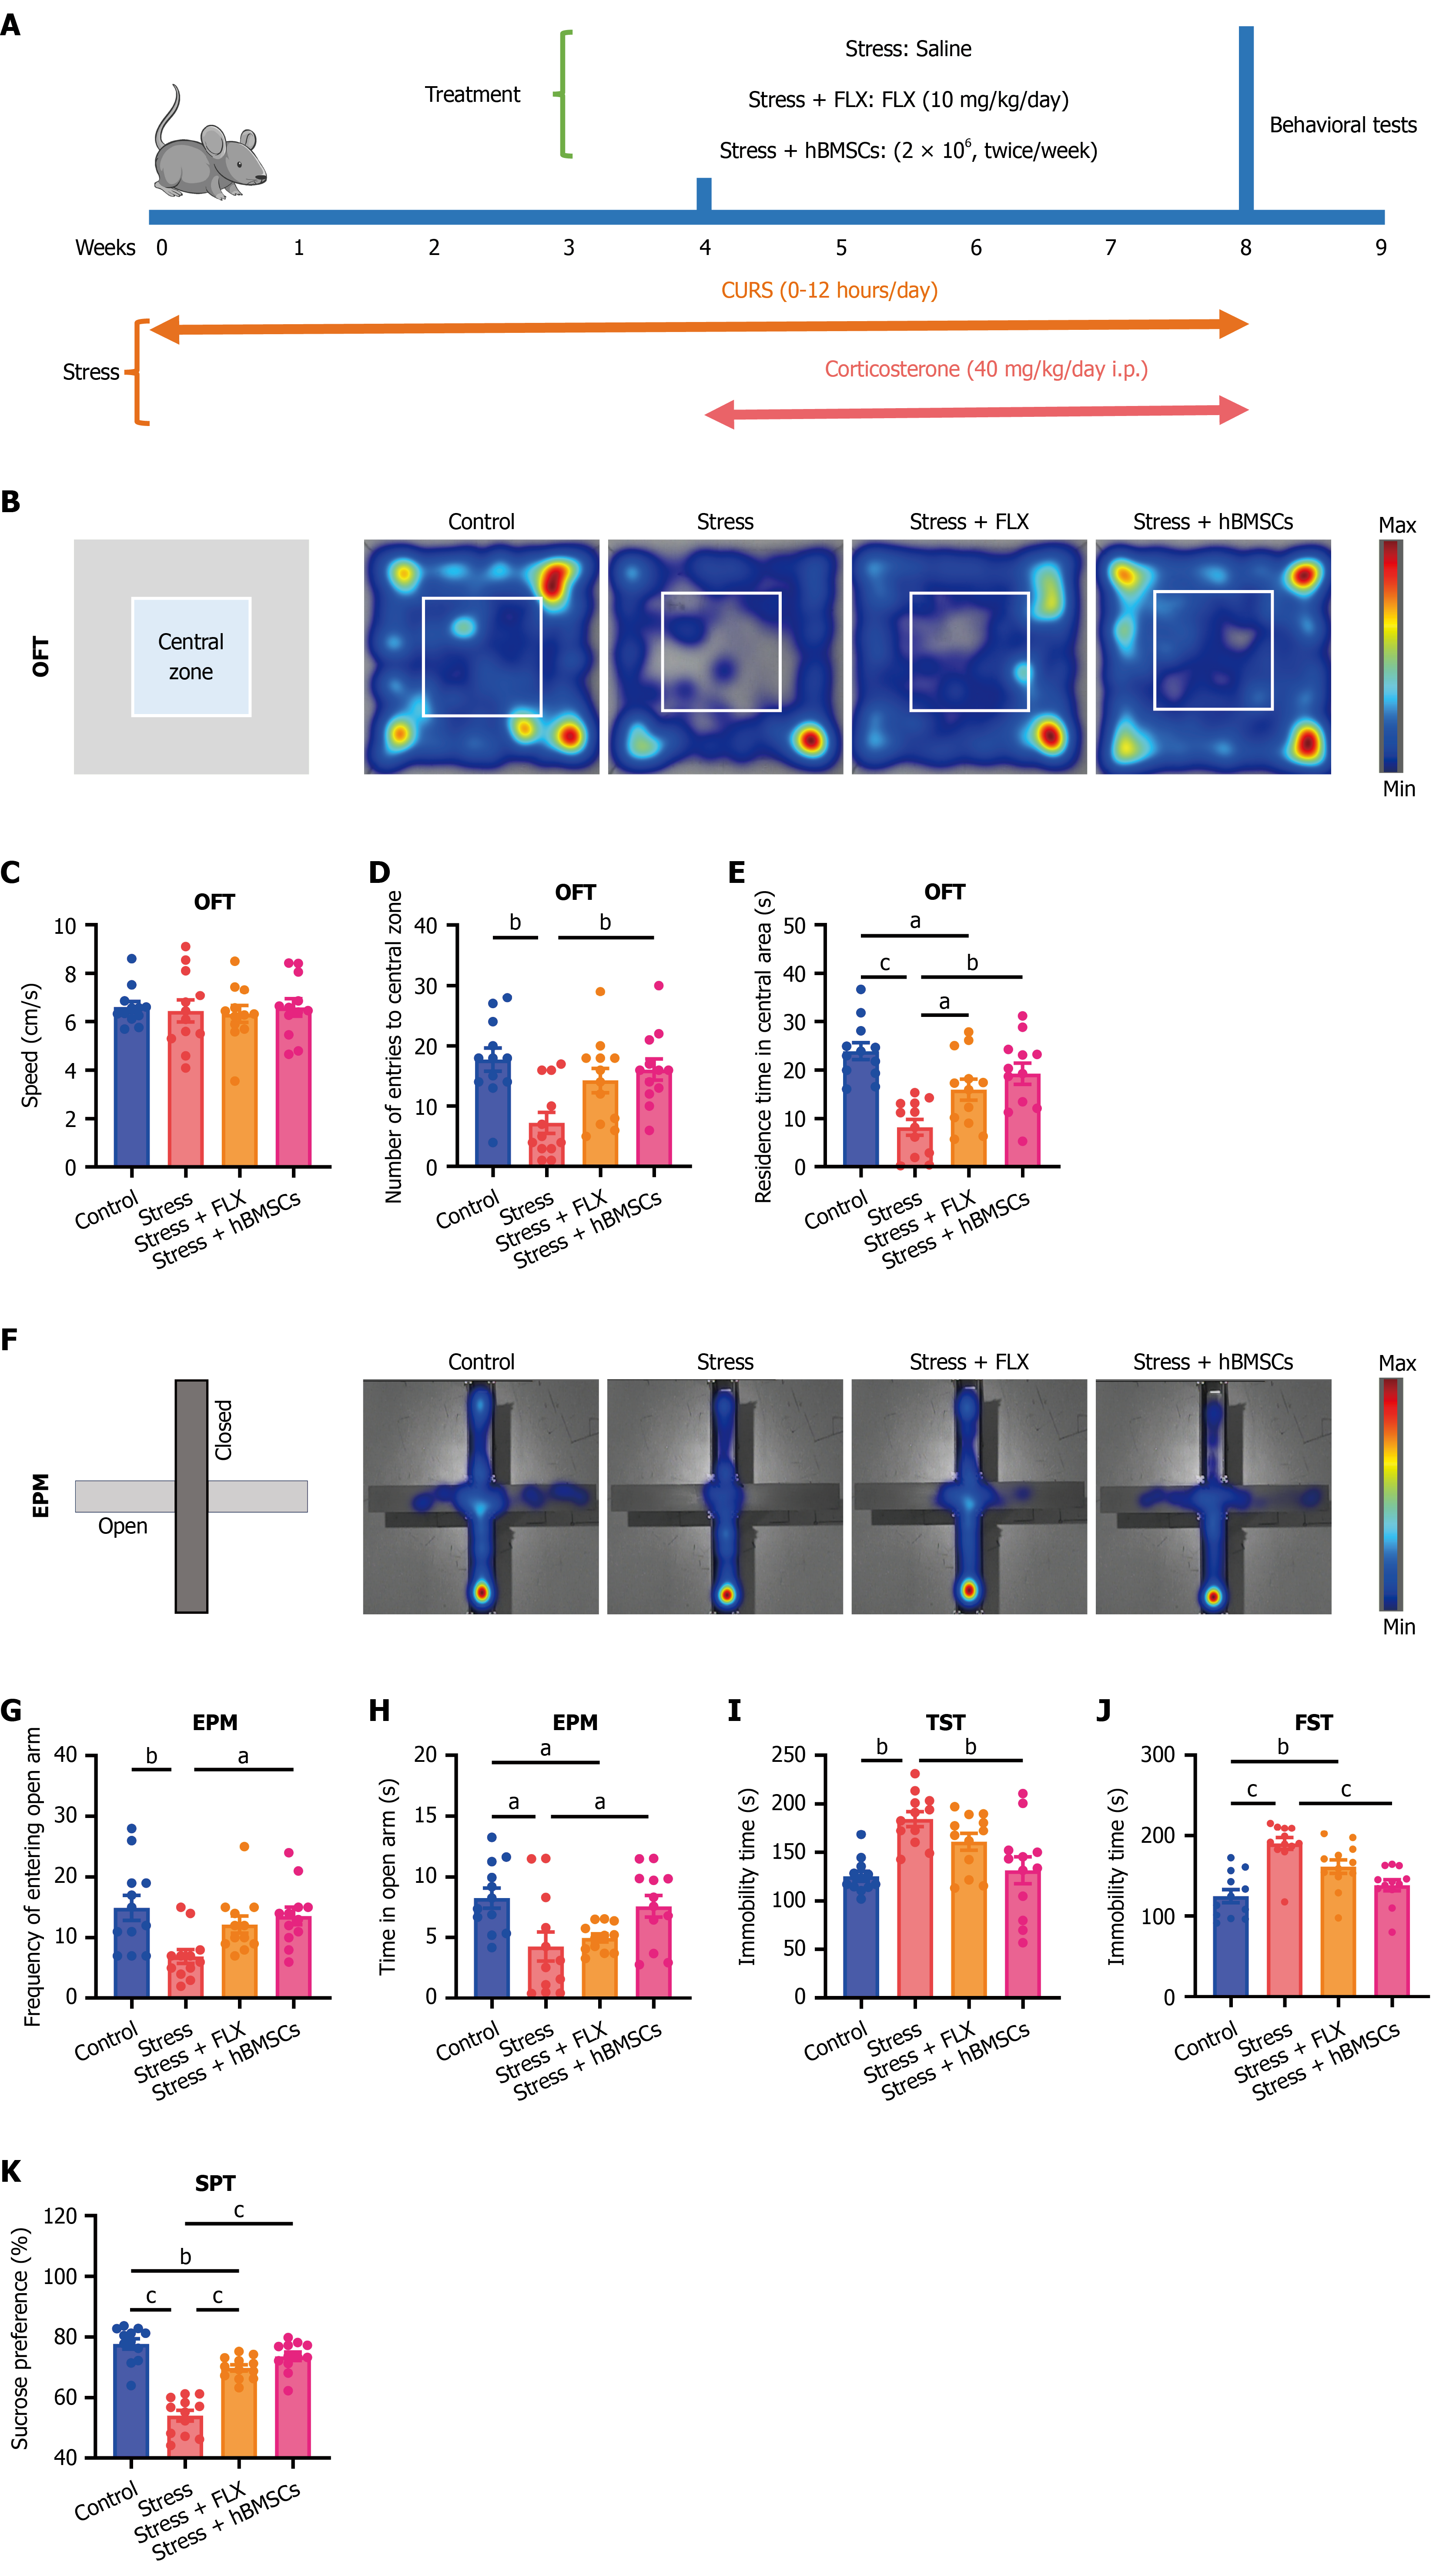
Figure 2 Human bone-marrow-derived mesenchymal stem cells ameliorated anxiety- and depression-like behaviors in stressed mice.
A: Animal experiment flowchart; B: Representative heatmaps of open field test (OFT); C: Speed in the OFT; D: Frequency of entries into the central zone; E: Residence time in the central area; F: Representative heatmaps of elevated plus maze test; G: Frequency of entries into the open arm; H: Residence time in the open arm; I: Immobility time in the tail suspension test; J: Immobility time in the forced swim test; K: The percentage of sucrose preference. aP < 0.05, bP < 0.01, cP < 0.001. Data were analyzed using one-way analysis of variance followed by Tukey’s multiple-comparisons test (mean ± SEM, n = 12 per group). FLX: Fluoxetine; hBMSCs: Human bone-marrow-derived mesenchymal stem cells; OFT: Open field test; EPM: Elevated plus maze; TST: Tail suspension test; FST: Forced swim test; SPT: Sucrose preference test.
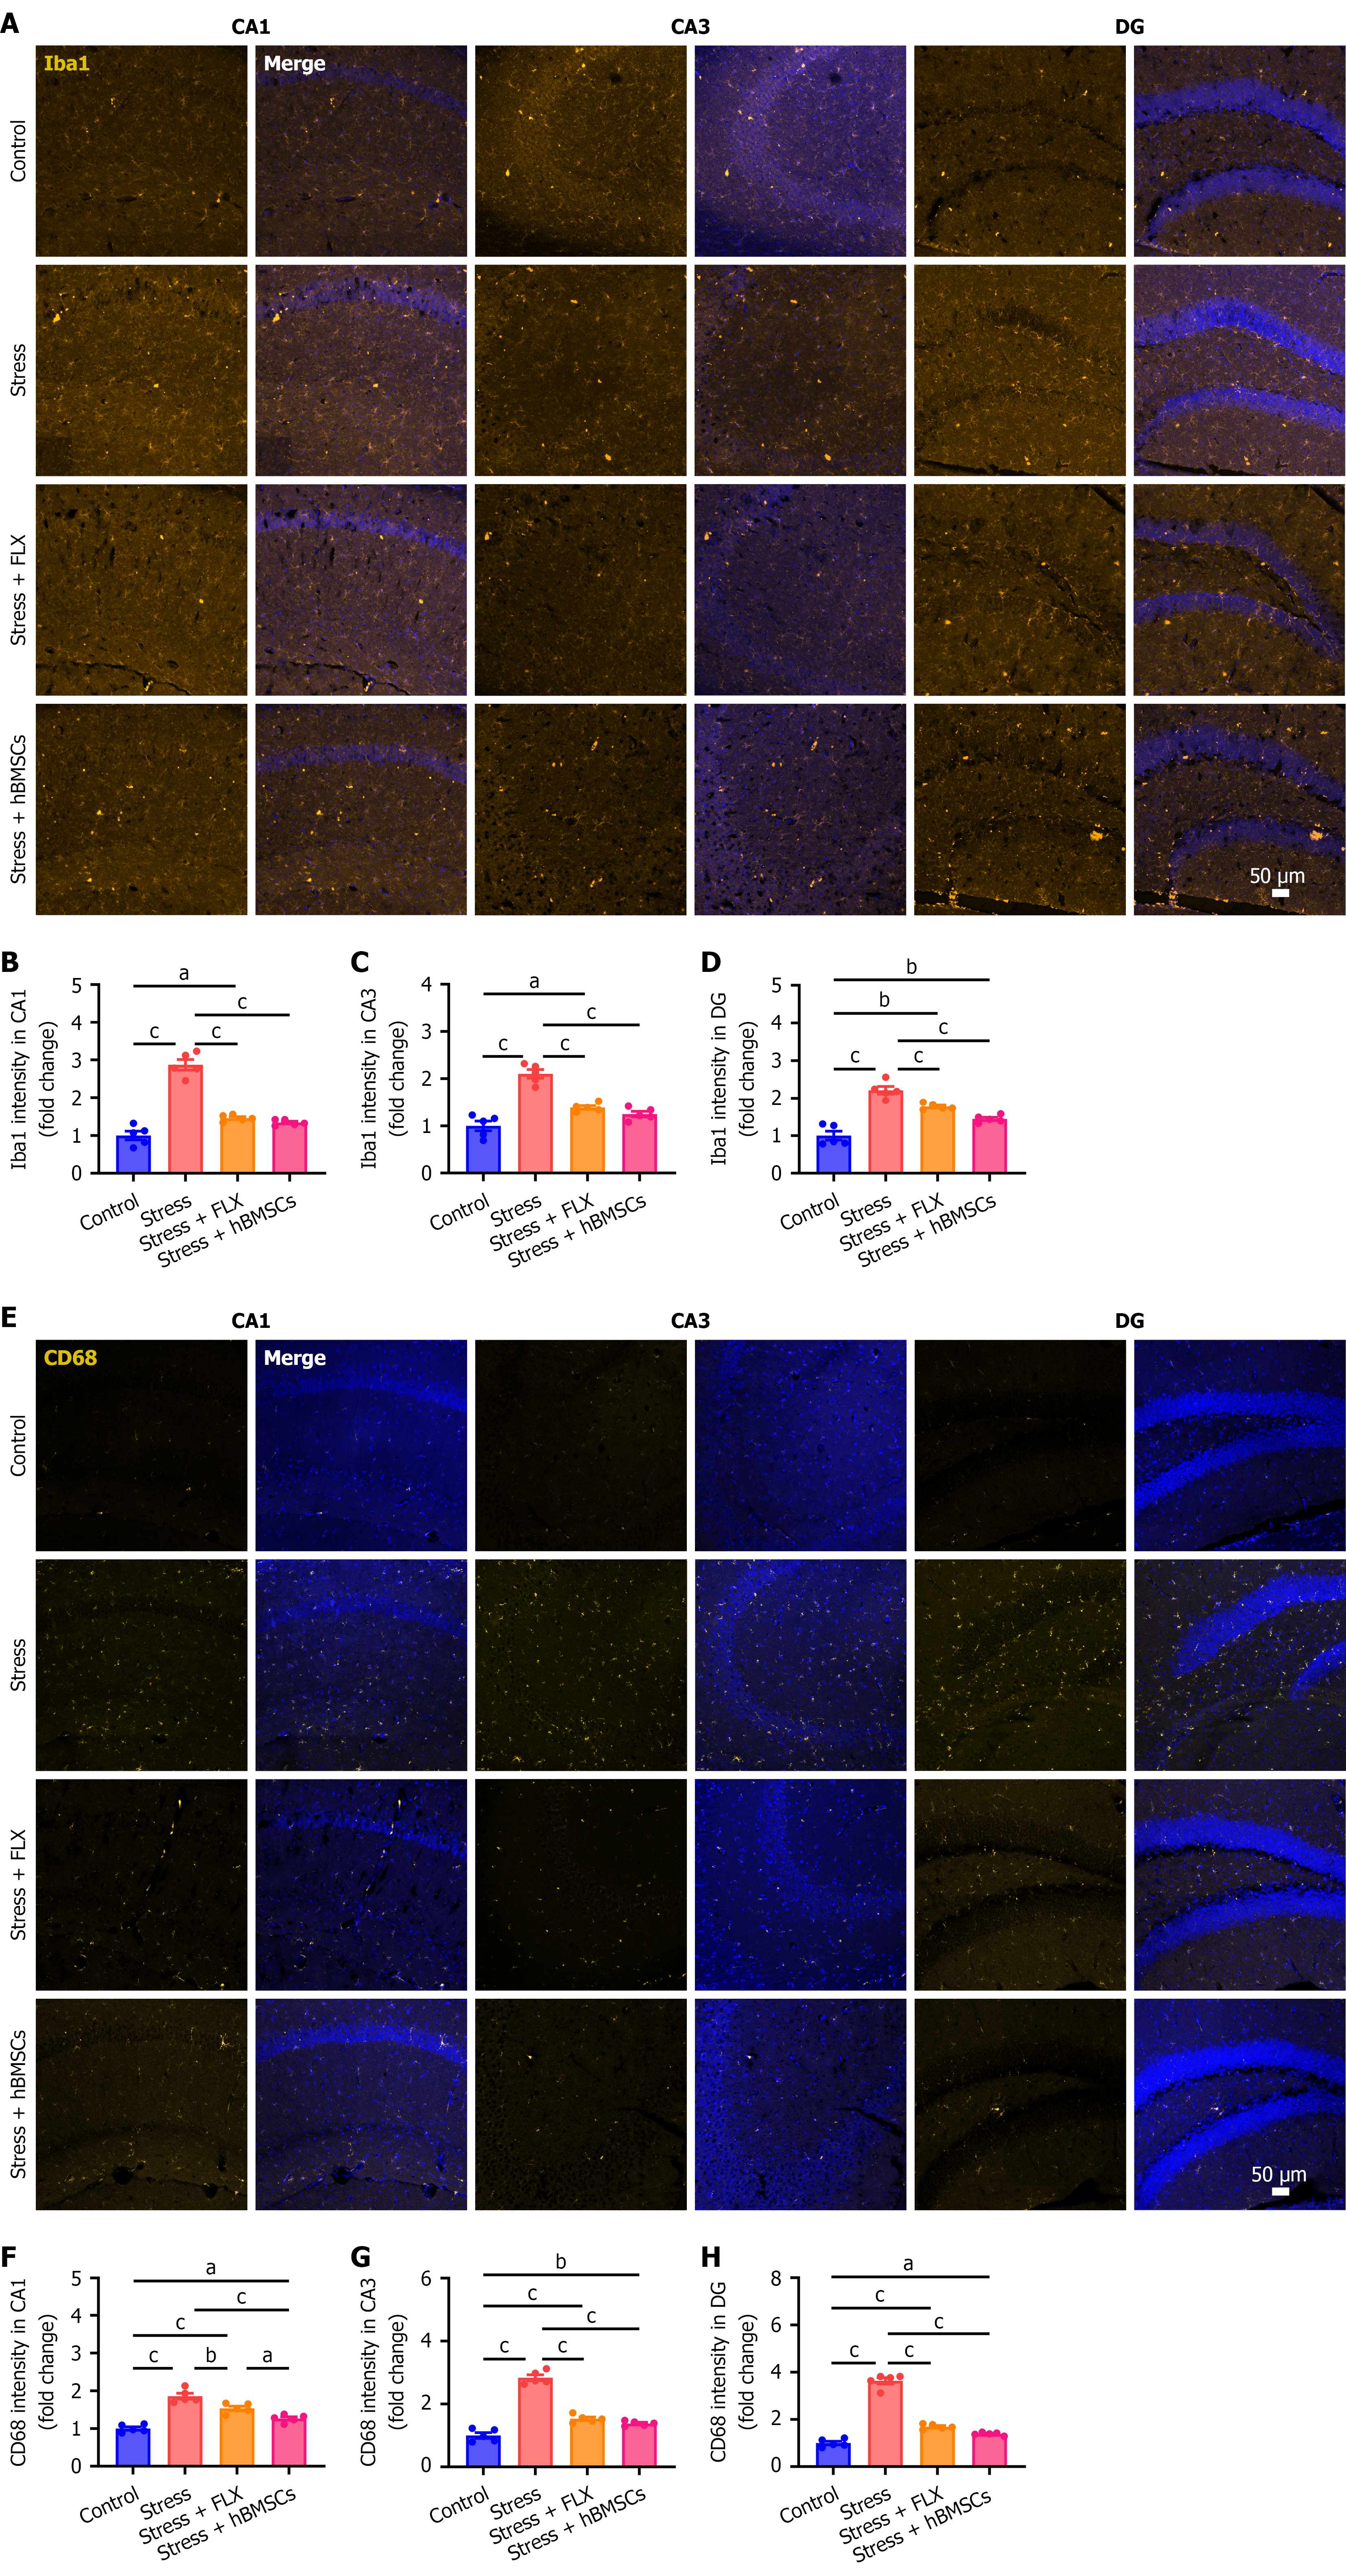
Figure 3 Human bone-marrow-derived mesenchymal stem cells suppressed microglial overactivation.
A: Representative immunofluorescence images of ionized calcium-binding adapter molecule (Iba)1 in the different subregions of the hippocampus; B-D: Quantification of relative fluorescence intensity of Iba1 in CA1 (B), CA3 (C), and dentate gyrus (DG) (D) regions; E: Representative immunofluorescence images of CD68 in the different subregions of the hippocampus: F-H: Quantification of relative fluorescence intensity of CD68 in CA1 (F), CA3 (G), and DG (H) regions. aP < 0.05, bP < 0.01, cP < 0.001. Data were analyzed using one-way analysis of variance followed by Tukey’s multiple-comparisons test (mean ± SEM, n = 5 per group). FLX: Fluoxetine; hBMSCs: Human bone-marrow-derived mesenchymal stem cells; DG: Dentate gyrus.
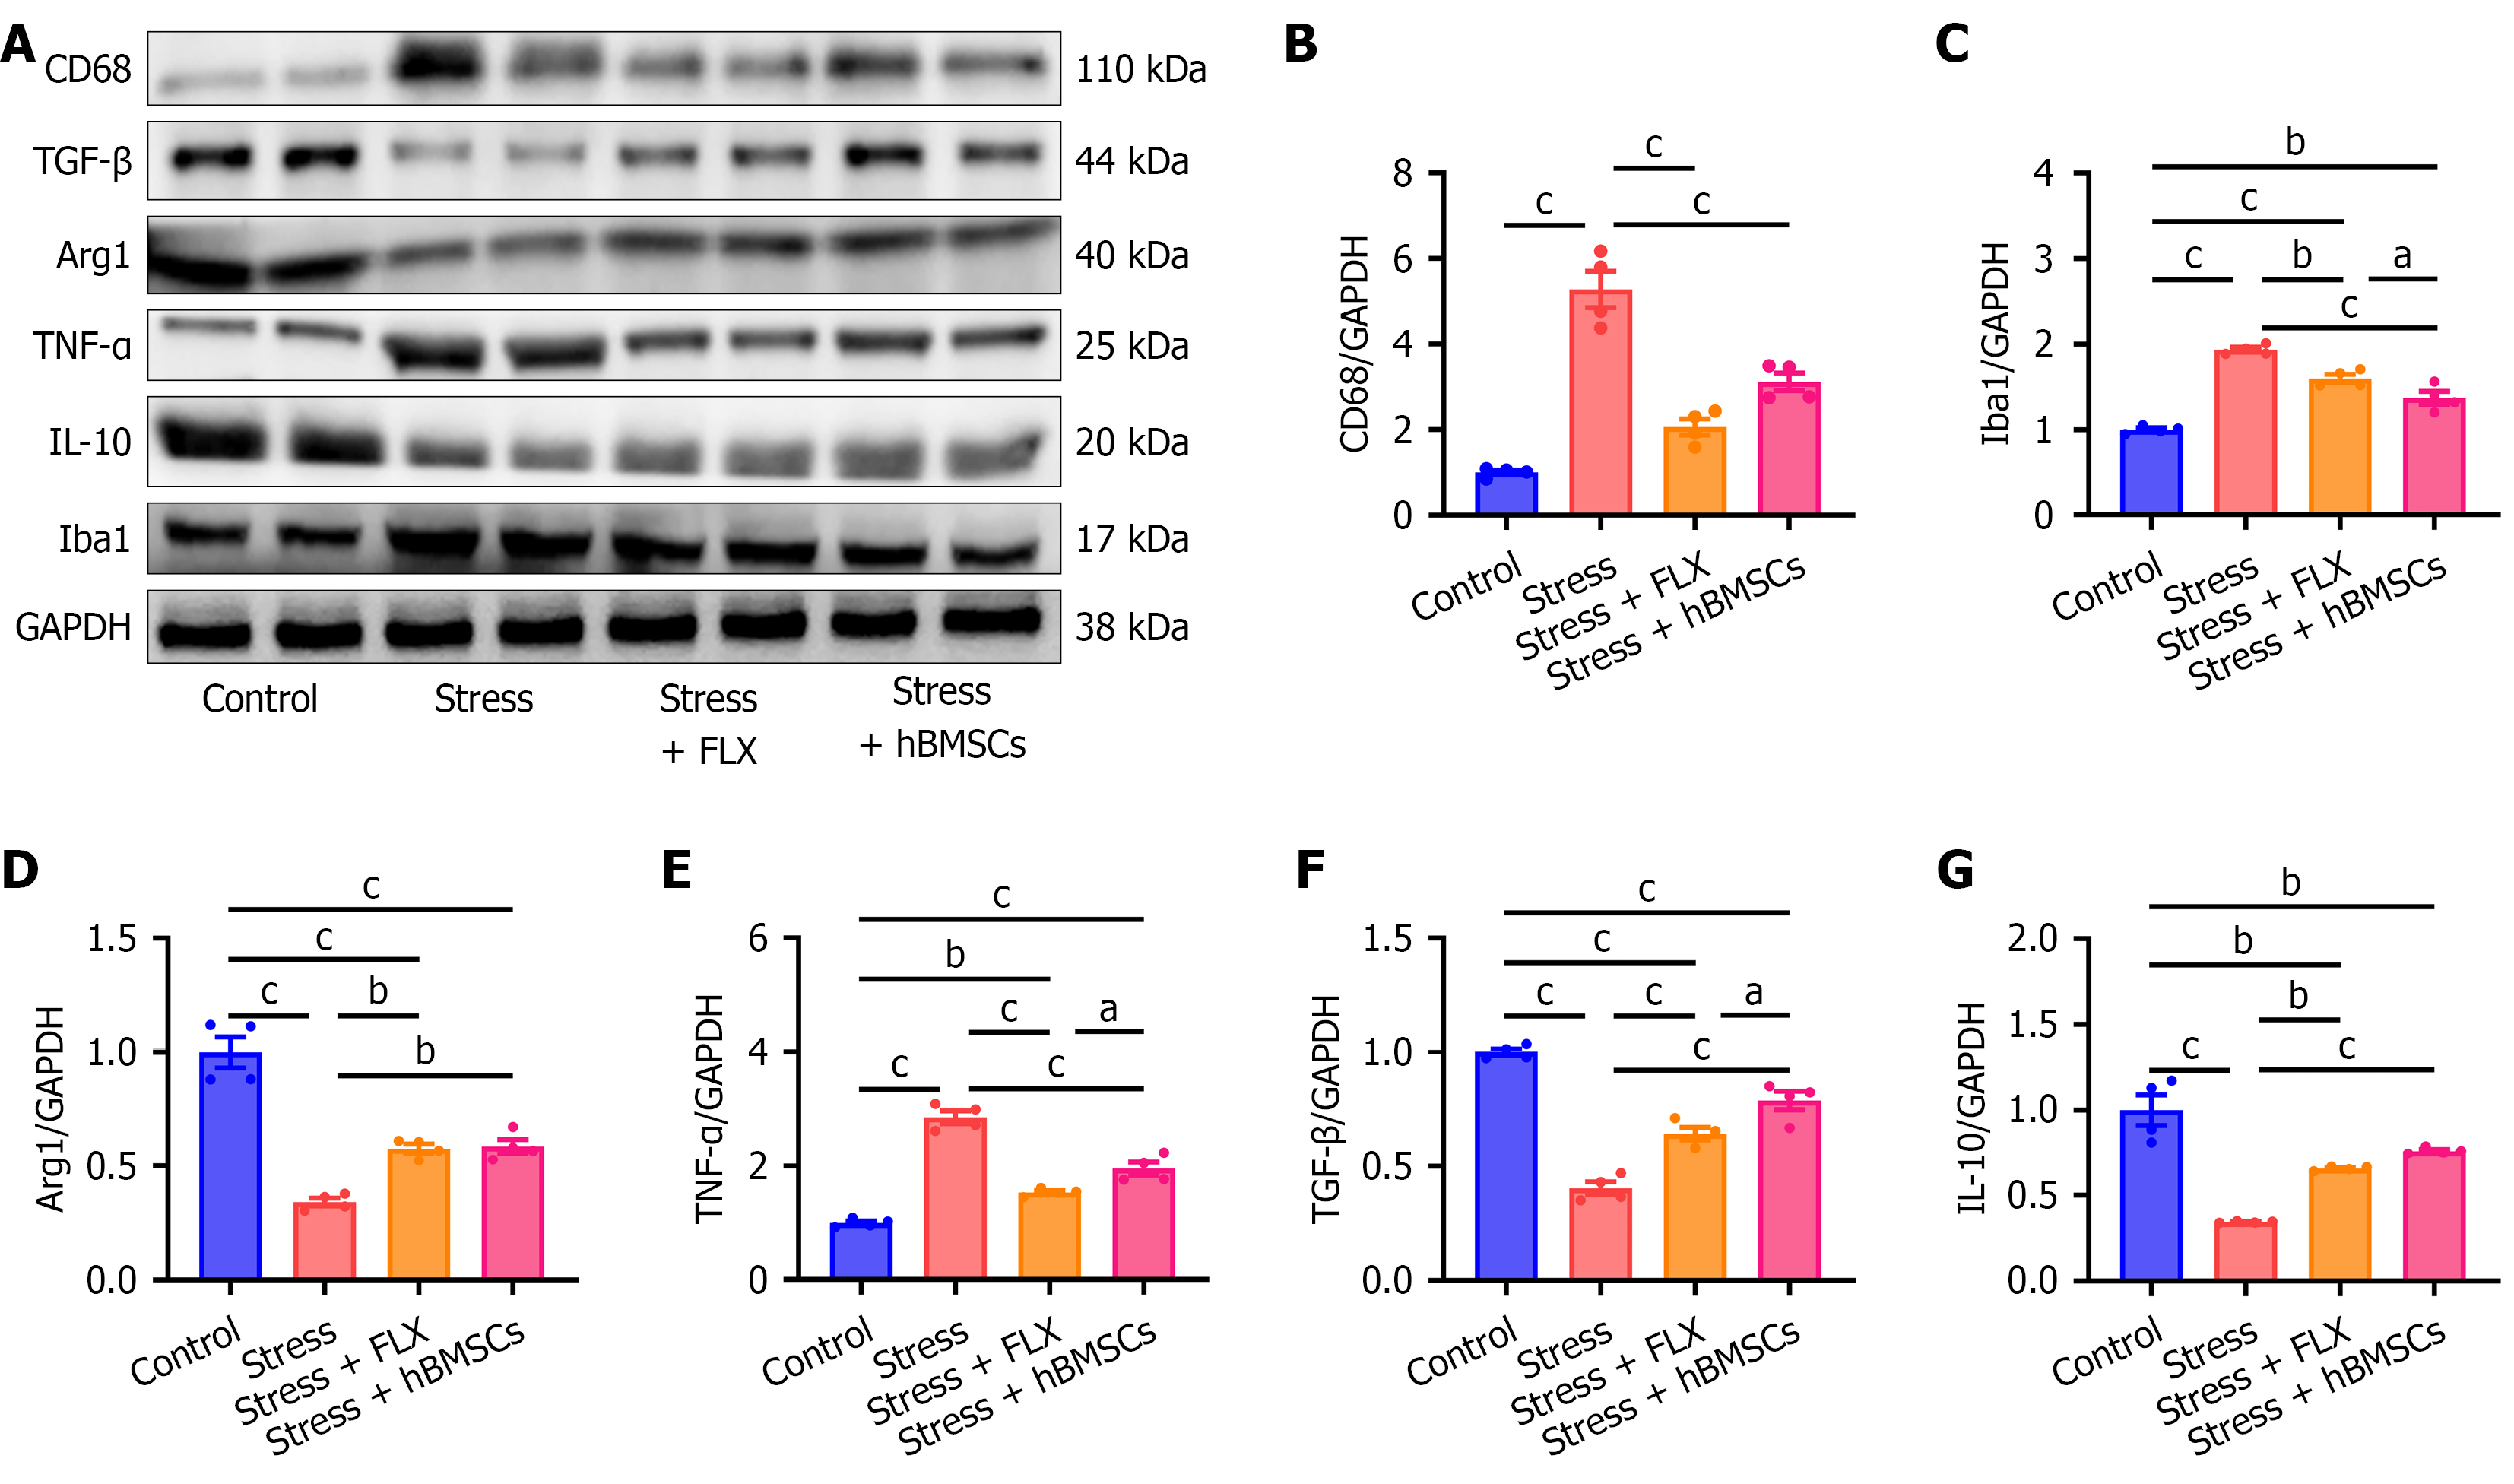
Figure 4 Human bone-marrow-derived mesenchymal stem cells alleviated hippocampal neuroinflammation in stressed mice.
A: Western blot plot of protein in the different groups; B-G: Relative expression levels of CD68 (B), ionized calcium-binding adapter molecule 1 (C), arginase 1 (D), tumor necrosis factor-α (E), transforming growth factor-β (F), interleukin-10 (G), and normalized to GAPDH. aP < 0.05, bP < 0.01, cP < 0.001. Data were analyzed using one-way analysis of variance followed by Tukey’s multiple-comparisons test (mean ± SEM, n = 4 per group). TGF: Transforming growth factor; Arg1: Arginase 1; TNF: Tumor necrosis factor; IL: Interleukin; Iba1: Ionized calcium-binding adapter molecule 1.
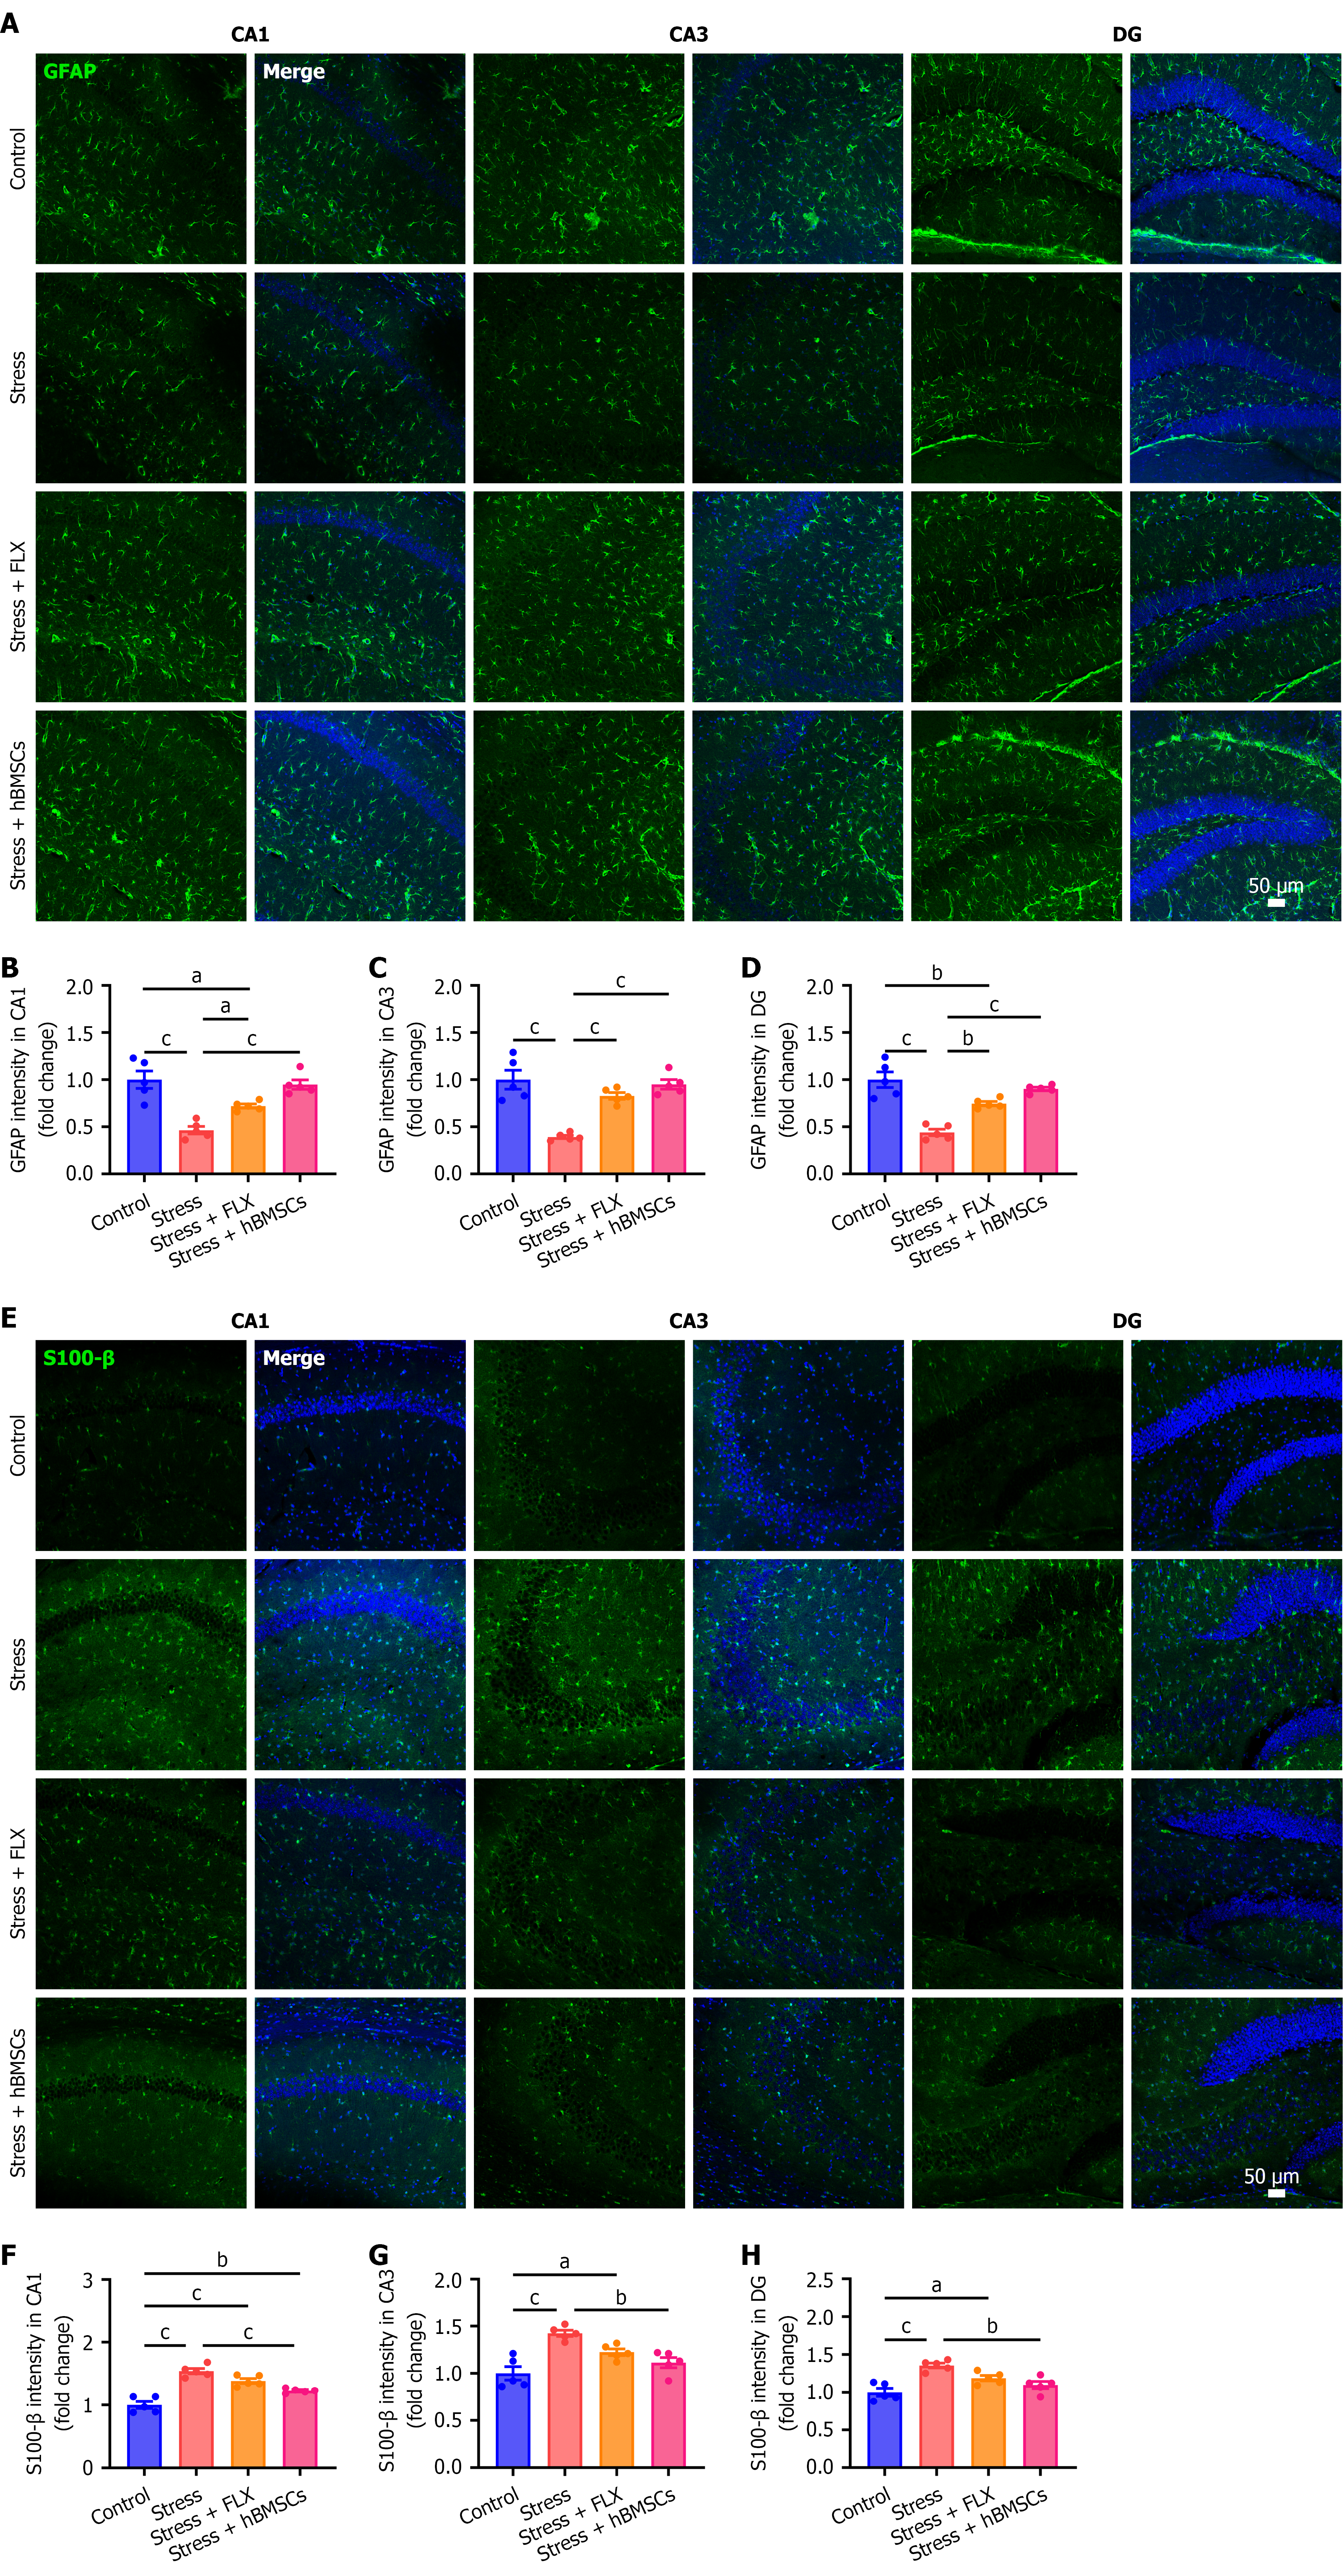
Figure 5 Human bone marrow-derived mesenchymal stem cells reduced the damage of hippocampal astrocytes in stressed mice.
A: Representative immunofluorescence images of glial fibrillary acidic protein (GFAP) in the different subregions of the hippocampus; B-D: Quantification of relative fluorescence intensity of GFAP in CA1 (B), CA3 (C), and dentate gyrus (DG) (D) regions; E: Representative immunofluorescence images of S100-β in the different subregions of the hippocampus; F-H: Quantification of relative fluorescence intensity of S100-β in CA1 (F), CA3 (G), and DG (H) regions. aP < 0.05, bP < 0.01, cP < 0.001. Data were analyzed using one-way analysis of variance followed by Tukey’s multiple-comparisons test (mean ± SEM, n = 5 per group). GFAP: Glial fibrillary acidic protein; FLX: Fluoxetine; hBMSCs: Human bone-marrow-derived mesenchymal stem cells; DG: Dentate gyrus.
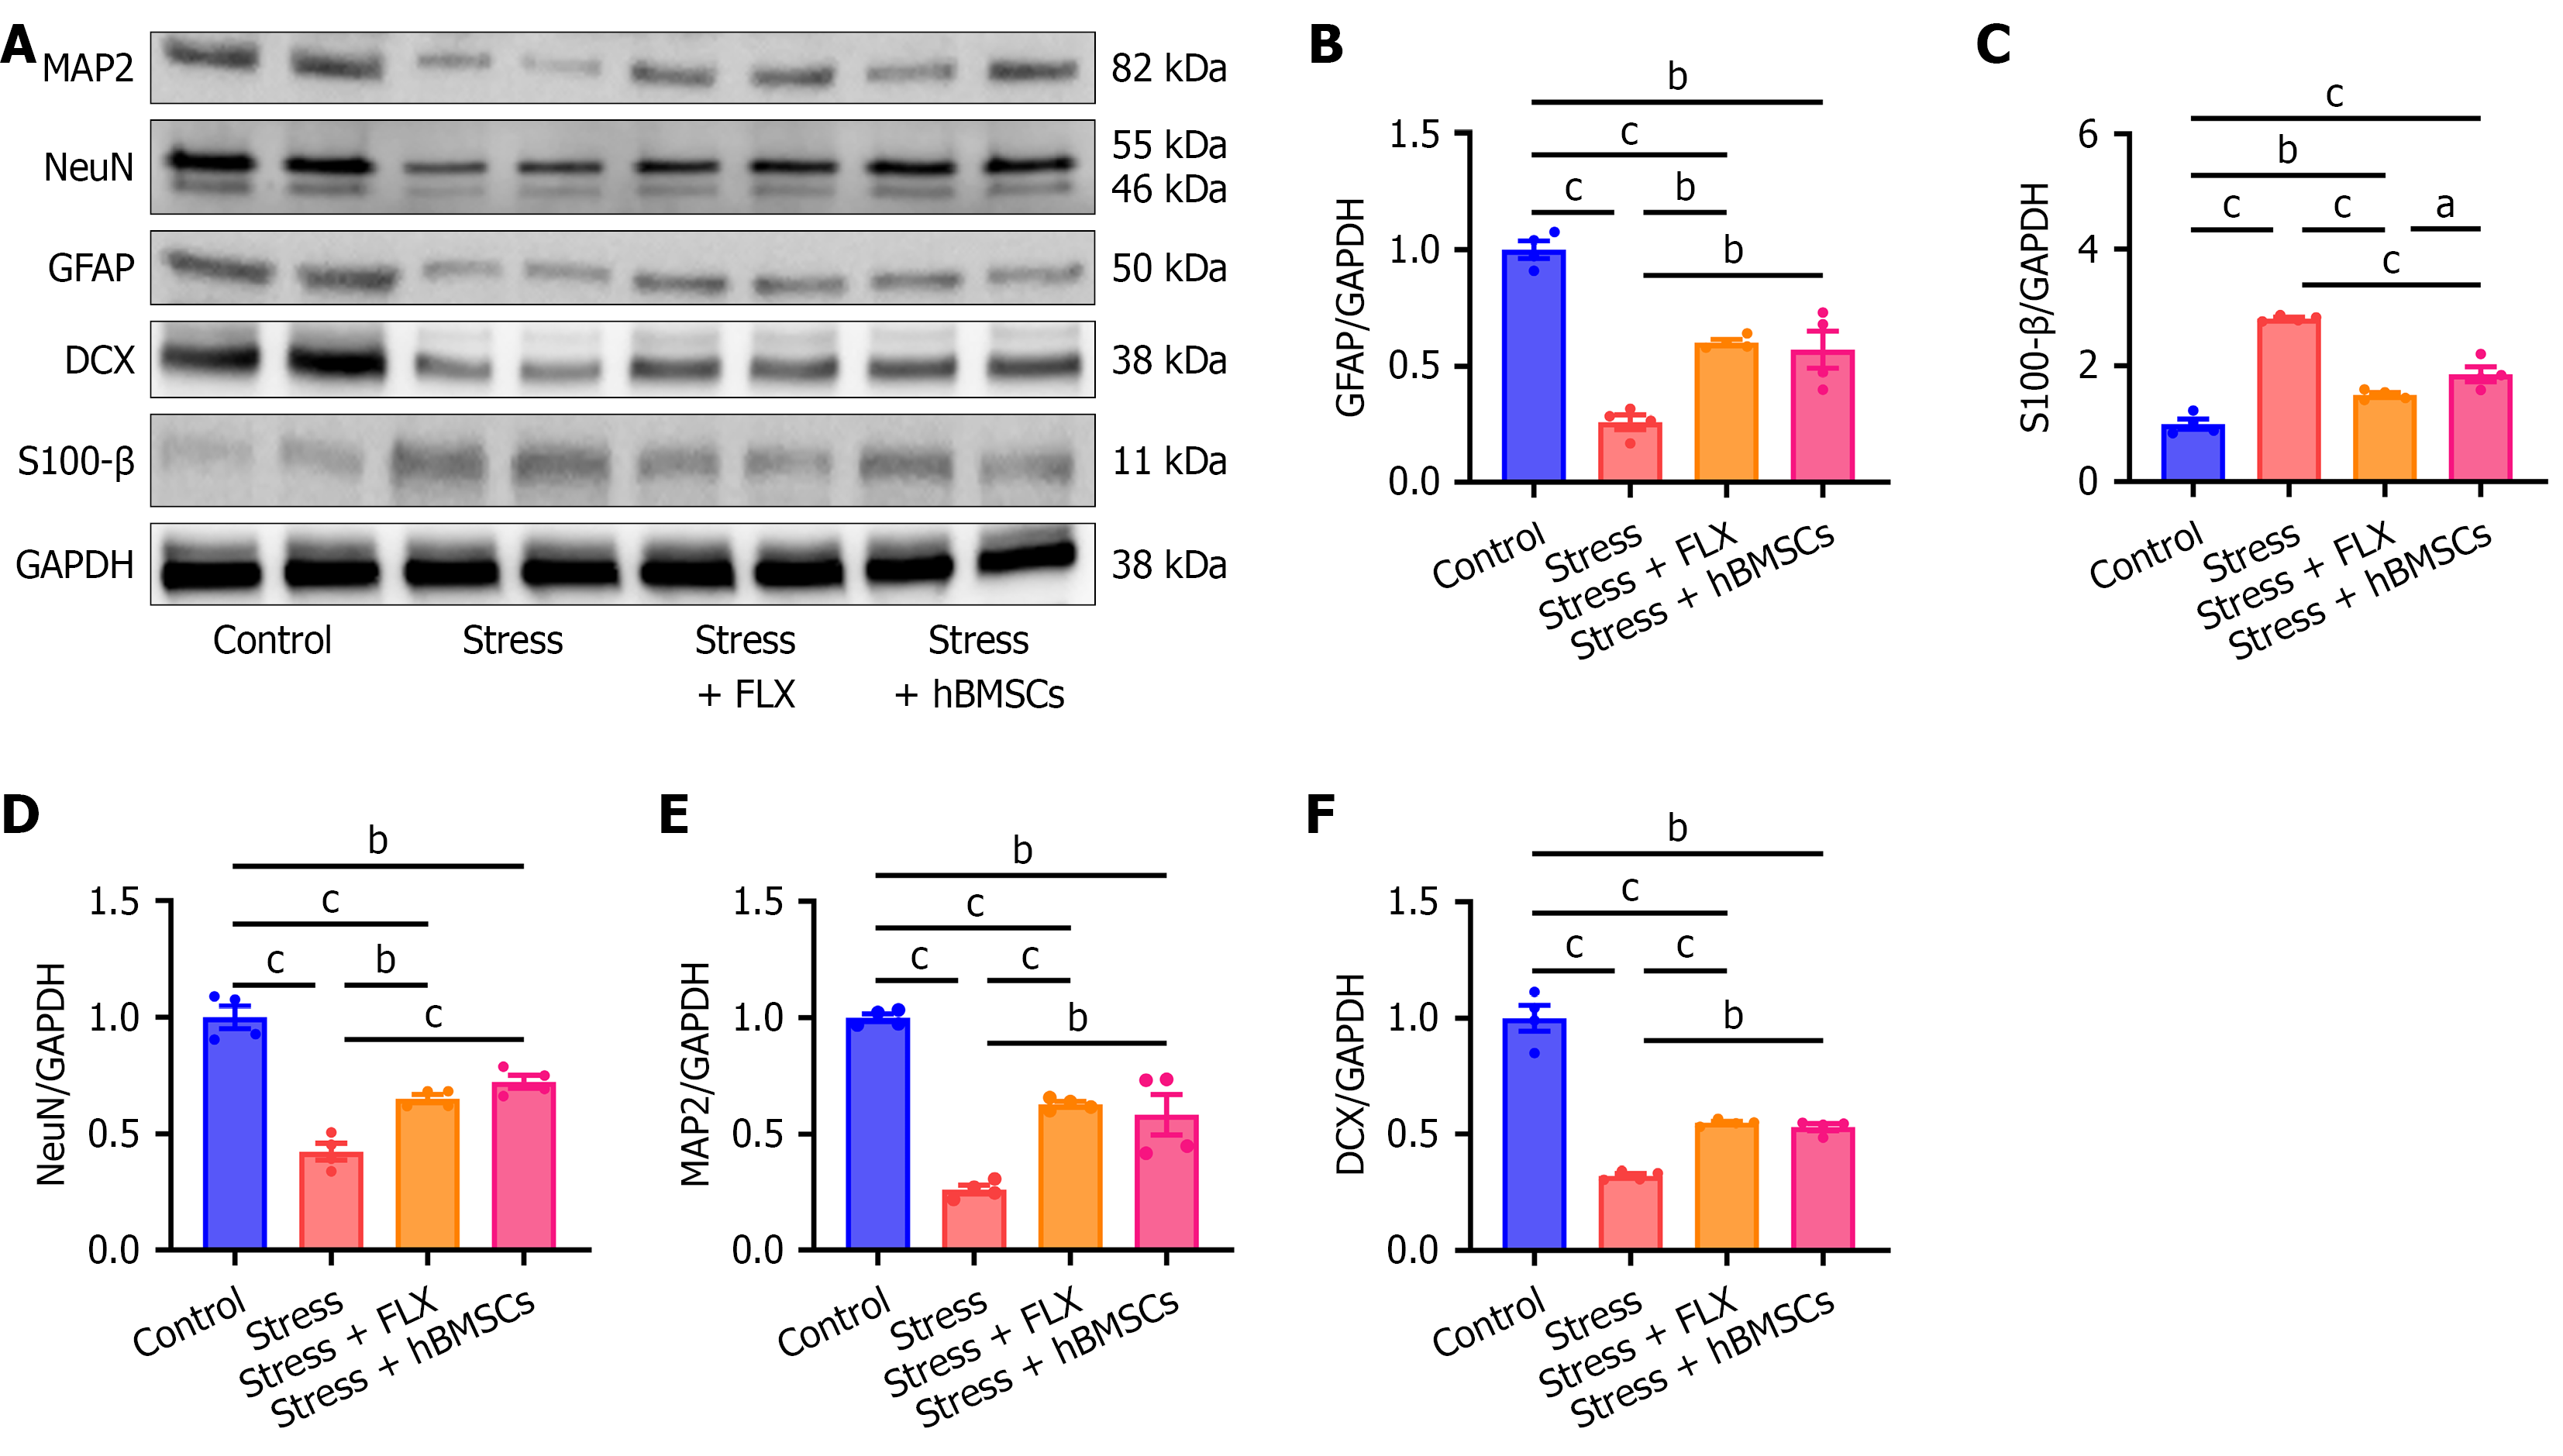
Figure 6 Human bone marrow-derived mesenchymal stem cells improved hippocampal function in stressed mice.
A: Western blot plot of protein in the different groups; B-F: Relative expression levels of glial fibrillary acidic protein (B), S100-β (C), NeuN (D), MAP2 (E), and DCX (F) normalized to GAPDH. aP < 0.05, bP < 0.01, cP < 0.001. Data were analyzed using one-way analysis of variance followed by Tukey’s multiple-comparisons test (mean ± SEM, n = 4 per group). GFAP: Glial fibrillary acidic protein; FLX: Fluoxetine; hBMSCs: Human bone-marrow-derived mesenchymal stem cells.
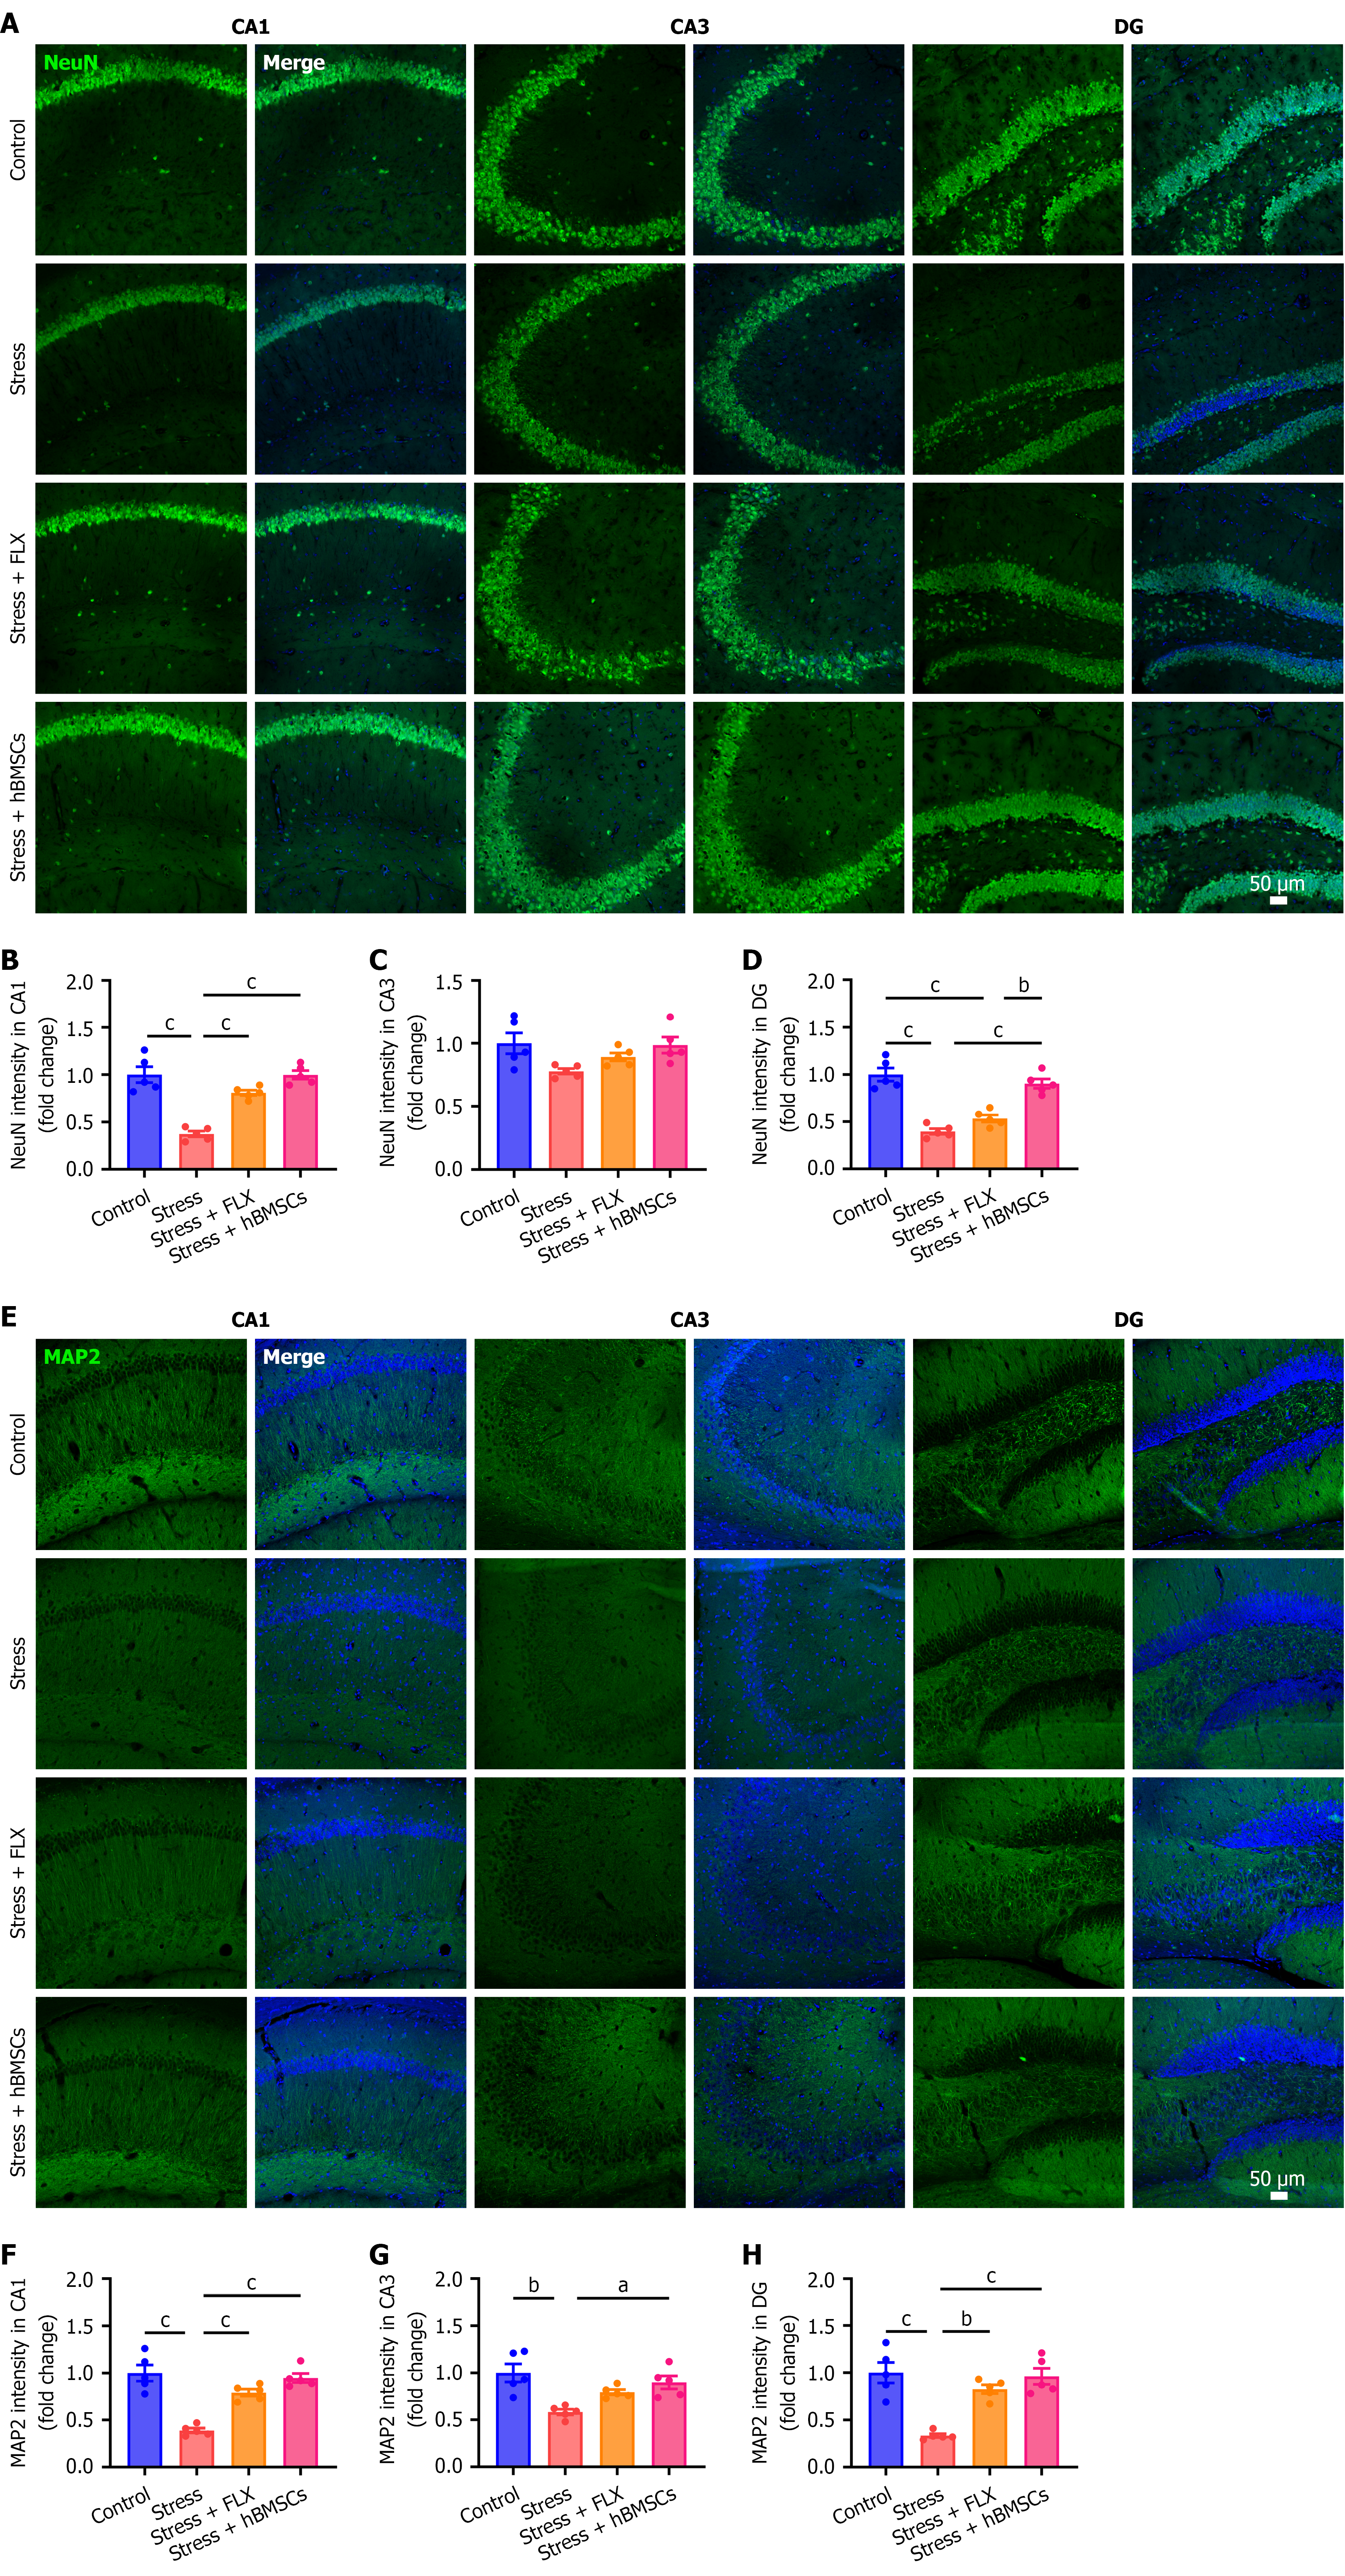
Figure 7 Human bone-marrow-derived mesenchymal stem cells exerted neuroprotective effects on the hippocampus of stressed mice.
A: Representative immunofluorescence images of NeuN in the different subregions of the hippocampus; B-D: Quantification of relative fluorescence intensity of NeuN in CA1 (B), CA3 (C), and dentate gyrus (DG) (D) regions; E: Representative immunofluorescence images of MAP2 in the different subregions of the hippocampus; F-H: Quantification of relative fluorescence intensity of MAP2 in CA1 (F), CA3 (G), and DG (H) regions. aP < 0.05, bP < 0.01, cP < 0.001. Data were analyzed using one-way analysis of variance followed by Tukey’s multiple-comparisons test (mean ± SEM, n = 5 per group). FLX: Fluoxetine; hBMSCs: Human bone-marrow-derived mesenchymal stem cells; DG: Dentate gyrus.
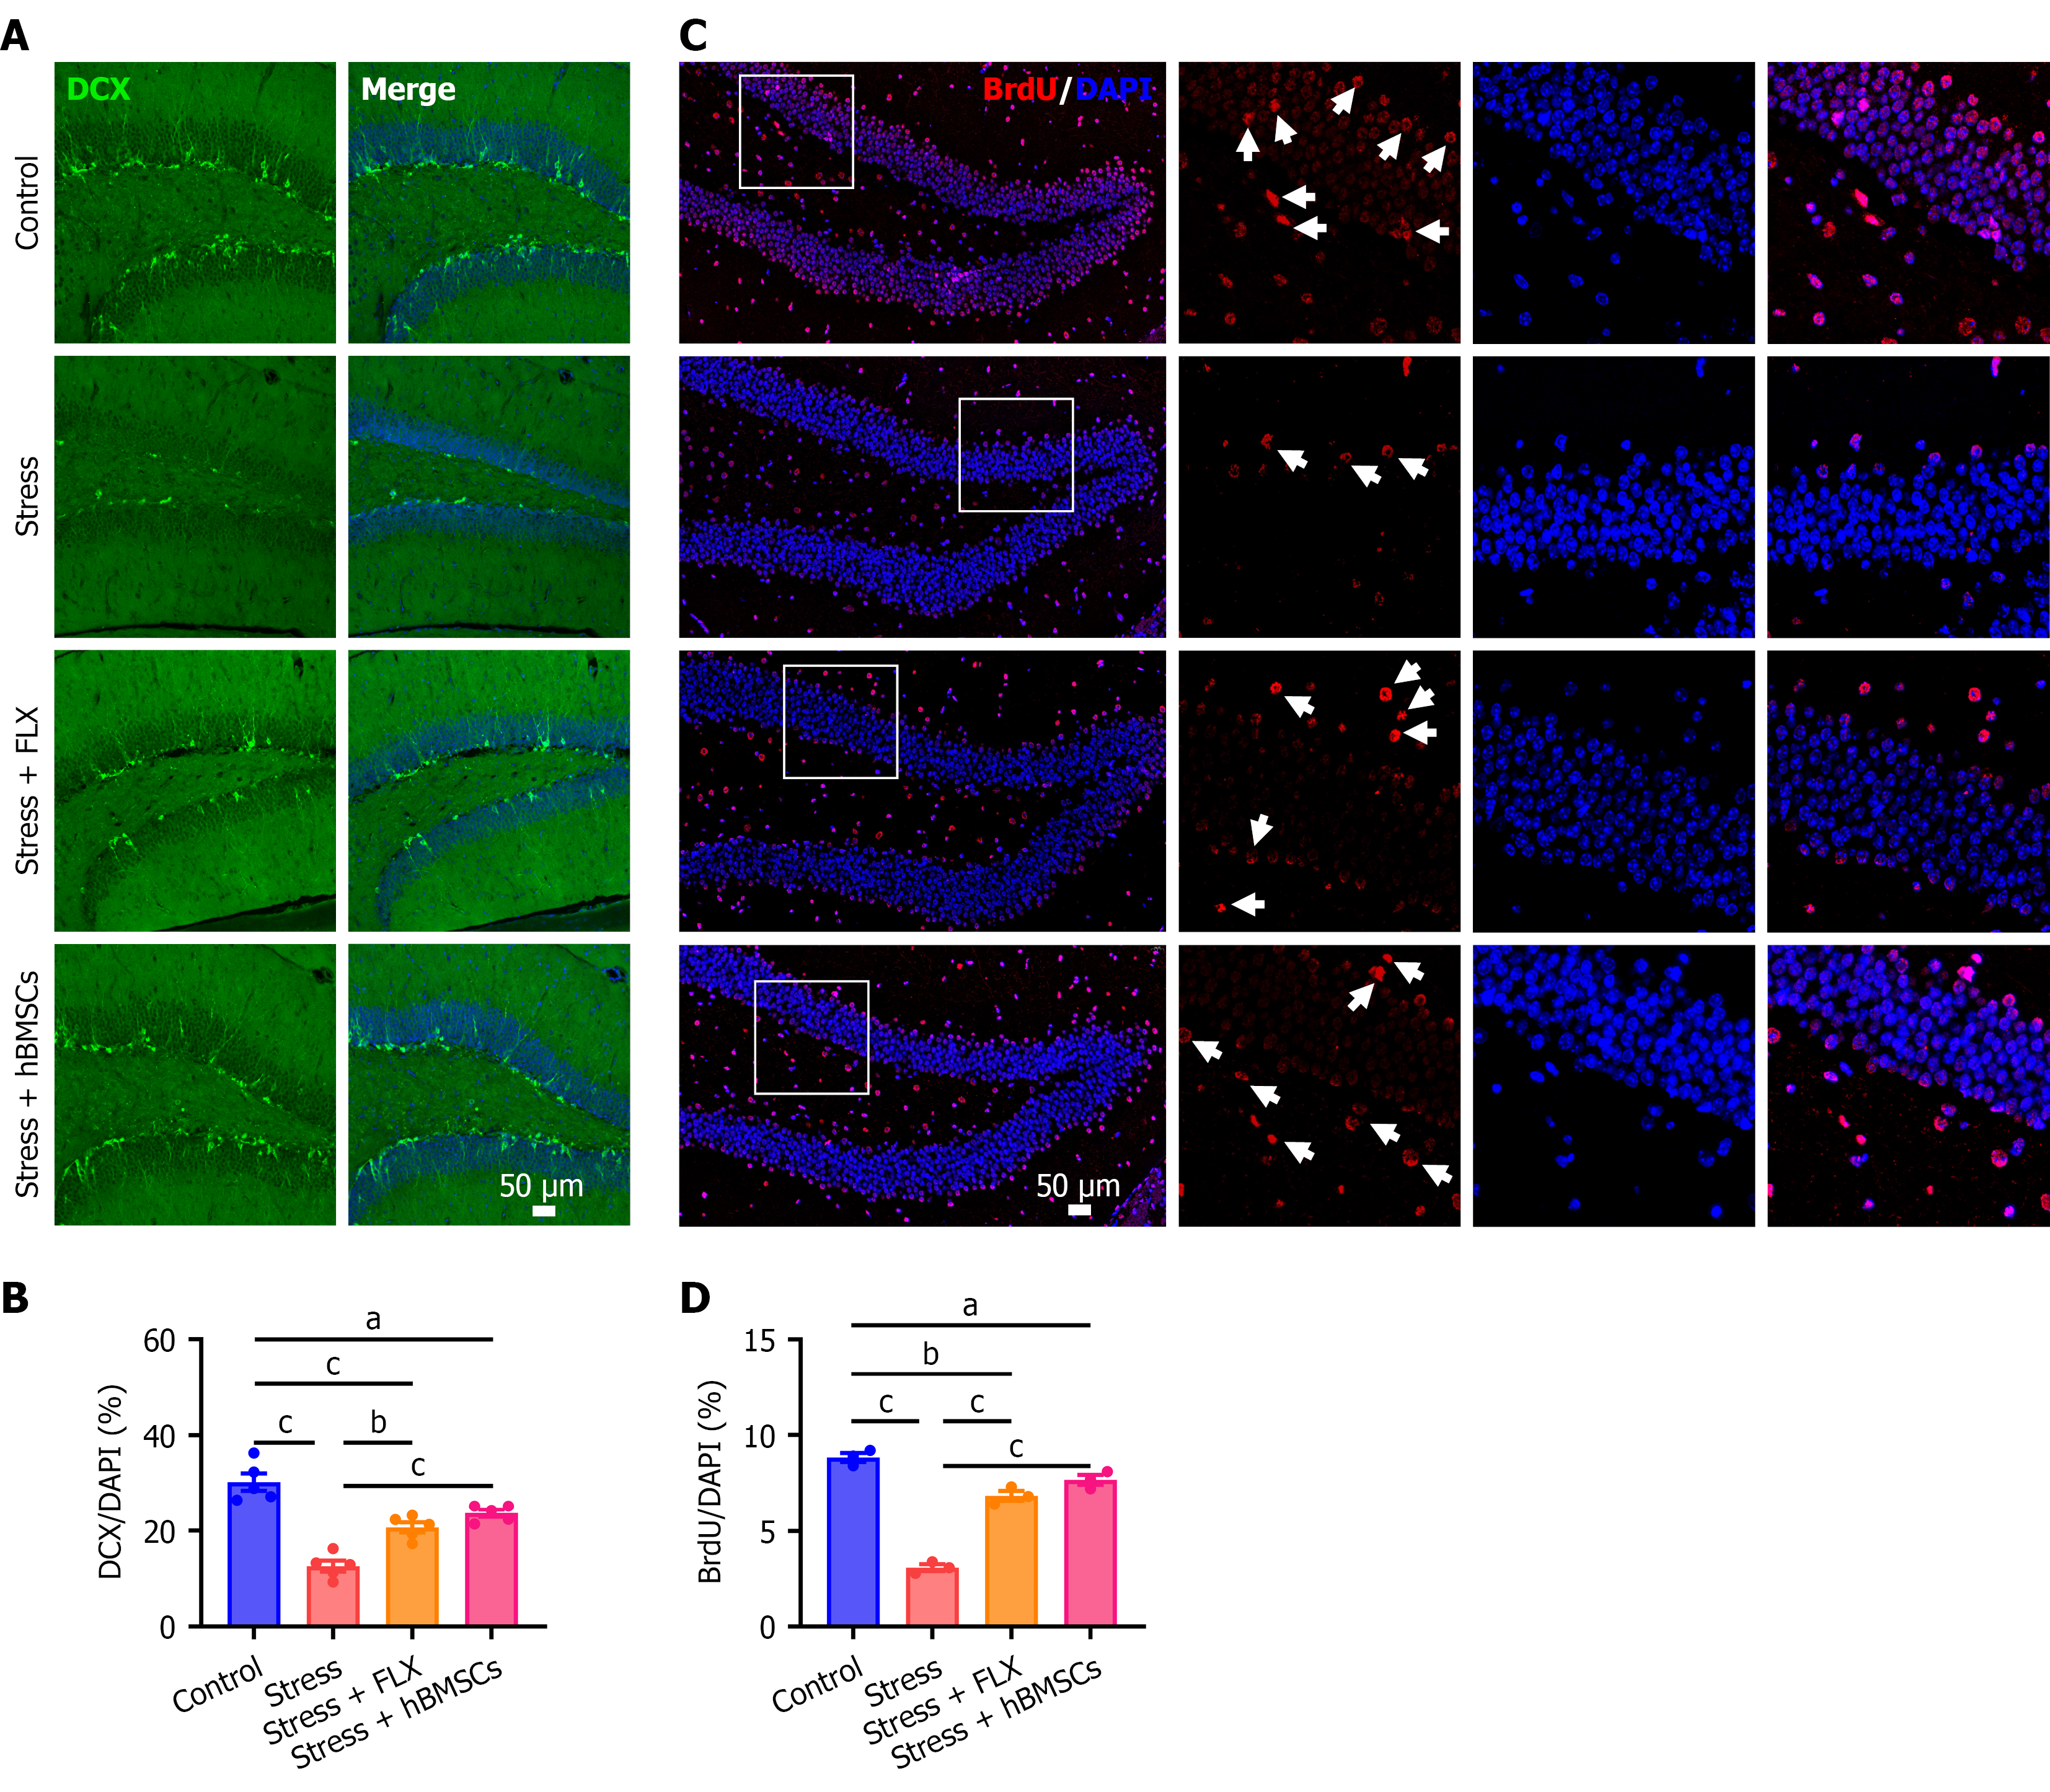
Figure 8 Human bone marrow-derived mesenchymal stem cells promoted the proliferation of newborn hippocampal neurons in stressed mice.
A: Representative immunofluorescence images of DCX in the dentate gyrus (DG) region of the hippocampus; B: Quantification of DCX in the DG region; C: Representative immunofluorescence images of BrdU in the DG region of the hippocampus; D: Quantification of BrdU in the DG region. aP < 0.05, bP < 0.01, cP < 0.001. Data were analyzed using one-way analysis of variance followed by Tukey’s multiple-comparisons test (mean ± SEM, n = 5 per group for B, n = 3 per group for D). FLX: Fluoxetine; hBMSCs: Human bone-marrow-derived mesenchymal stem cells.
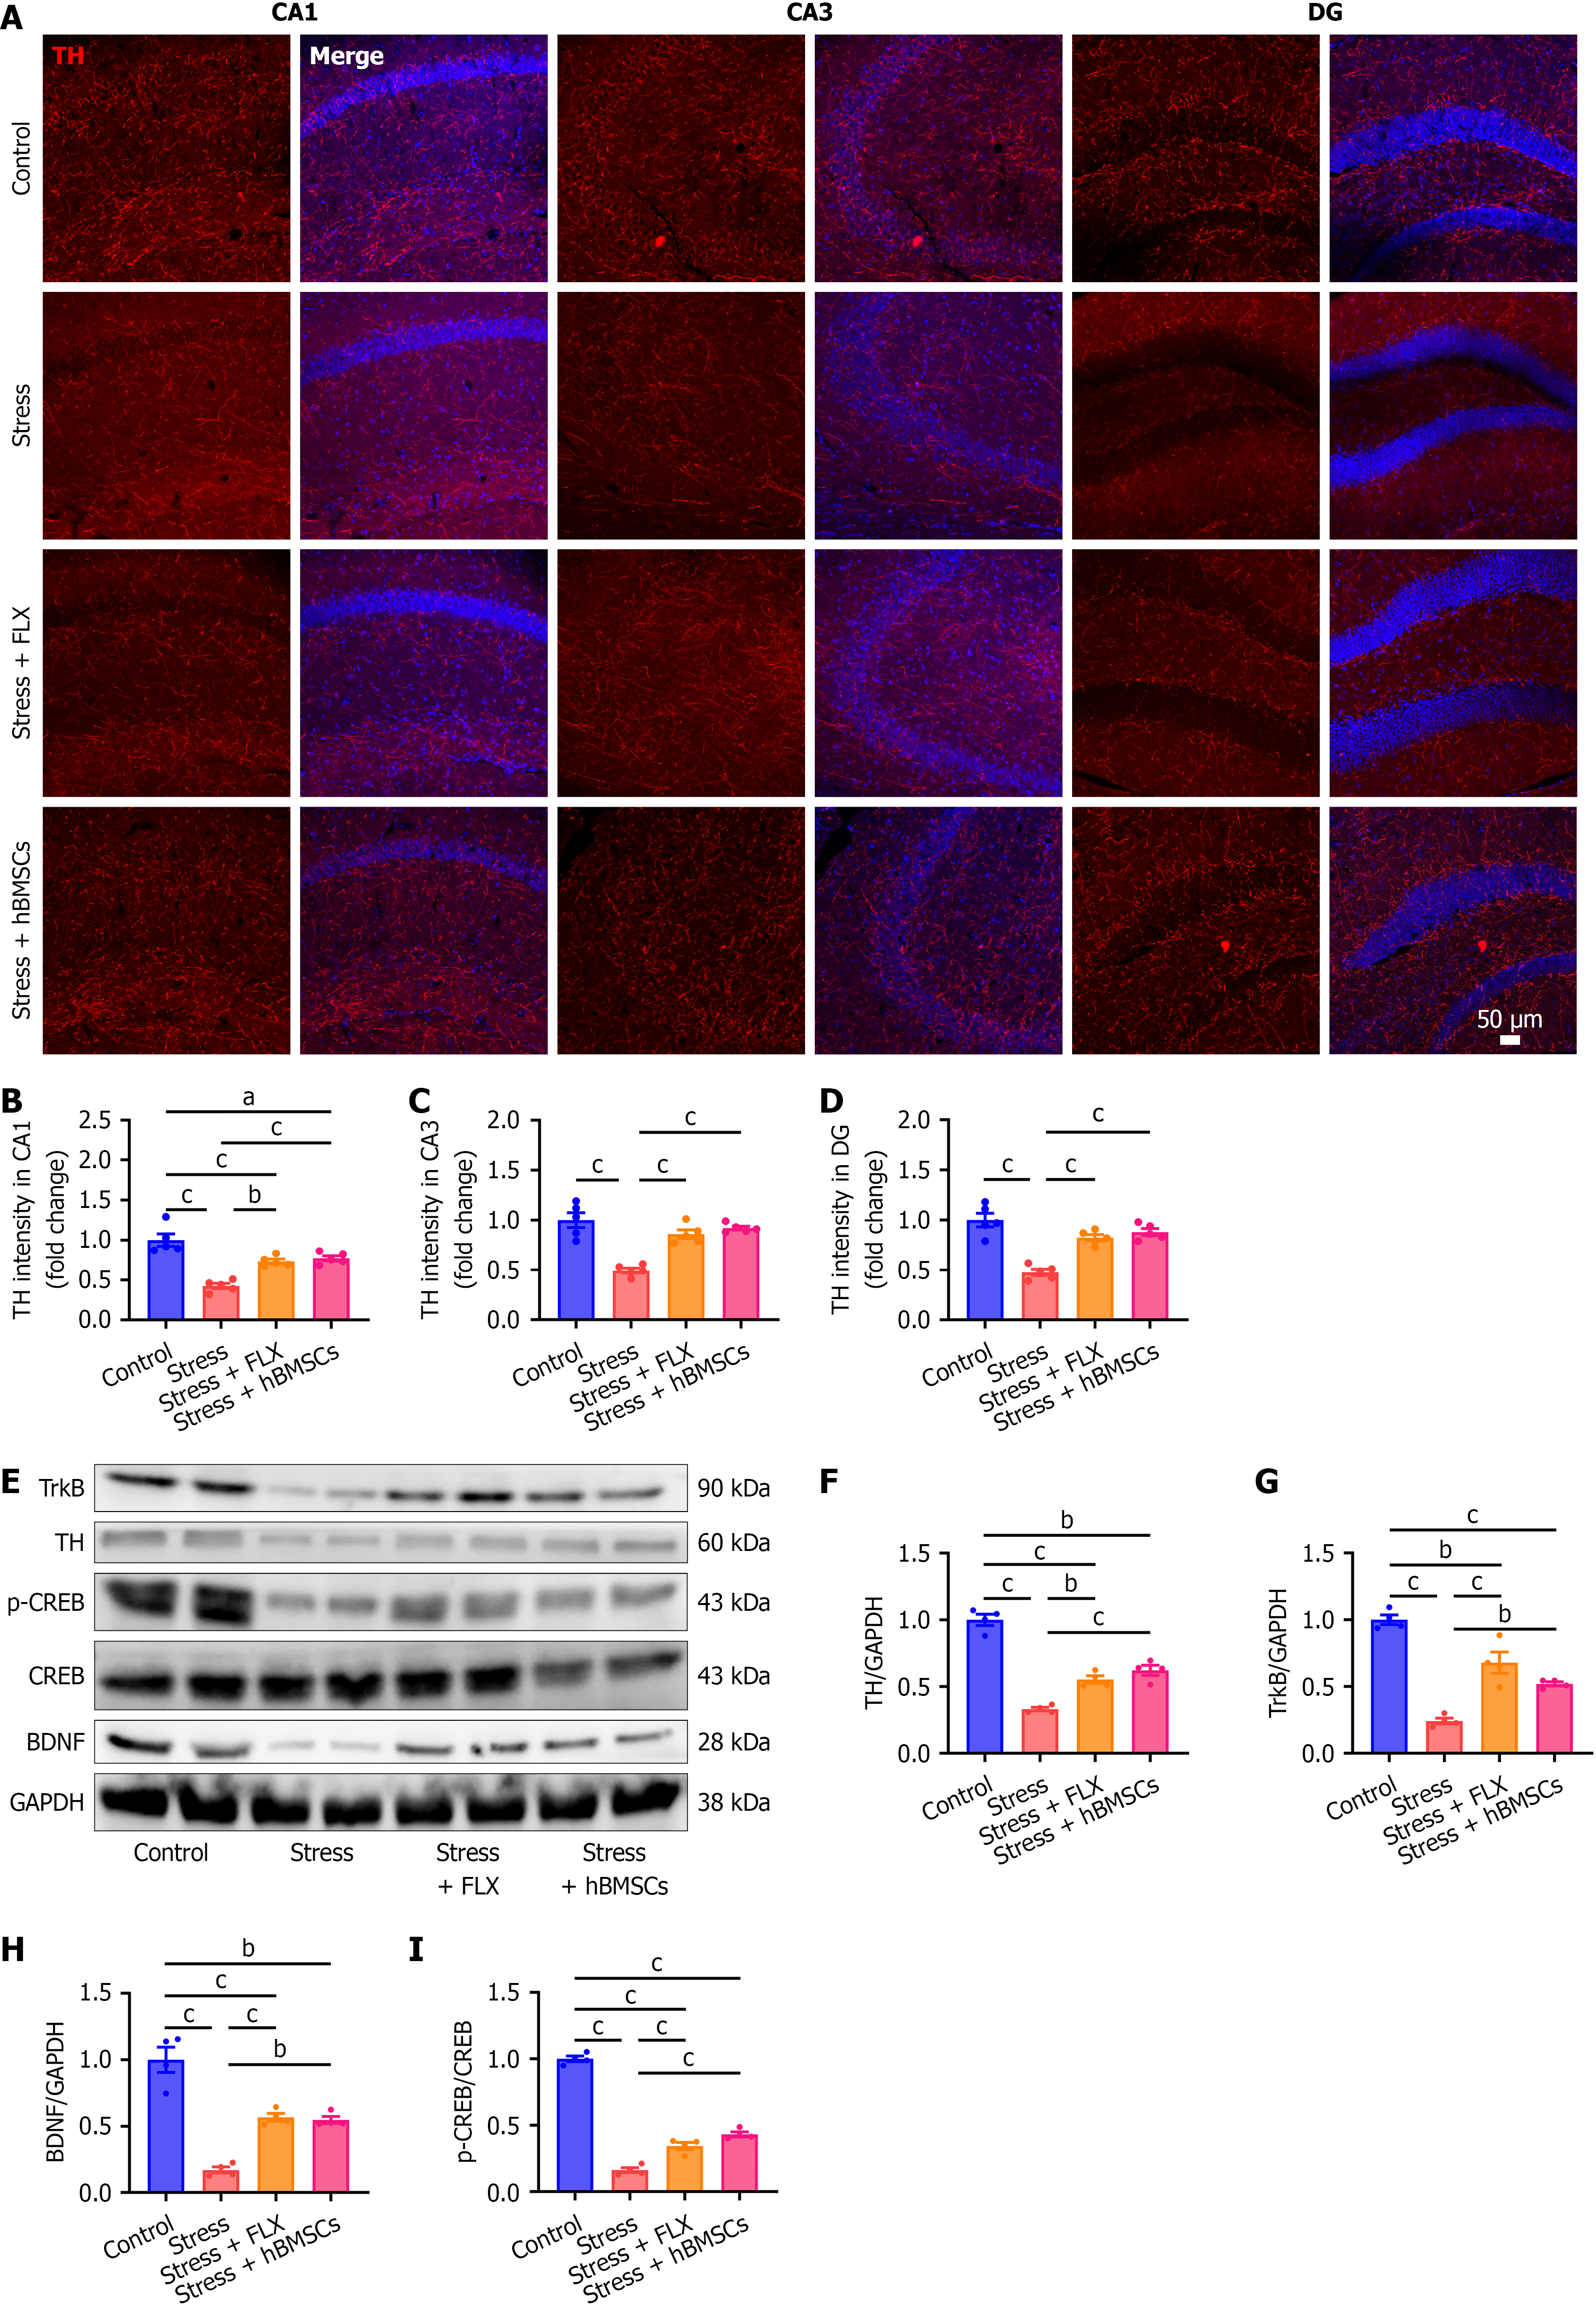
Figure 9 Neuroprotective effects of human bone marrow-derived mesenchymal stem cells were associated with the brain-derived neurotrophic factor/tropomyosin receptor kinase B/cAMP response element-binding protein signaling pathway.
A: Representative immunofluorescence images of tyrosine hydroxylase (TH) in the different subregions of the hippocampus; B-D: Quantification of relative fluorescence intensity of TH in CA1 (B), CA3 (C), and dentate gyrus (DG) (D) regions (n = 5 per group); E: Western blot plot of protein in the different groups; F-H: Relative expression levels of TH (F), tropomyosin receptor kinase B (G), and brain-derived neurotrophic factor (H) normalized to GAPDH; I: Relative levels phospho-cAMP response element-binding protein (CREB)/CREB. (n = 4 per group). aP < 0.05, bP < 0.01, cP < 0.001. Data were analyzed using one-way analysis of variance followed by Tukey’s multiple-comparisons test (mean ± SEM). FLX: Fluoxetine; hBMSCs: Human bone-marrow-derived mesenchymal stem cells; TH: Tyrosine hydroxylase; DG: Dentate gyrus; TrkB: Tropomyosin receptor kinase B; p-CREB: Phospho-cAMP response element-binding protein; CREB: CAMP response element-binding protein; BDNF: Brain-derived neurotrophic factor.
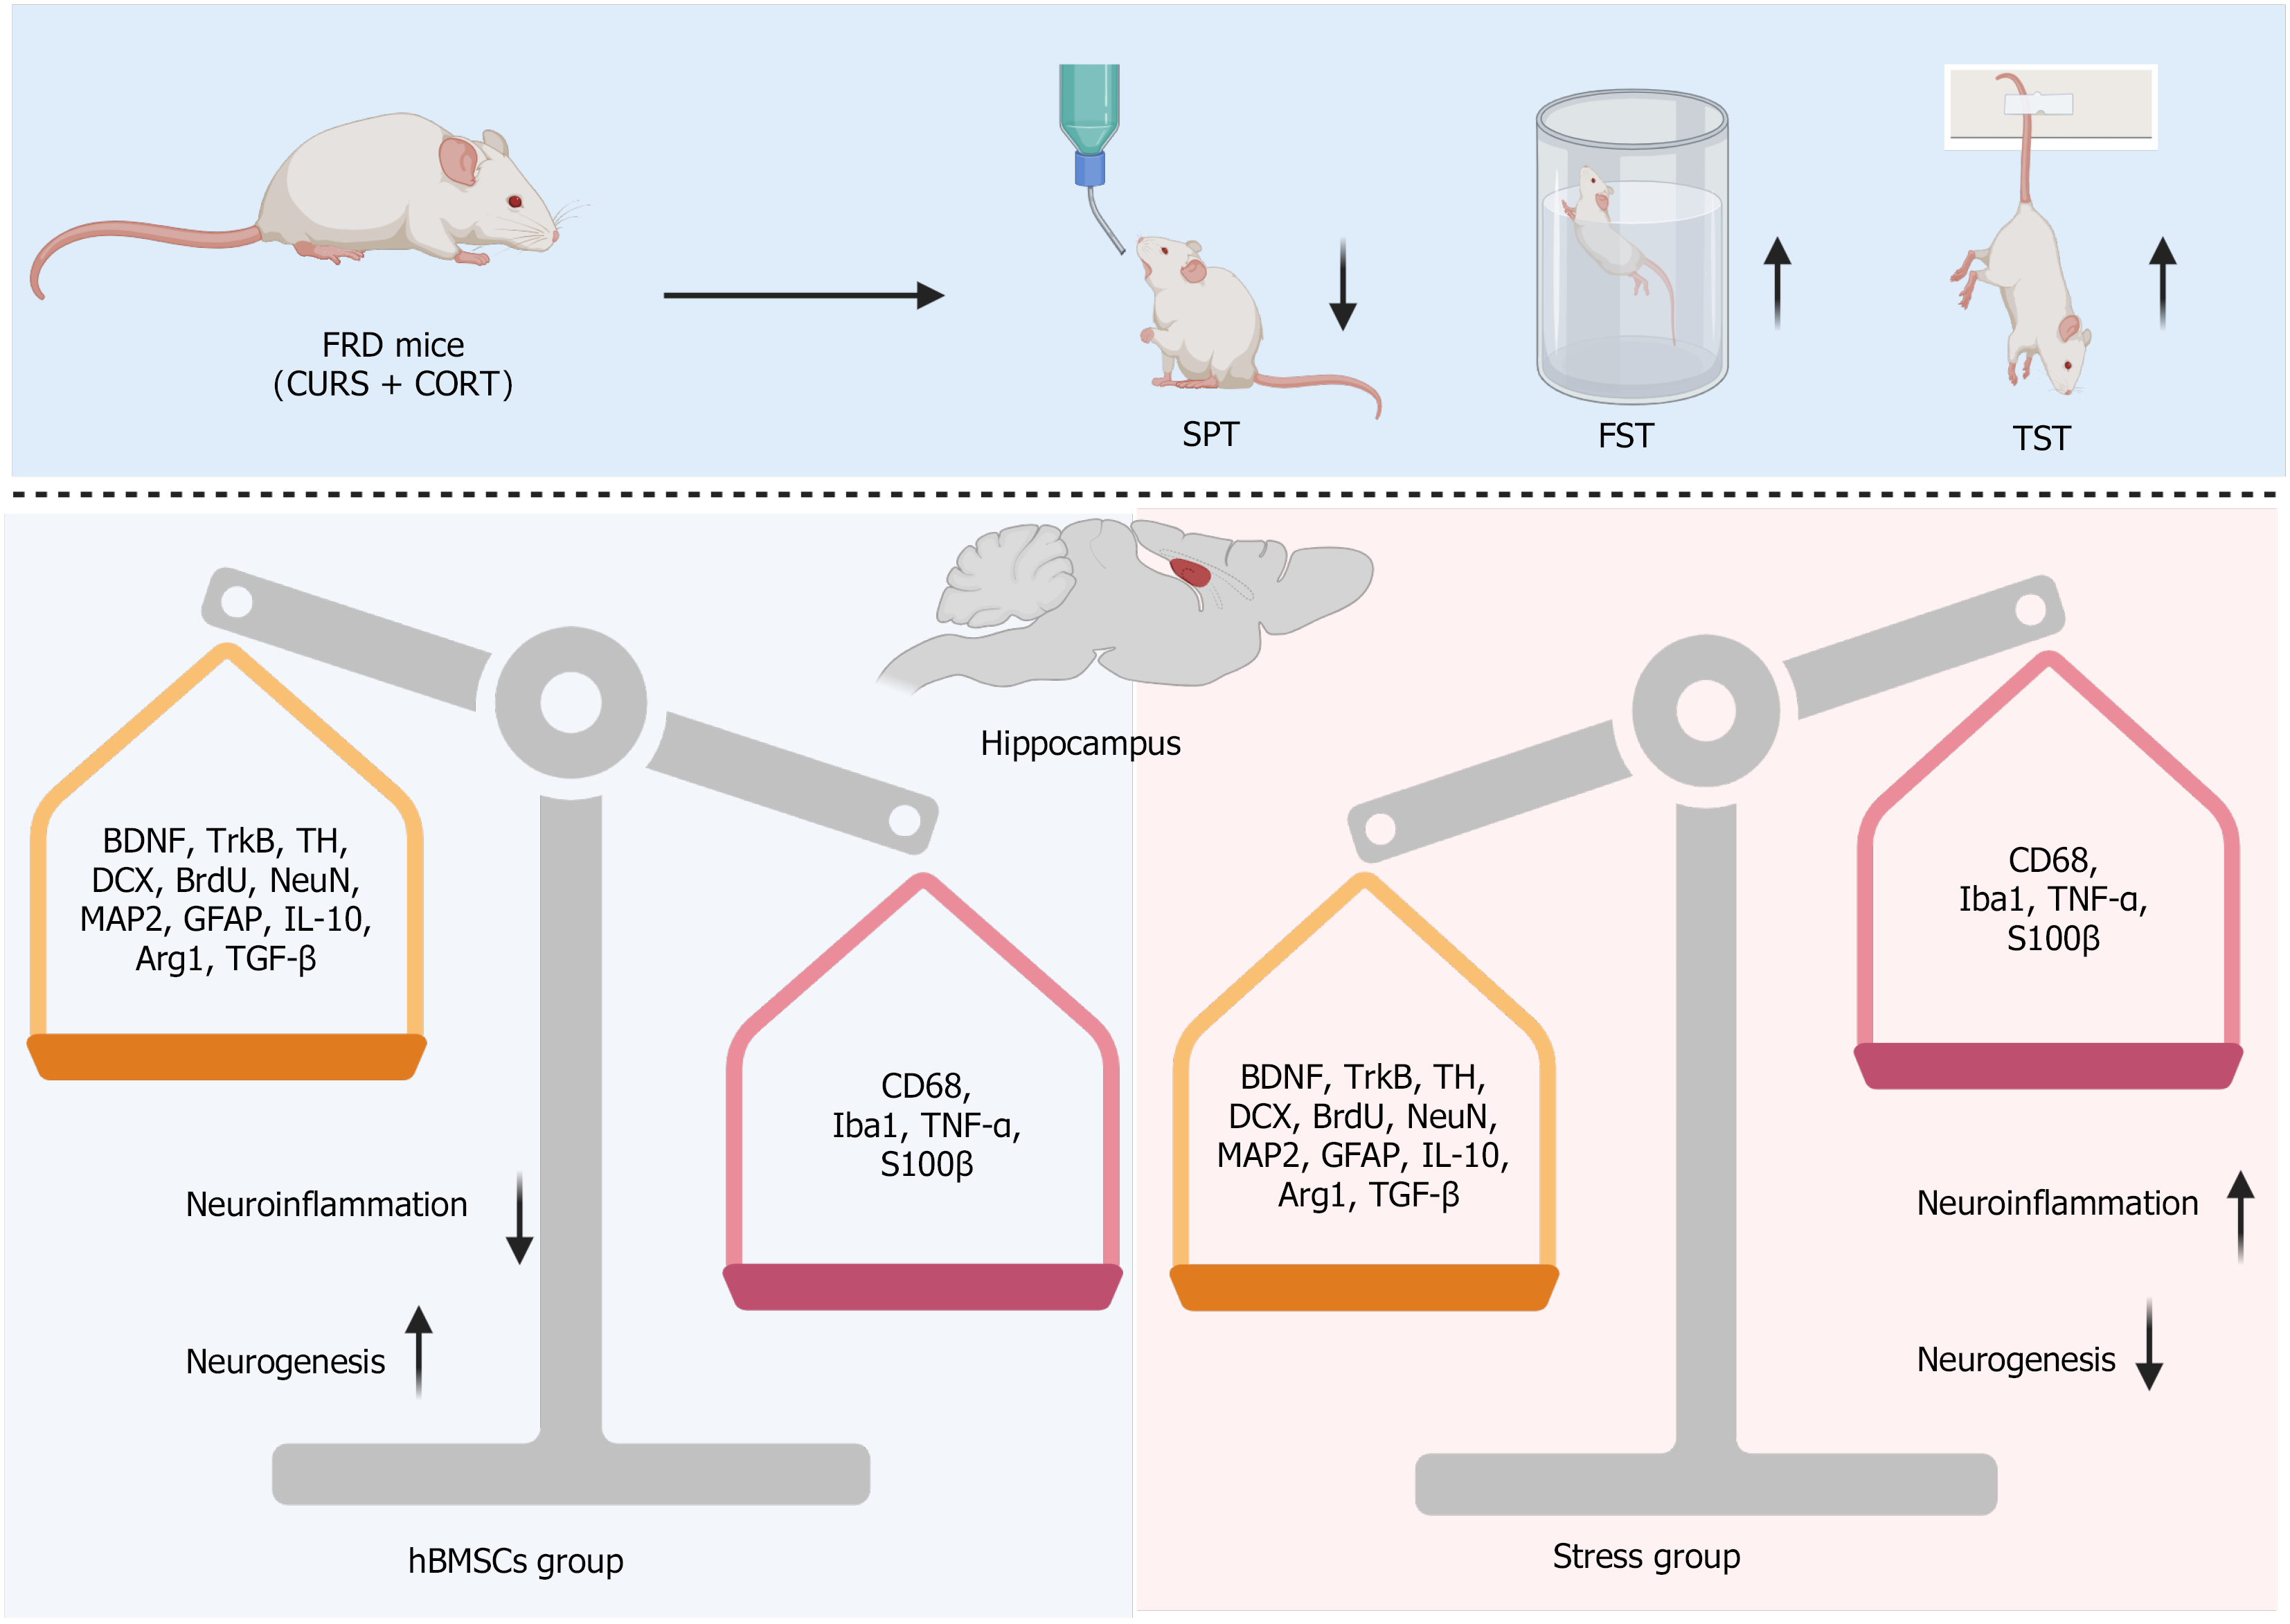
Figure 10 Proposed mechanisms underlying the antidepressant effects of human bone marrow-derived mesenchymal stem cells in fluoxetine-resistant depression.
The figure was created with BioRender.com. FRD: Fluoxetine-resistant depression; CURS: Chronic unpredictable restraint stress; CORT: Corticosterone; SPT: Sucrose preference test; FST: Forced swim test; TST: Tail suspension test; BDNF: Brain-derived neurotrophic factor; TrkB: Tropomyosin receptor kinase B; TH: Tyrosine hydroxylase; GFAP: Glial fibrillary acidic protein; IL-10: Interleukin-10; Arg1: Arginase 1; TGF: Transforming growth factor; hBMSCs: Human bone-marrow-derived mesenchymal stem cells; Iba1: Ionized calcium-binding adapter molecule 1; TNF: Tumor necrosis factor.
- Citation: Liu Y, Wu JF, Xu MY, Kang J, Ye AH, Liu B, Liu KZ. Human bone marrow-derived mesenchymal stem cells alleviate fluoxetine-resistant depression-like behaviors in mice by multi-target effects in the hippocampus. World J Stem Cells 2026; 18(10): 124640
- URL: https://www.wjgnet.com/1948-0210/full/v18/i10/124640.htm
- DOI: https://dx.doi.org/10.4252/wjsc.124640