
















Copyright: ©Author(s) 2026.
World J Stem Cells. Oct 26, 2026; 18(10): 119325
Published online Oct 26, 2026. doi: 10.4252/wjsc.119325
Published online Oct 26, 2026. doi: 10.4252/wjsc.119325
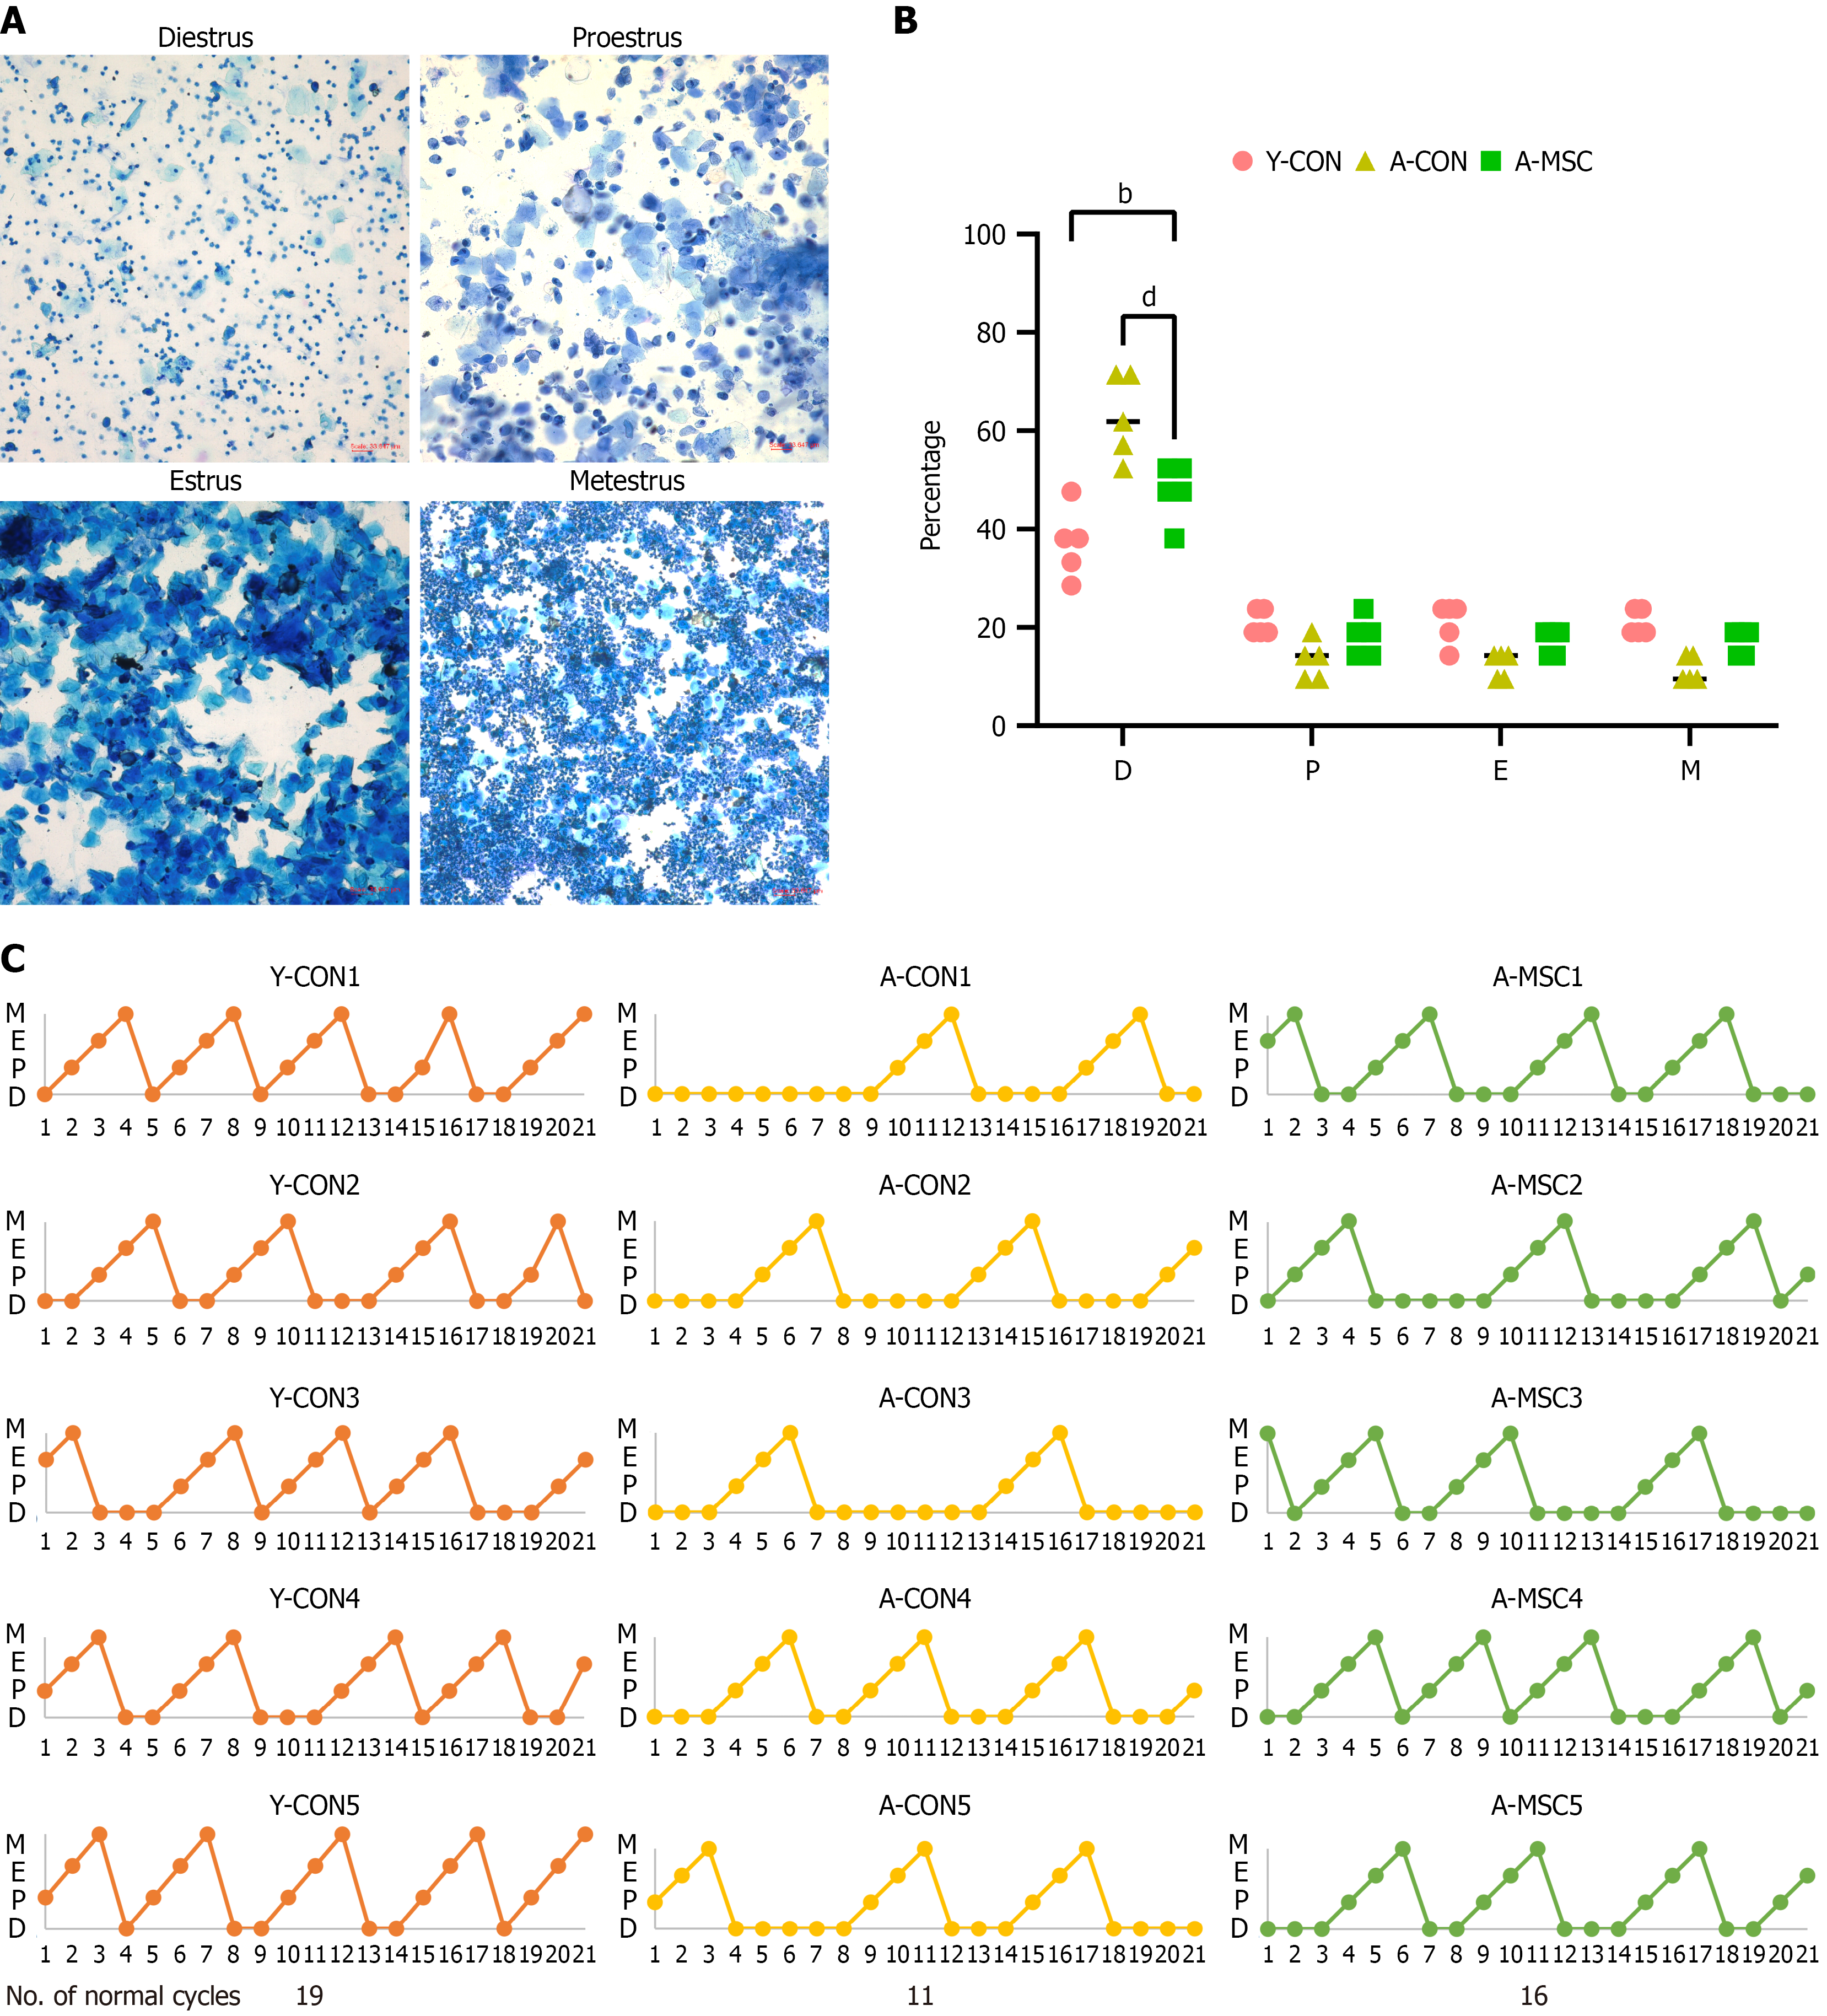
Figure 1 Umbilical cord-derived mesenchymal stem cell transplantation restores estrous cycle regularity in aged mice.
A: Representative cytological images of the four estrous cycle stages. Diestrus is characterized predominantly by the presence of leukocytes. Proestrus shows mainly nucleated epithelial cells, with a small number of cornified epithelial cells and few leukocytes. Estrus is dominated by large numbers of anucleated cornified epithelial cells. Metestrus exhibits small, densely stained leukocytes mixed with a small proportion of cornified cells. Scale bar = 33.647 μm; B: Proportional distribution of each estrous cycle stage among the different groups. Note the significant prolongation of diestrus in the aged control group and its reversal in the umbilical cord-derived mesenchymal stem cell (UCMSC) transplantation group; C: Estrous cycles recorded over the 21-day observation period. UCMSC transplantation increased the total number of normal cycles in aged mice. bP < 0.01, dP < 0.0001. Y-CON: Young control; A-CON: Aged control; A-MSC: Umbilical cord-derived mesenchymal stem cell transplantation.
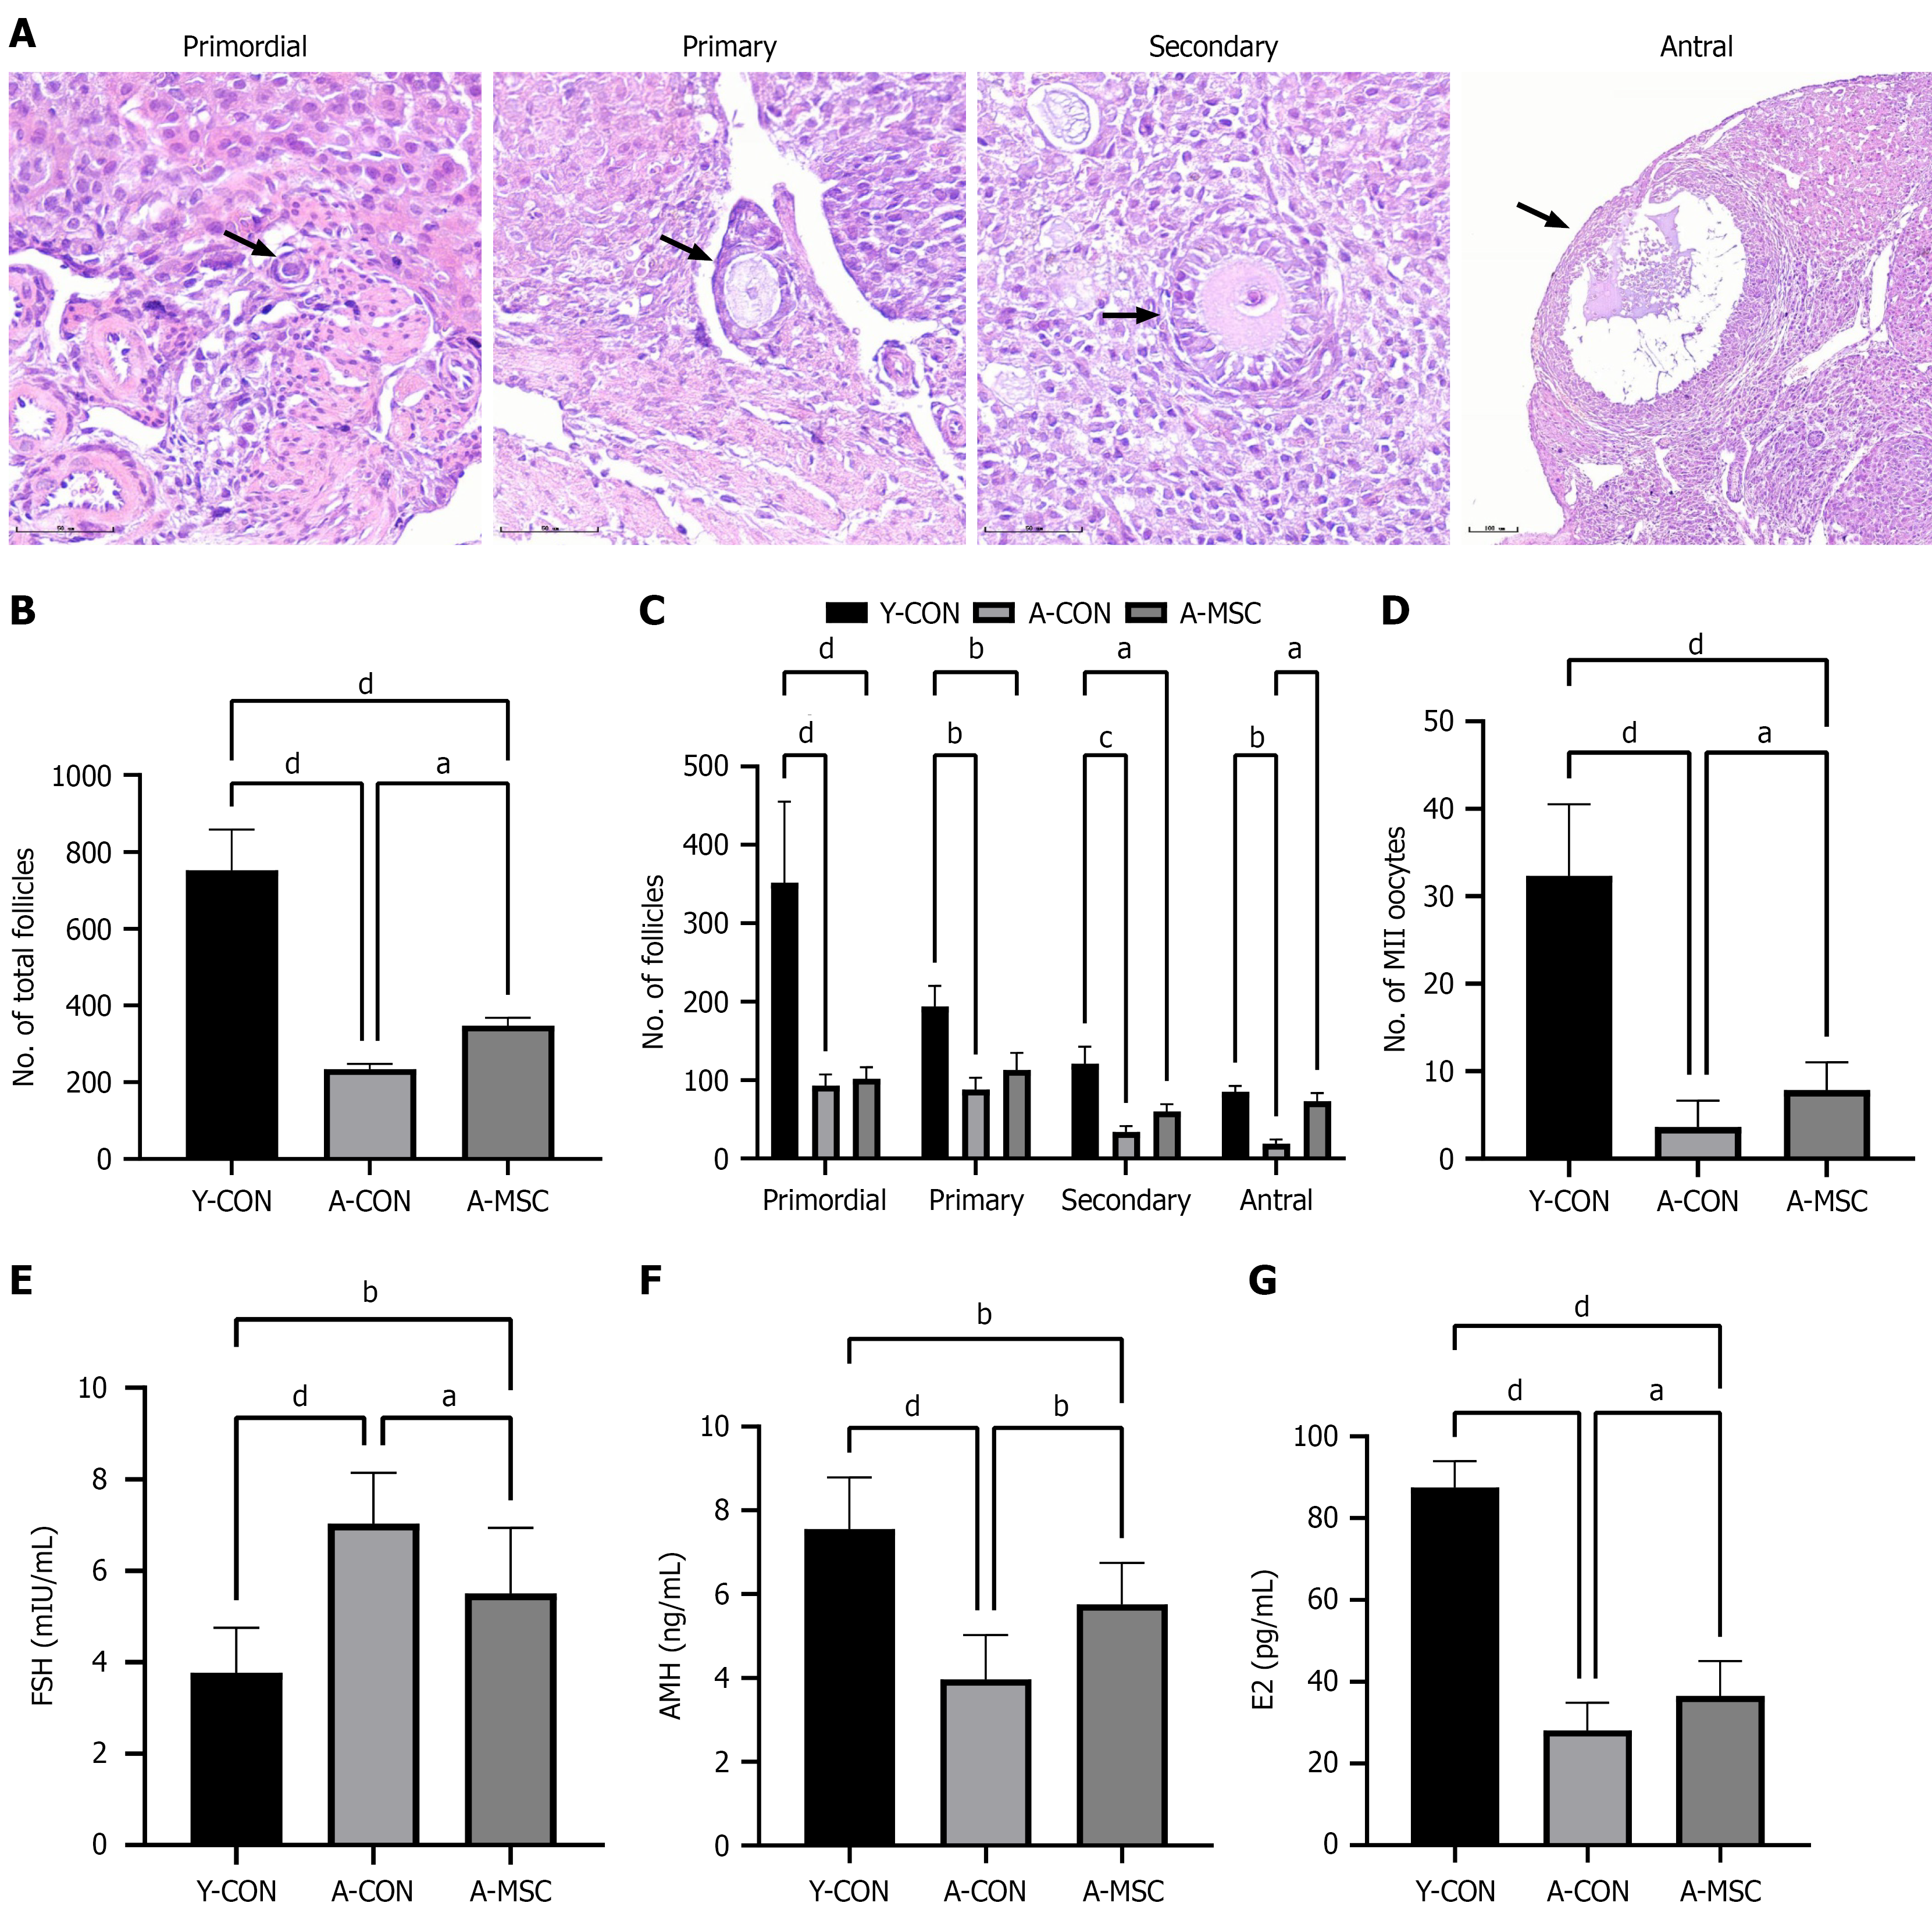
Figure 2 Umbilical cord-derived mesenchymal stem cell transplantation enhances ovarian reserve and function in aged mice.
A: Re
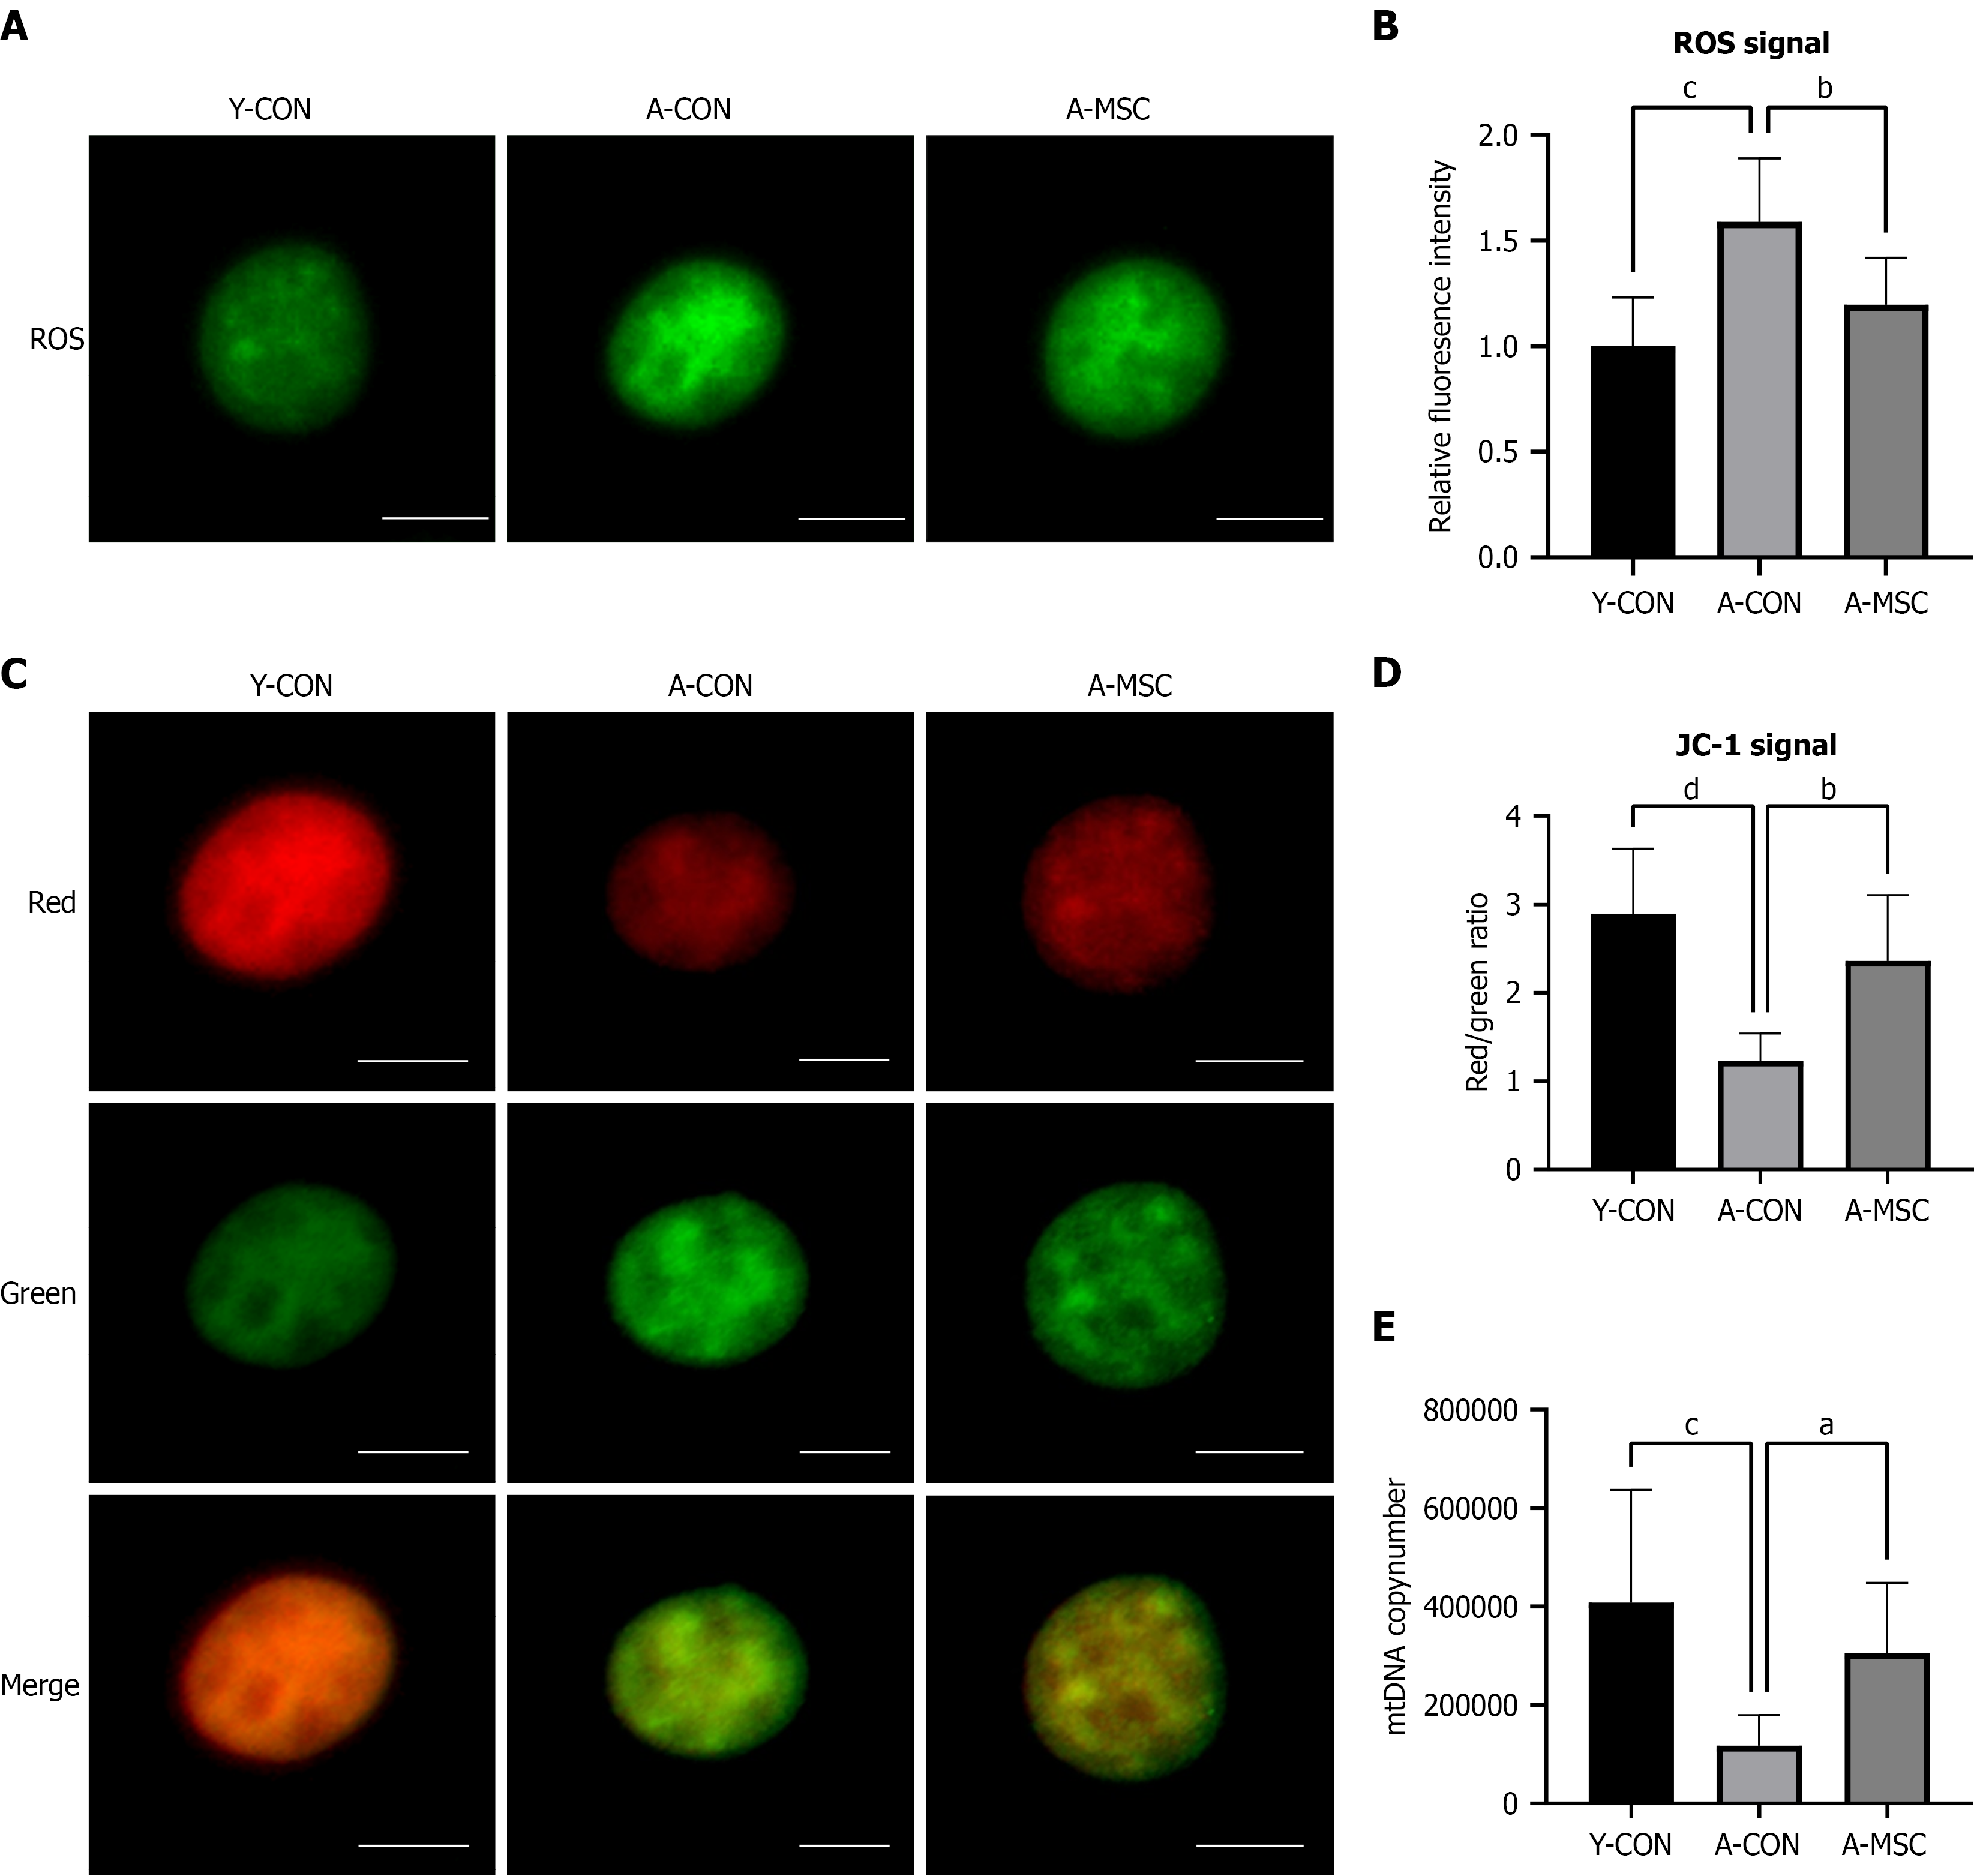
Figure 3 Umbilical cord-derived mesenchymal stem cell transplantation ameliorates oocyte mitochondrial function in aged mice.
A: Representative images of reactive oxygen species (ROS) levels in oocytes, detected by DCFH-DA fluorescence; B: Quantitative analysis of ROS levels in oocytes. ROS levels were significantly elevated in the aged control (A-CON) group and were reduced following umbilical cord-derived mesenchymal stem cell transplantation (A-MSC); C: Assessment of mitochondrial membrane potential (ΔΨm) using JC-1 staining. Representative fluorescence images are shown (red: J-aggregates, high ΔΨm; green: J-monomers, low ΔΨm); D: Quantitative analysis of the JC-1 red-to-green fluorescence intensity ratio. The reduced ratio observed in A-CON oocytes was significantly restored by A-MSC; E: Absolute quantification of mitochondrial DNA (mtDNA) copy number in individual metaphase II oocytes. The marked depletion of mtDNA copy number in the A-CON group was significantly rescued by A-MSC. Scale bar = 20 μm. Data are presented as mean ± SEM. aP < 0.05, bP < 0.01, cP < 0.001, dP < 0.0001. Y-CON: Young control; A-CON: Aged control; A-MSC: Umbilical cord-derived mesenchymal stem cell transplantation; ROS: Reactive oxygen species; mtDNA: Mitochondrial DNA.
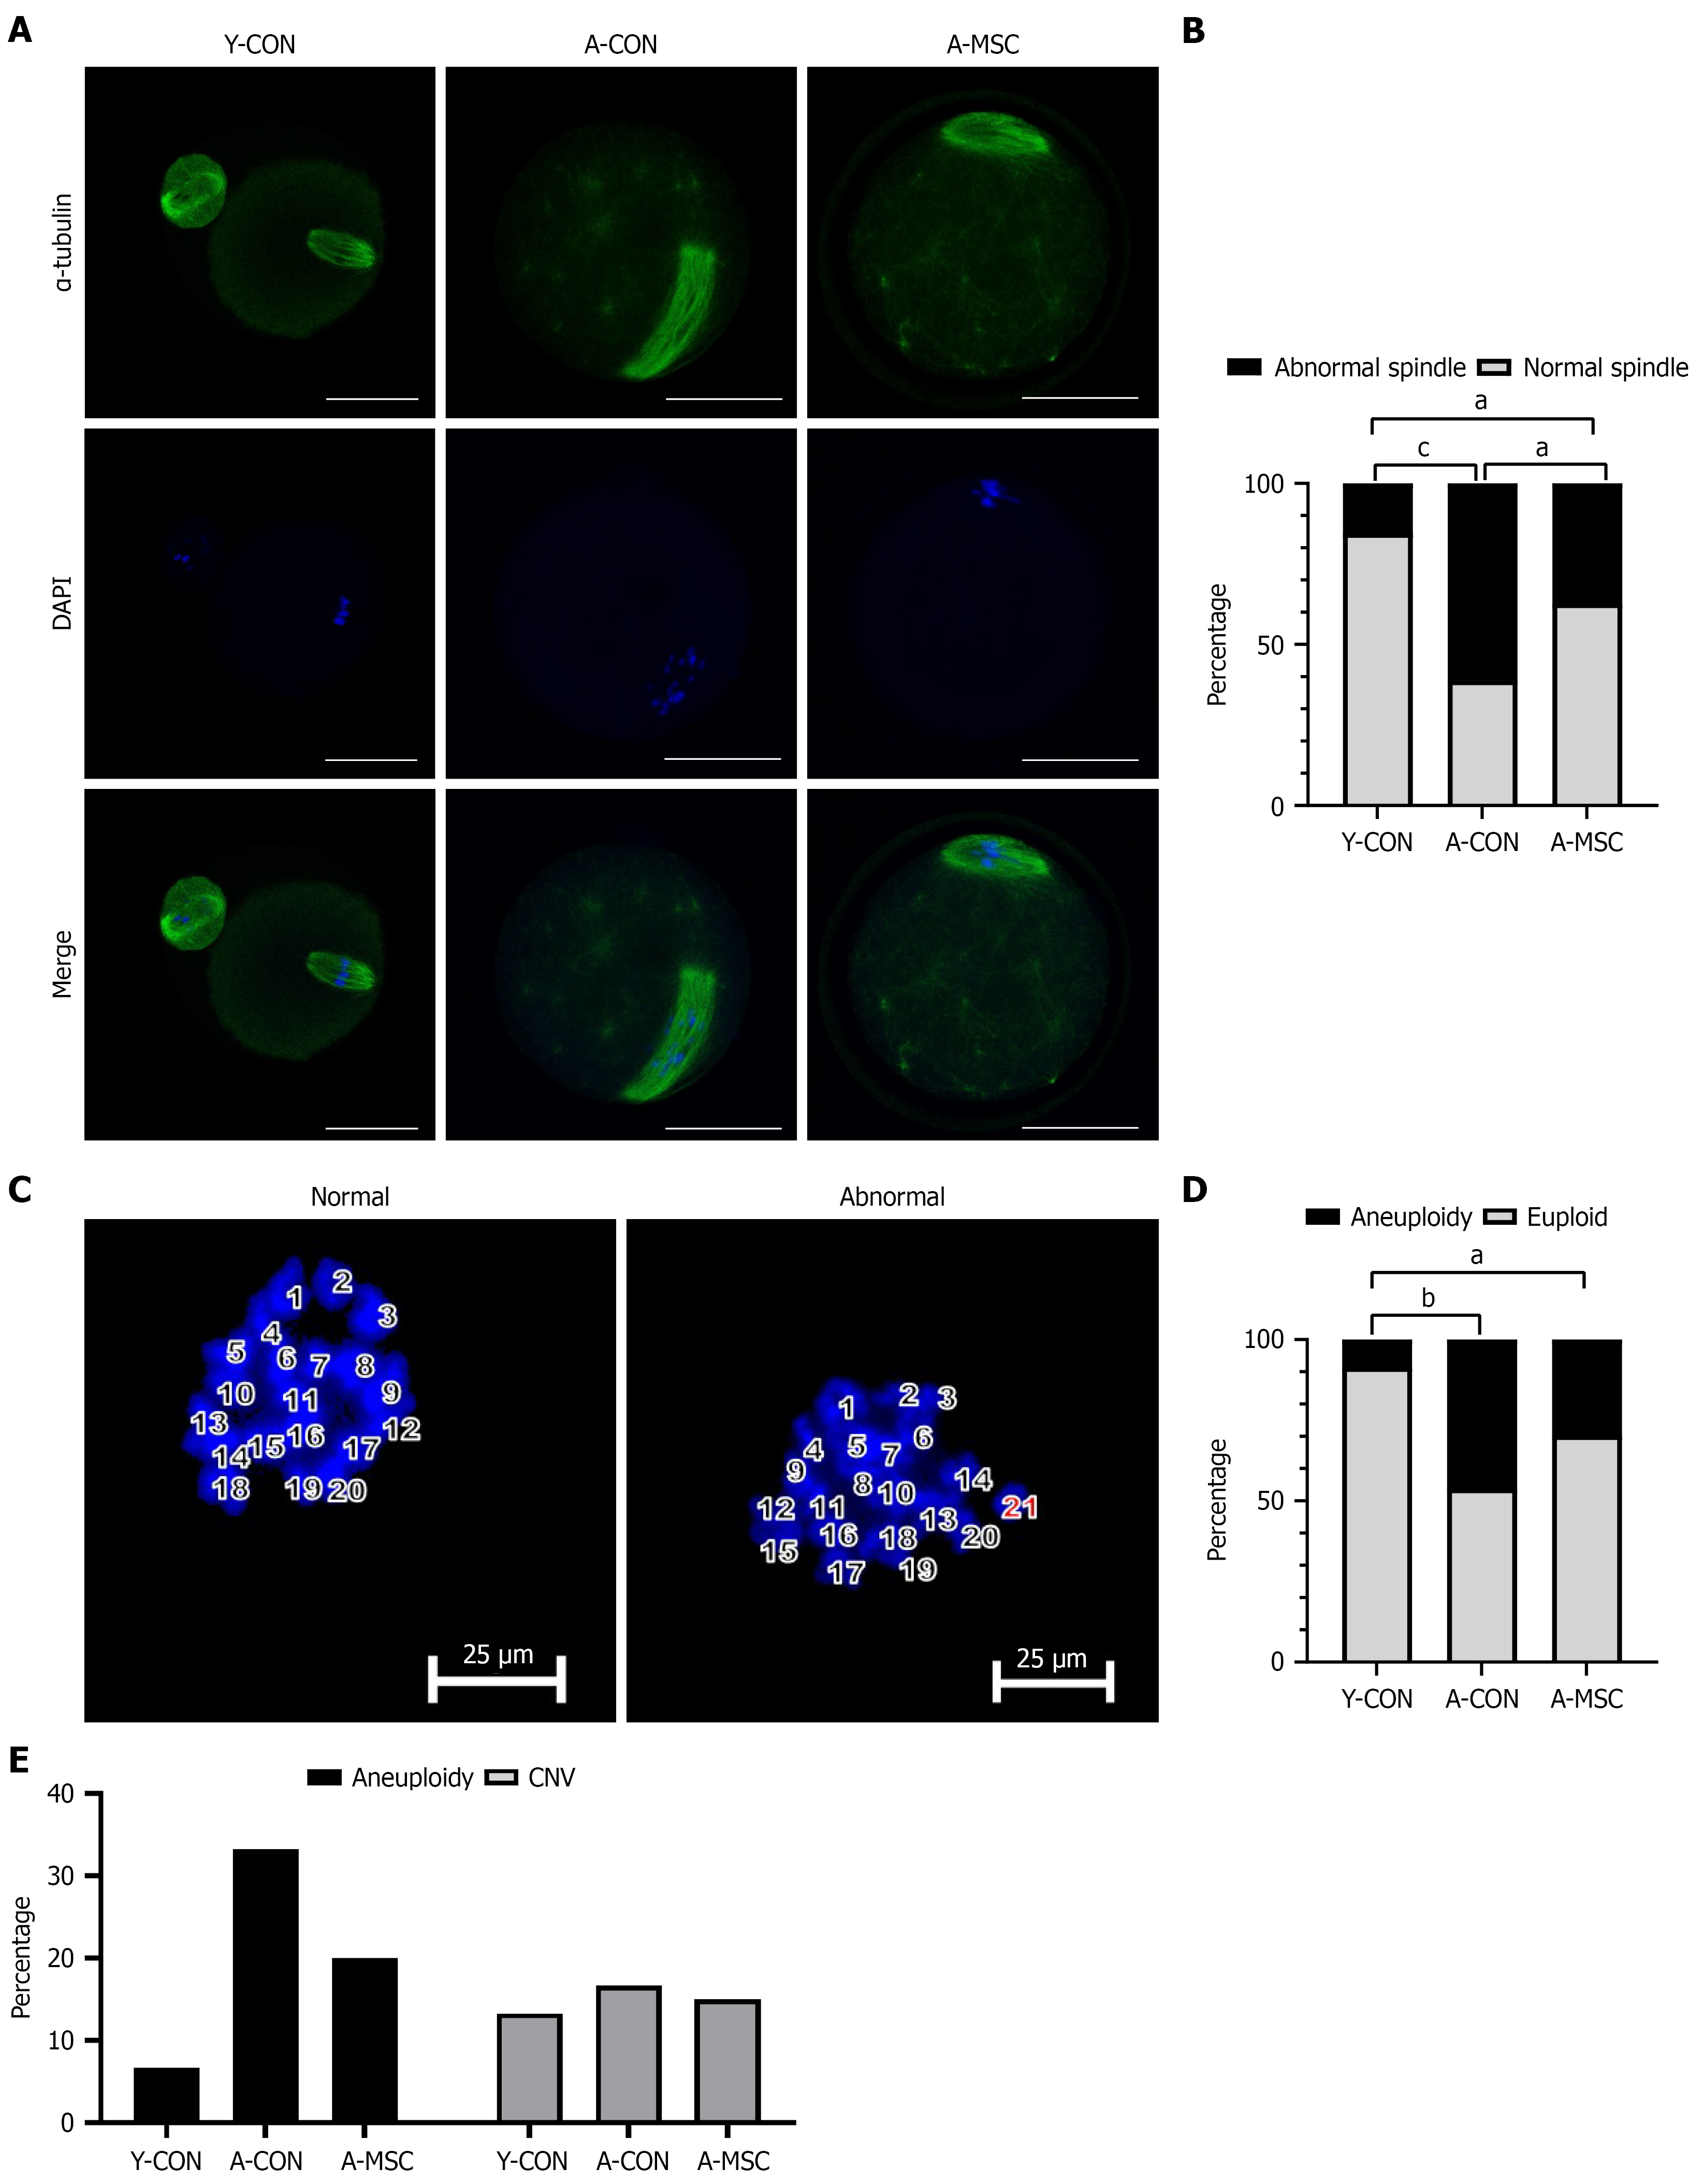
Figure 4 Umbilical cord-derived mesenchymal stem cell transplantation improves the meiotic apparatus and reduces aneuploidy tendency in oocytes from aged mice.
A: Representative immunofluorescence images of meiotic spindles (green, α-tubulin) and chromosomes (blue, DAPI) in metaphase II (MII) oocytes. Scale bar = 20 μm; B: Quantitative analysis of the percentage of oocytes with normal spindle morphology. Umbilical cord-derived mesenchymal stem cell transplantation (A-MSC) significantly rescued the age-related decline in normal spindle formation; C: Representative images of chromosome spreads from MII oocytes, showing a normal euploid count (20 chromosomes) and an abnormal aneuploid count (21 chromosomes). Scale bar = 20 μm; D: Quantitative analysis of the percentage of oocytes with a normal chromosome count (20); E: Bar chart showing the percentages of aneuploid oocytes and oocytes with copy number variations across the different groups. Data are presented as mean ± SEM. aP < 0.05, bP < 0.01, cP < 0.001. Y-CON: Young control; A-CON: Aged control; A-MSC: Umbilical cord-derived mesenchymal stem cell transplantation; CNV: Copy number variation.
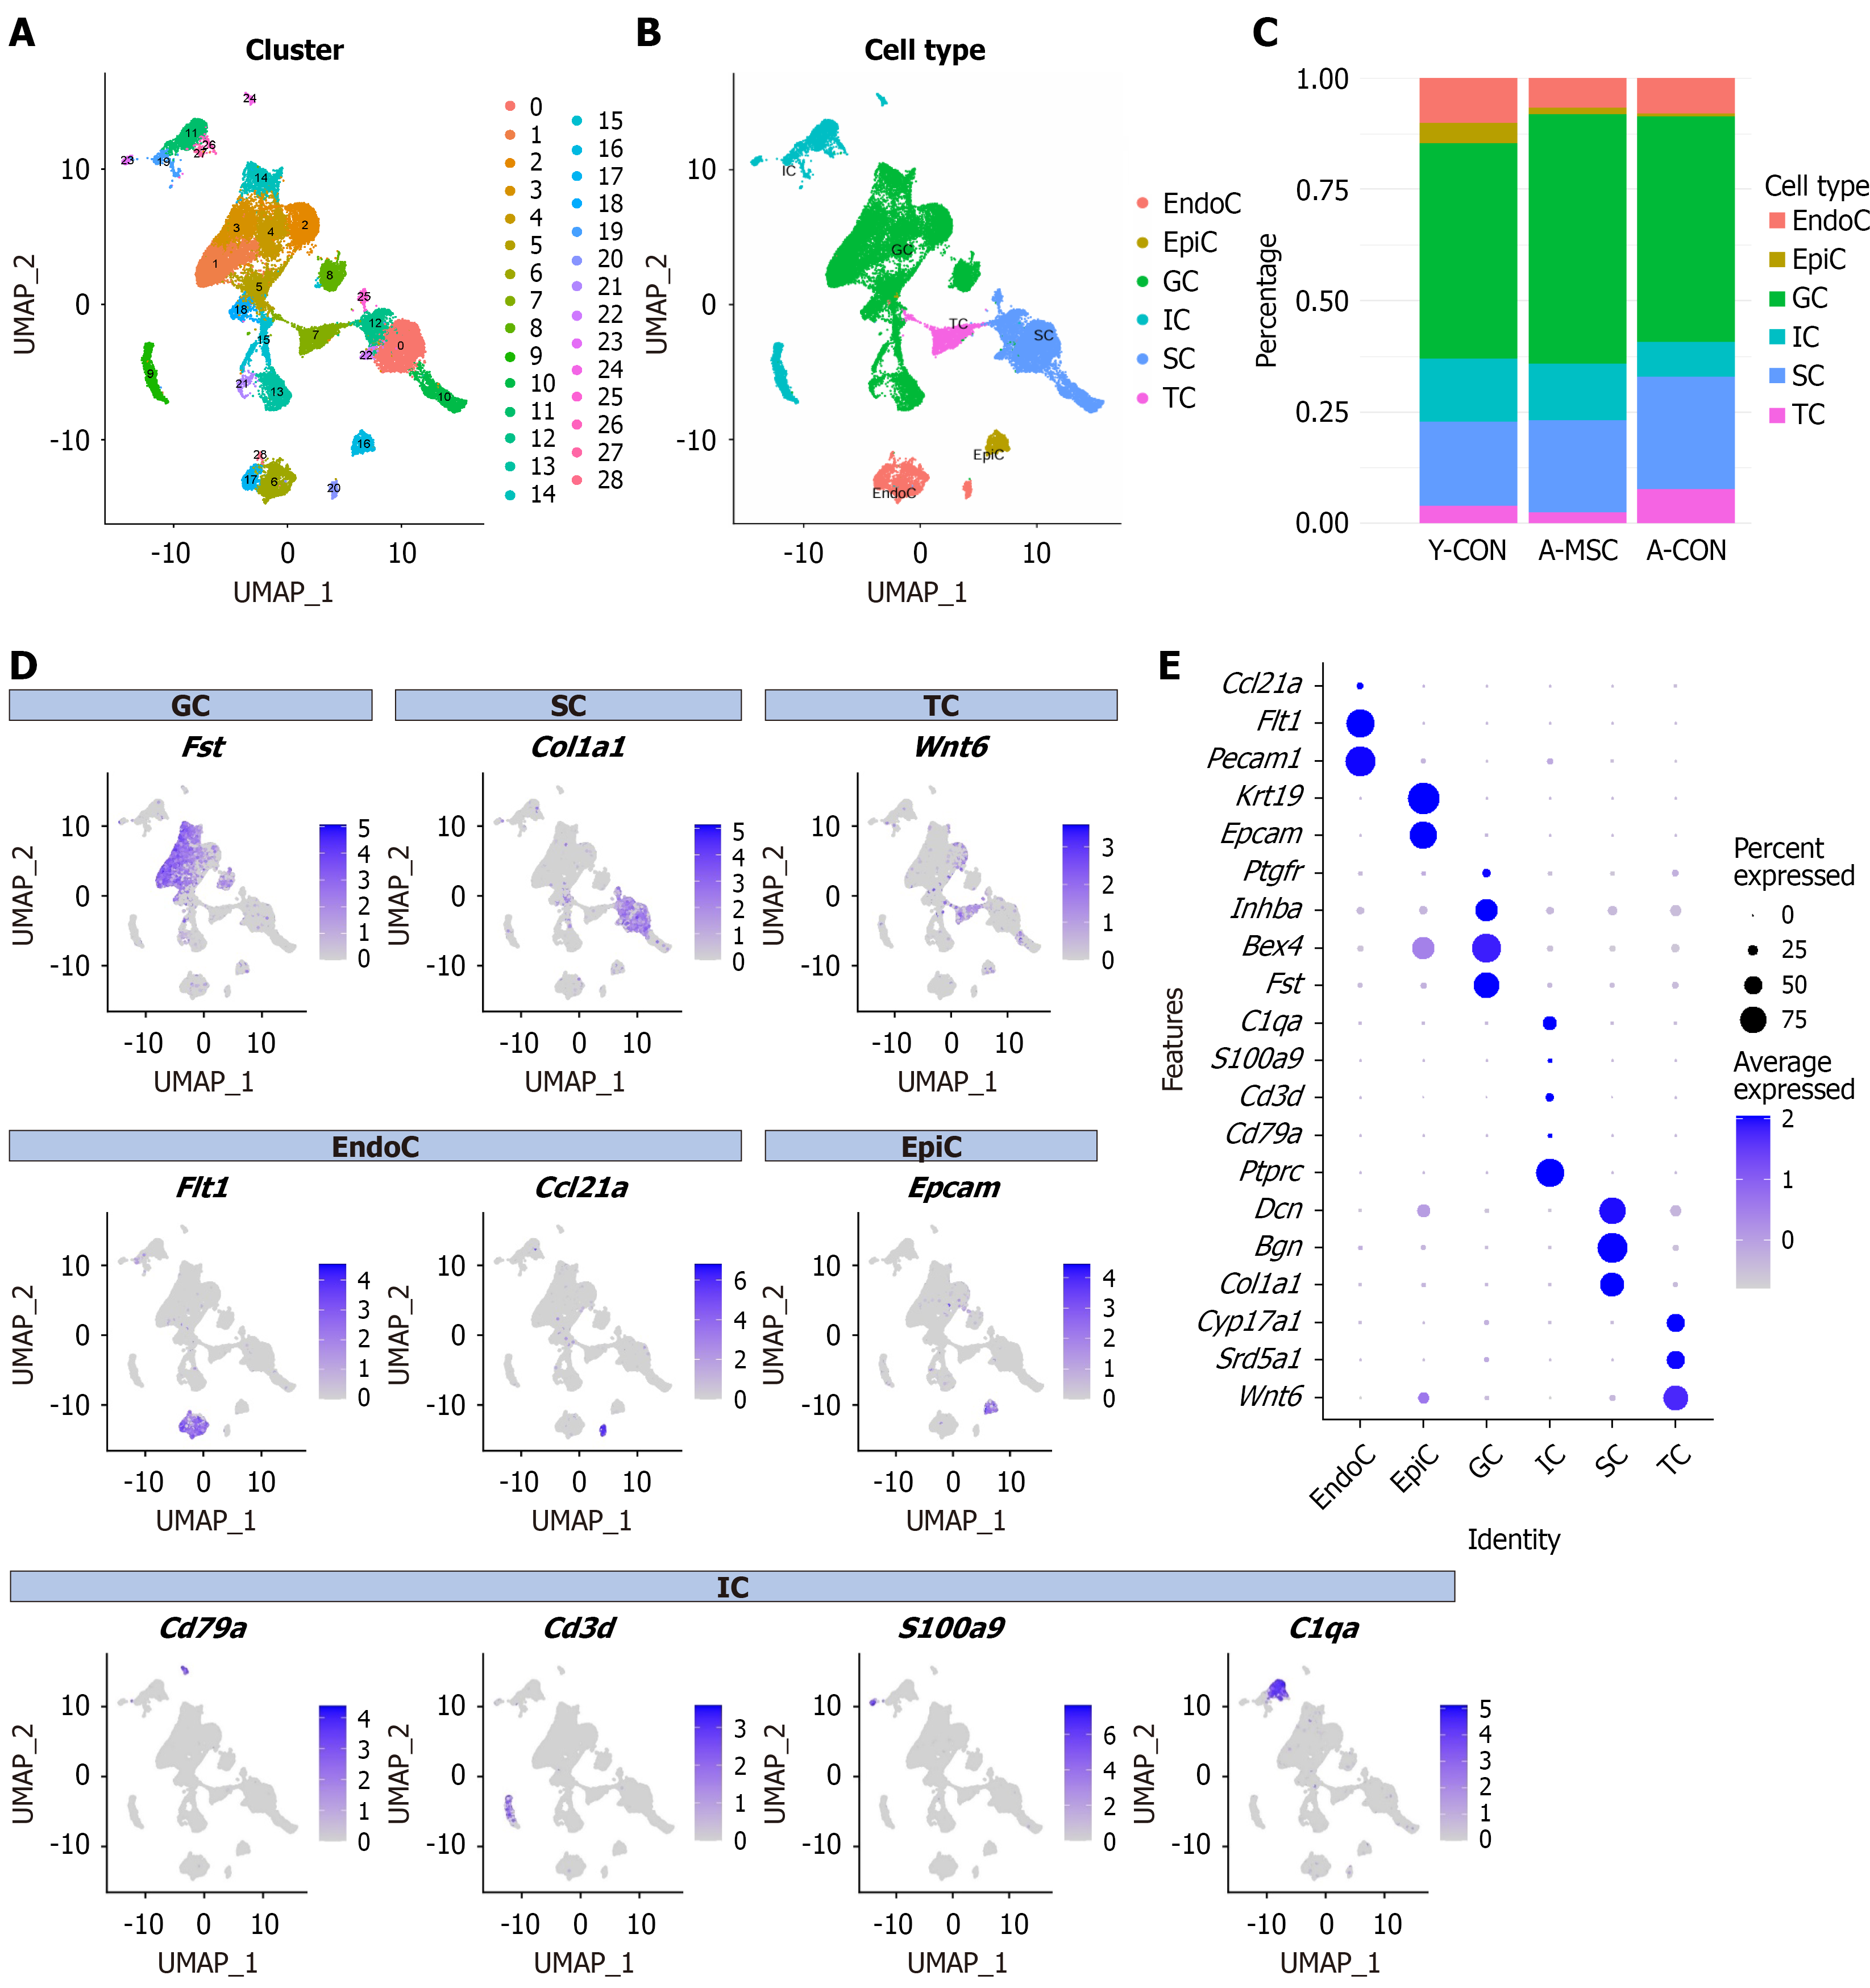
Figure 5 Single-cell transcriptomic profiling defines the ovarian cellular landscape.
A: UMAP visualization of single cells from mouse ovarian tissues, colored by 29 distinct cell clusters; B: UMAP visualization of single cells from mouse ovarian tissues, colored by different cell types; C: Stacked bar plot showing the proportional composition of major ovarian cell types across the three experimental groups; D: Feature plots showing the expression of marker genes used for cell type annotation; E: Dot plots showing the expression of marker genes used for cell type annotation. GC: Granulosa cell; SC: Stromal cell; TC: Theca cell; EndoC: Endothelial cell; EpiC: Epithelial cell; IC: Immune cell.
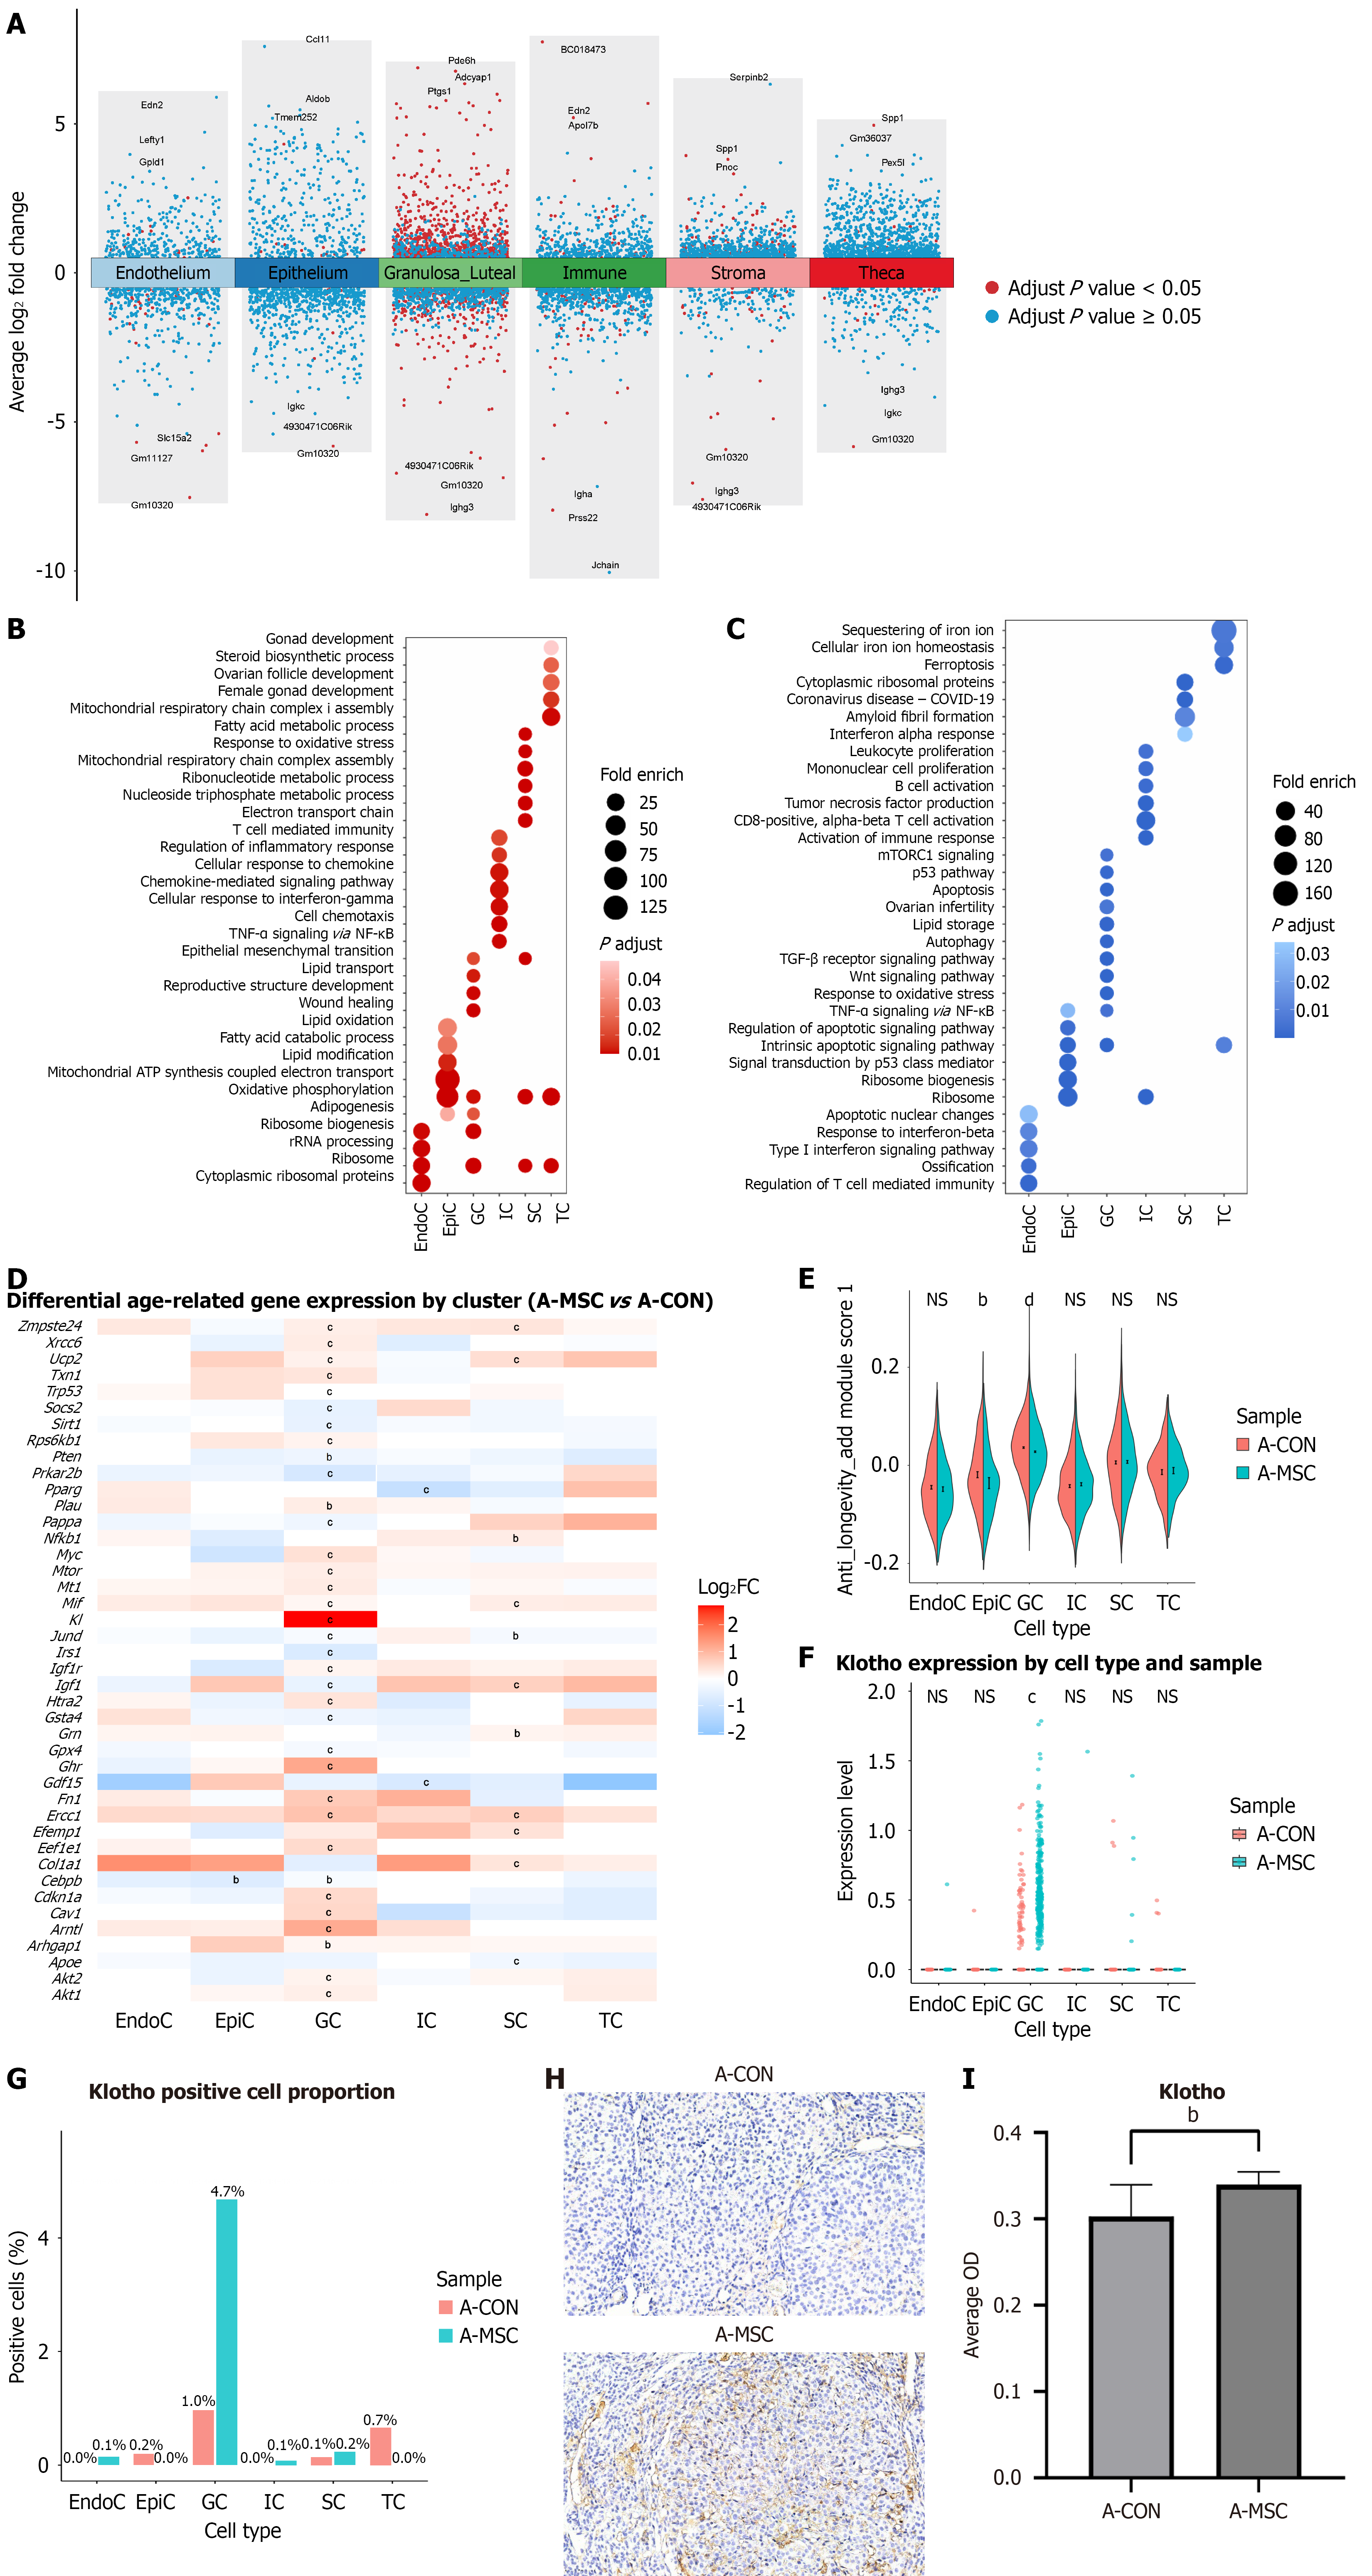
Figure 6 Umbilical cord-derived mesenchymal stem cell transplantation induces cell-type-specific transcriptomic reprogramming and upregulates the anti-aging gene Klotho.
A: Volcano plots showing the numbers of upregulated and downregulated differentially expressed genes (DEGs) in major ovarian cell types between the umbilical cord-derived mesenchymal stem cell (UCMSC) transplantation and aged control groups. Granulosa cells (GCs) and stromal cells (SCs) exhibited the most pronounced changes; B: Functional enrichment analysis of upregulated DEGs; C: Functional enrichment analysis of downregulated DEGs; D: Heatmap showing the differential expression levels of key anti-aging genes from the GenAge database across cell types. Klotho was significantly upregulated in granulosa cells; E: Senescence scores calculated for each cell type based on the GenAge database gene set. UCMSC transplantation significantly reduced senescence scores in granulosa cells and epithelial cells; F: Klotho expression by cell type and sample; G: Proportion of Klotho-positive cells by cell type and sample; H: Representative immunohistochemical images of KLOTHO protein in ovarian sections; I: Quantification of KLOTHO protein expression in ovarian sections. UCMSC transplantation markedly enhanced KLOTHO expression. aP < 0.05, bP < 0.01, cP < 0.001, dP < 0.0001. GC: Granulosa cell; SC: Stromal cell; TC: Theca cell; EndoC: Endothelial cell; EpiC: Epithelial cell; IC: Immune cell; A-CON: Aged control; A-MSC: Umbilical cord-derived mesenchymal stem cell transplantation.
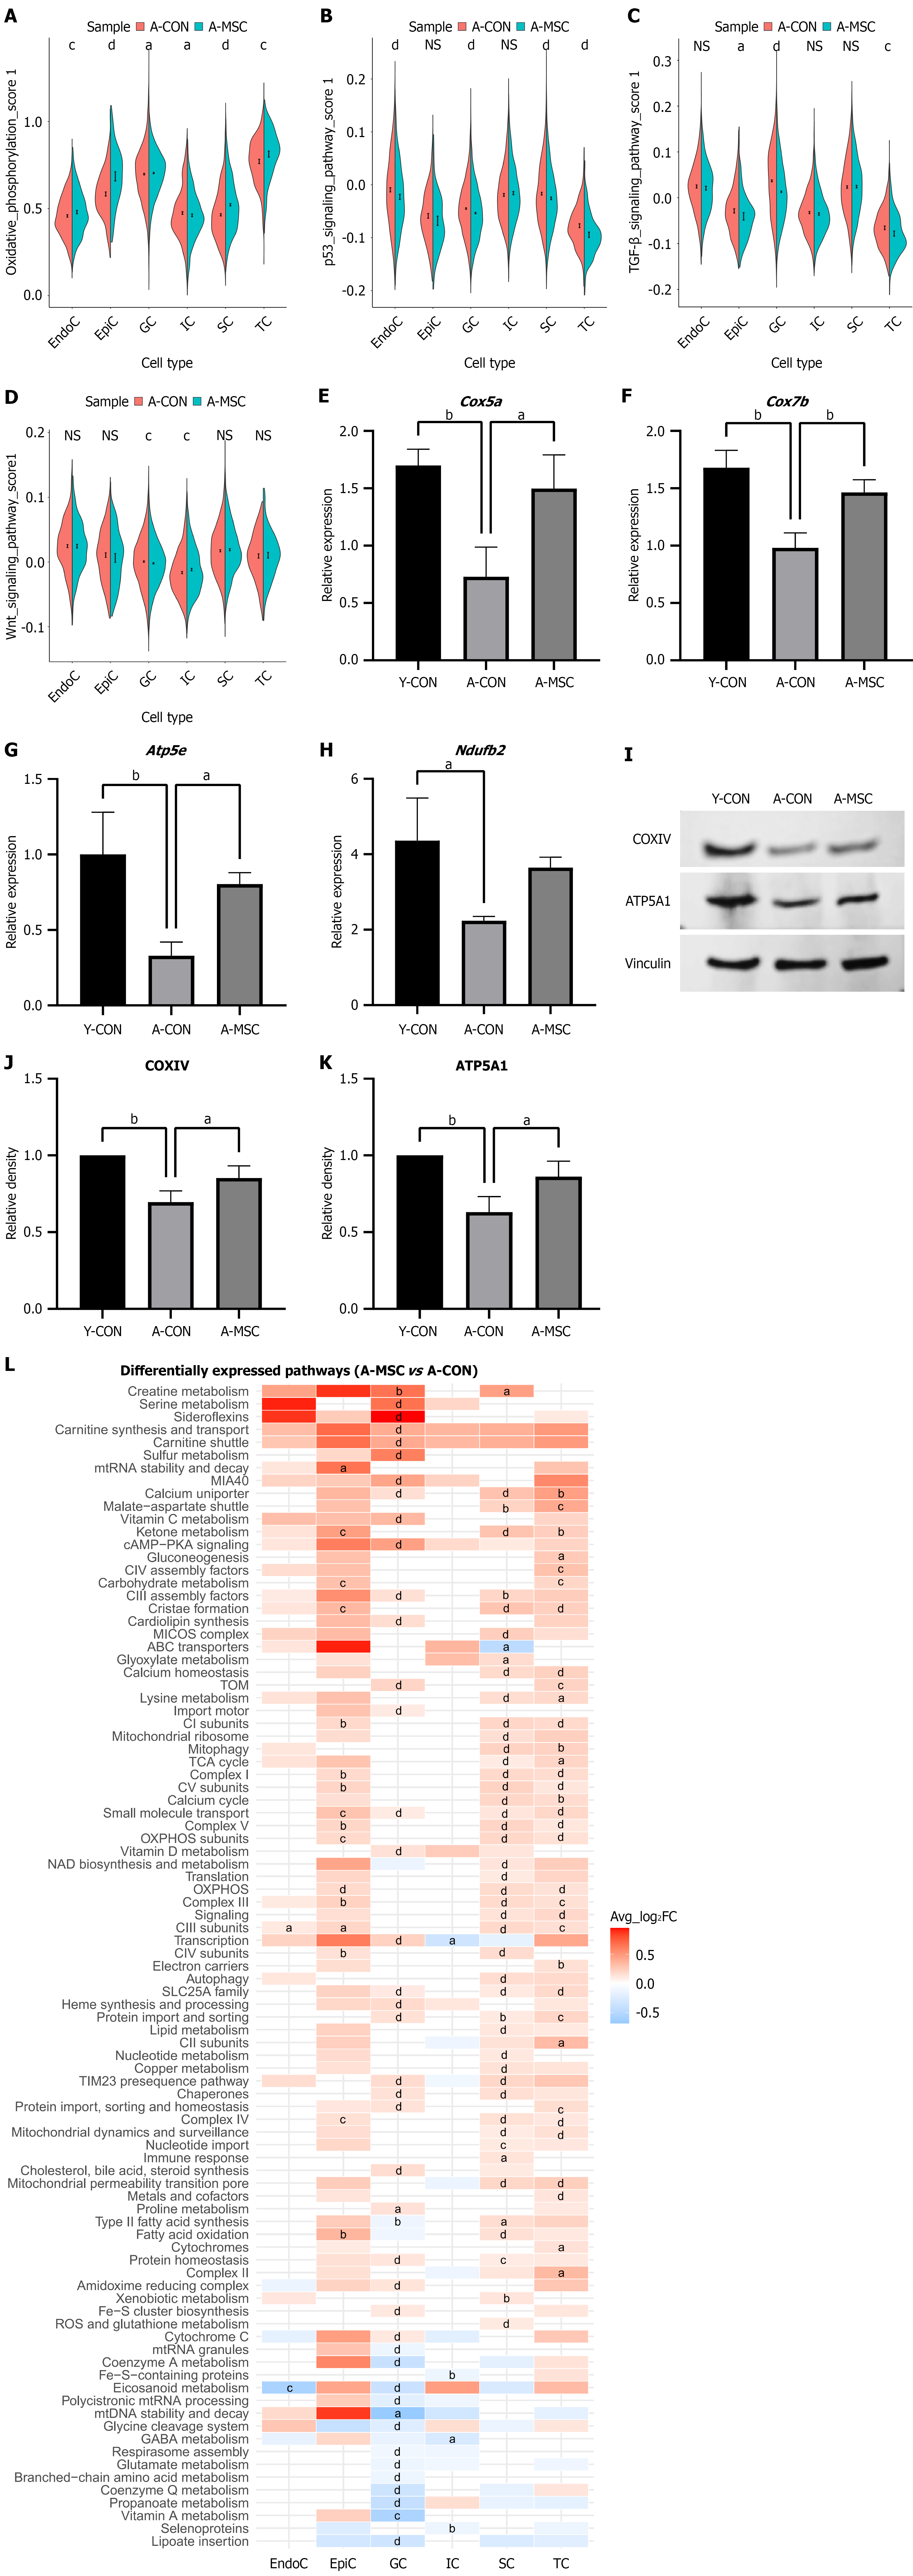
Figure 7 Umbilical cord-derived mesenchymal stem cell transplantation enhances oxidative phosphorylation.
A: Oxidative phosphorylation activity was significantly increased in most somatic cell types following umbilical cord-derived mesenchymal stem cell (UCMSC) transplantation; B: Activity of the senescence-associated p53 pathway; C: Activity of the senescence-associated transforming growth factor-β pathway; D: Activity of the senescence-associated Wnt pathway; E: The mRNA expression levels of Cox5a; F: The mRNA expression levels of Cox7b; G: The mRNA expression levels of Atp5e; H: The mRNA expression levels of Ndufb2; I: Validation of enhanced oxidative phosphorylation at the protein level by western blot analysis; J: Representative western blot images of COXIV; K: Representative western blot images of ATP5A; L: Mitochondrial pathway activity scores derived from the MitoCarta3.0 database, showing coordinated upregulation in stromal, theca, and granulosa cells following UCMSC transplantation. Data are presented as mean ± SEM. aP < 0.05, bP < 0.01, cP < 0.001, dP < 0.0001. GC: Granulosa cell; SC: Stromal cell; TC: Theca cell; EndoC: Endothelial cell; EpiC: Epithelial cell; IC: Immune cell; A-CON: Aged control; A-MSC: Umbilical cord-derived mesenchymal stem cell transplantation.
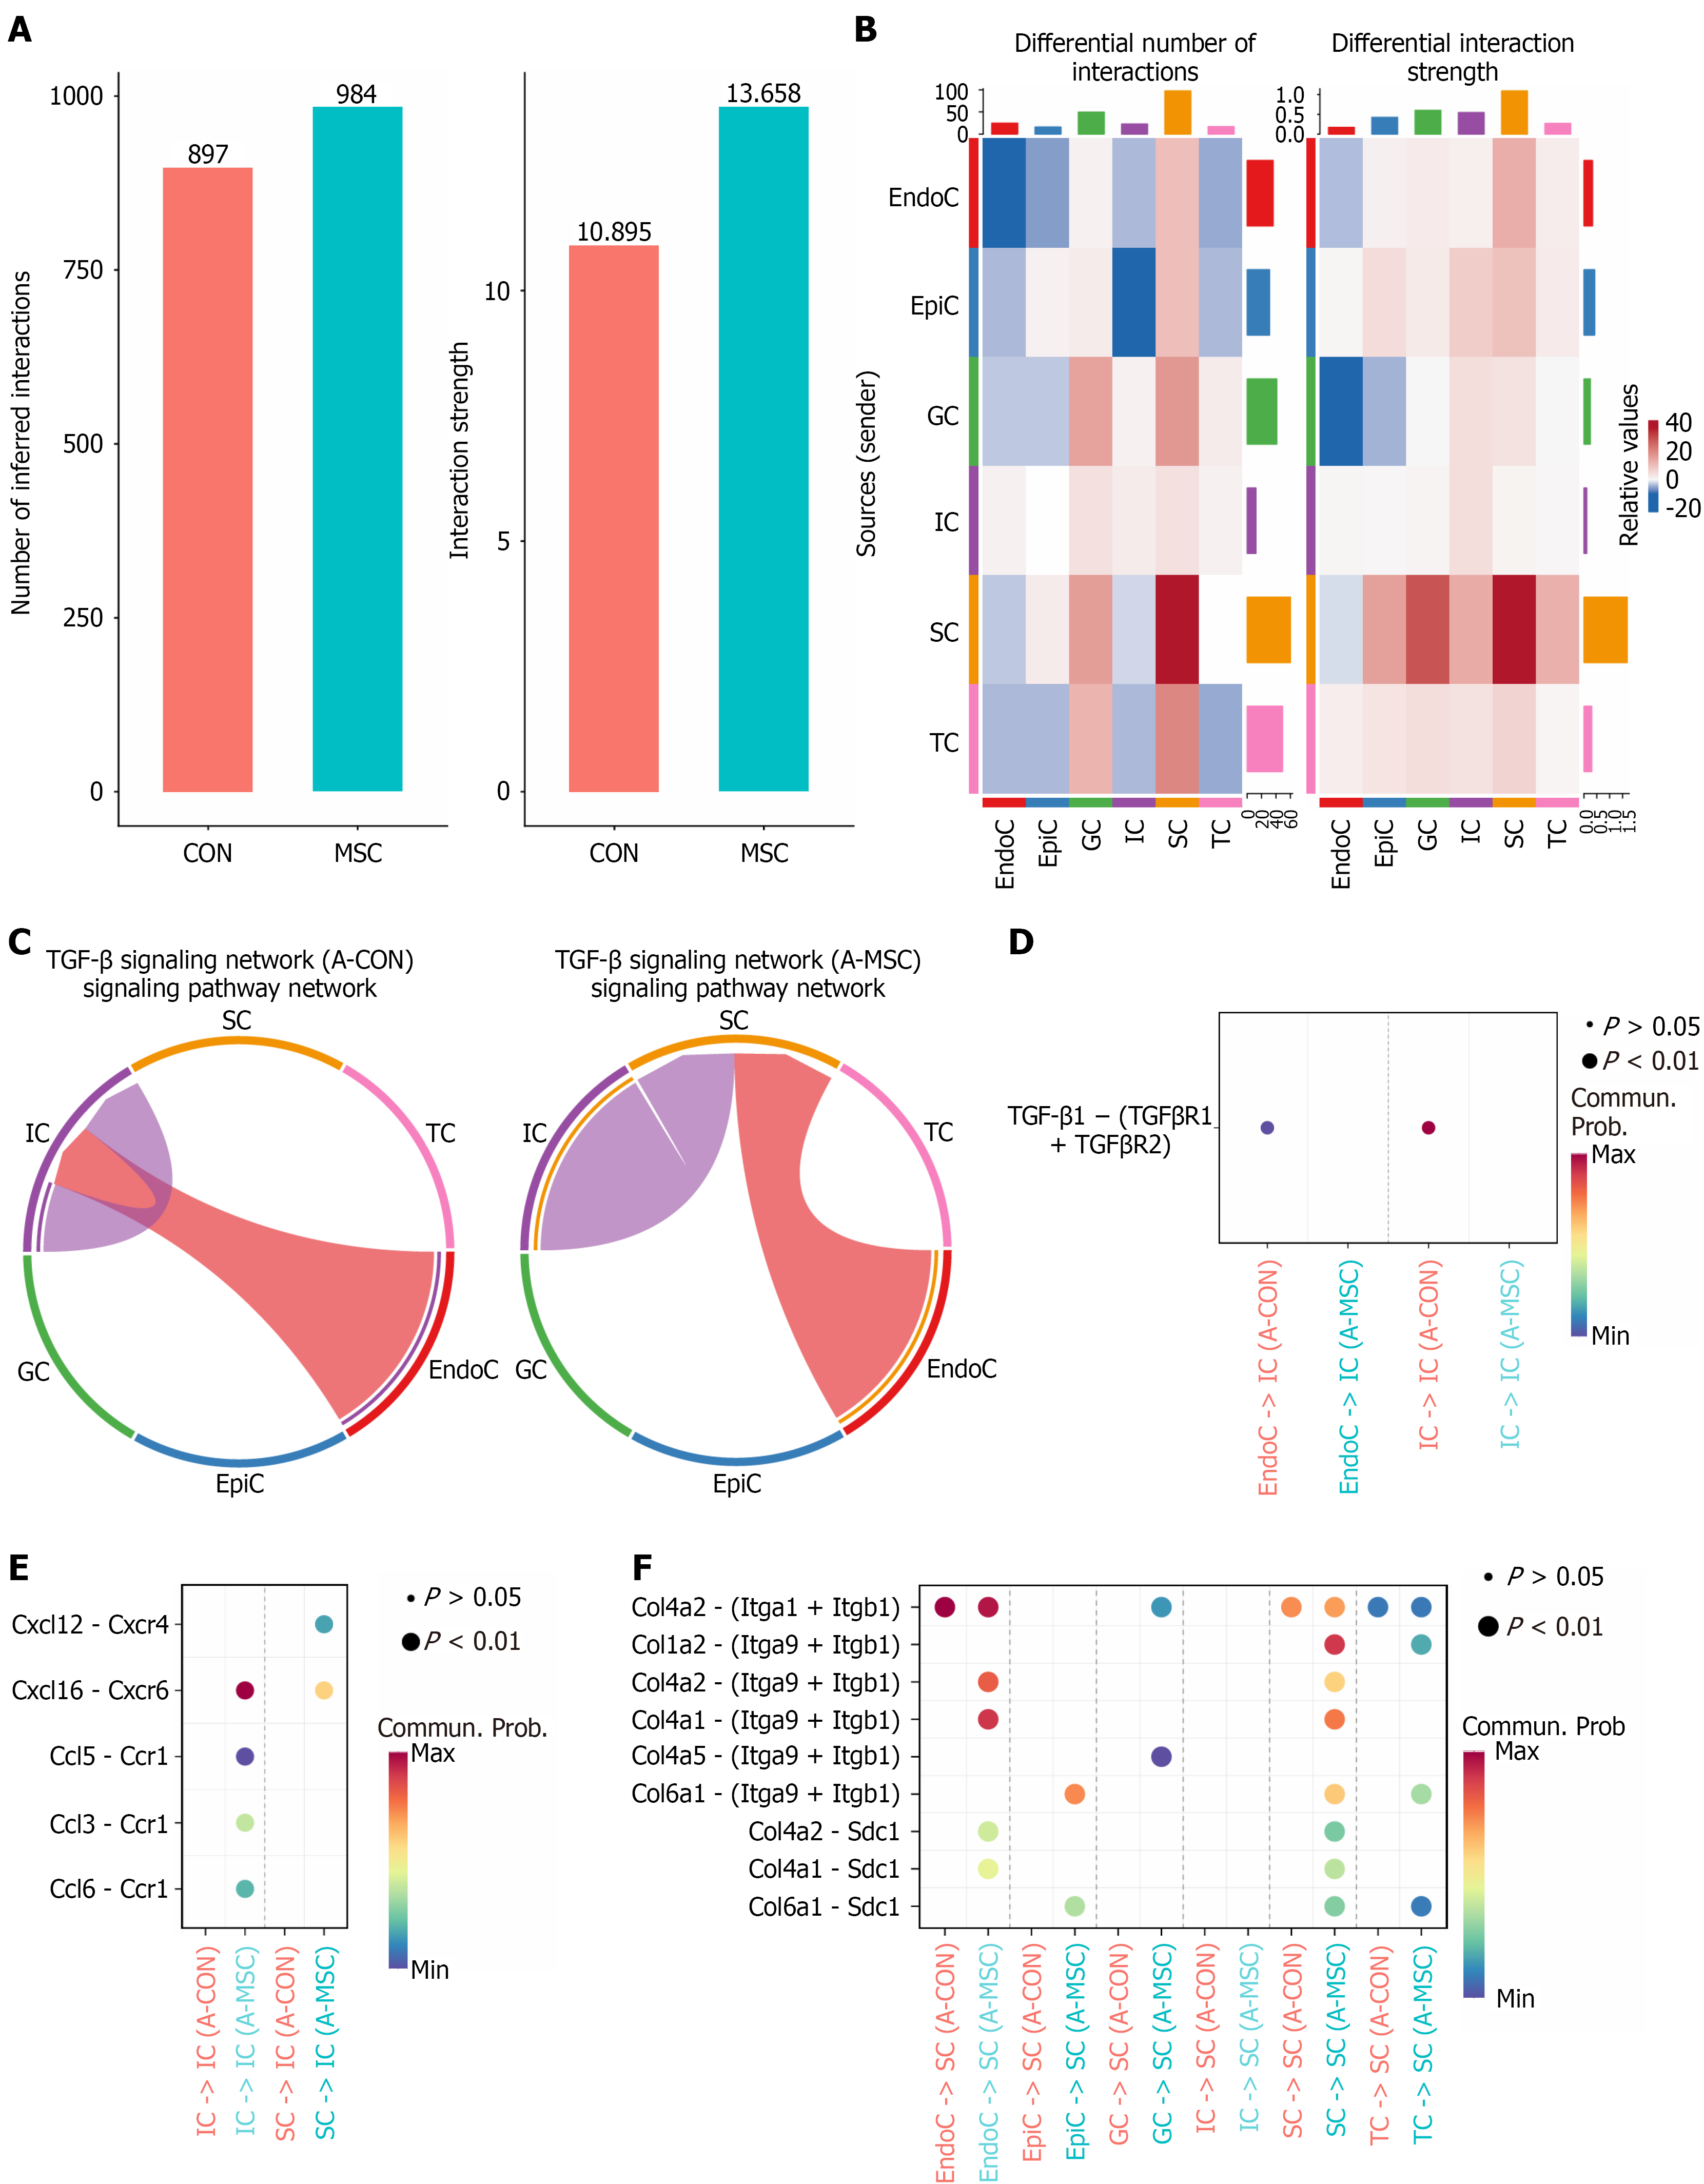
Figure 8 Umbilical cord-derived mesenchymal stem cell transplantation remodels the intercellular communication network in the aged ovary.
A: The total number of inferred interactions (left) and the total interaction strength (right) among all cell populations are increased in the umbilical cord-derived mesenchymal stem cell transplantation (A-MSC) group compared to the aged control (A-CON) group; B: Analysis of interactions identifies stromal cells exhibiting the most significant alterations in signaling pathways following A-MSC; C: Chord diagrams of transforming growth factor (TGF)-β signaling pathway network in A-CON group (left) and A-MSC group (right); D: Alterations in ligand-receptor pairs of the TGF-β signaling pathway; E: Alterations in ligand-receptor pairs of the chemokine pathway; F: Alterations in ligand-receptor pairs of the collagen pathways. GC: Granulosa cell; SC: Stromal cell; TC: Theca cell; EndoC: Endothelial cell; EpiC: Epithelial cell; IC: Immune cell; A-CON: Aged control; A-MSC: Umbilical cord-derived mesenchymal stem cell transplantation; TGF: Transforming growth factor.
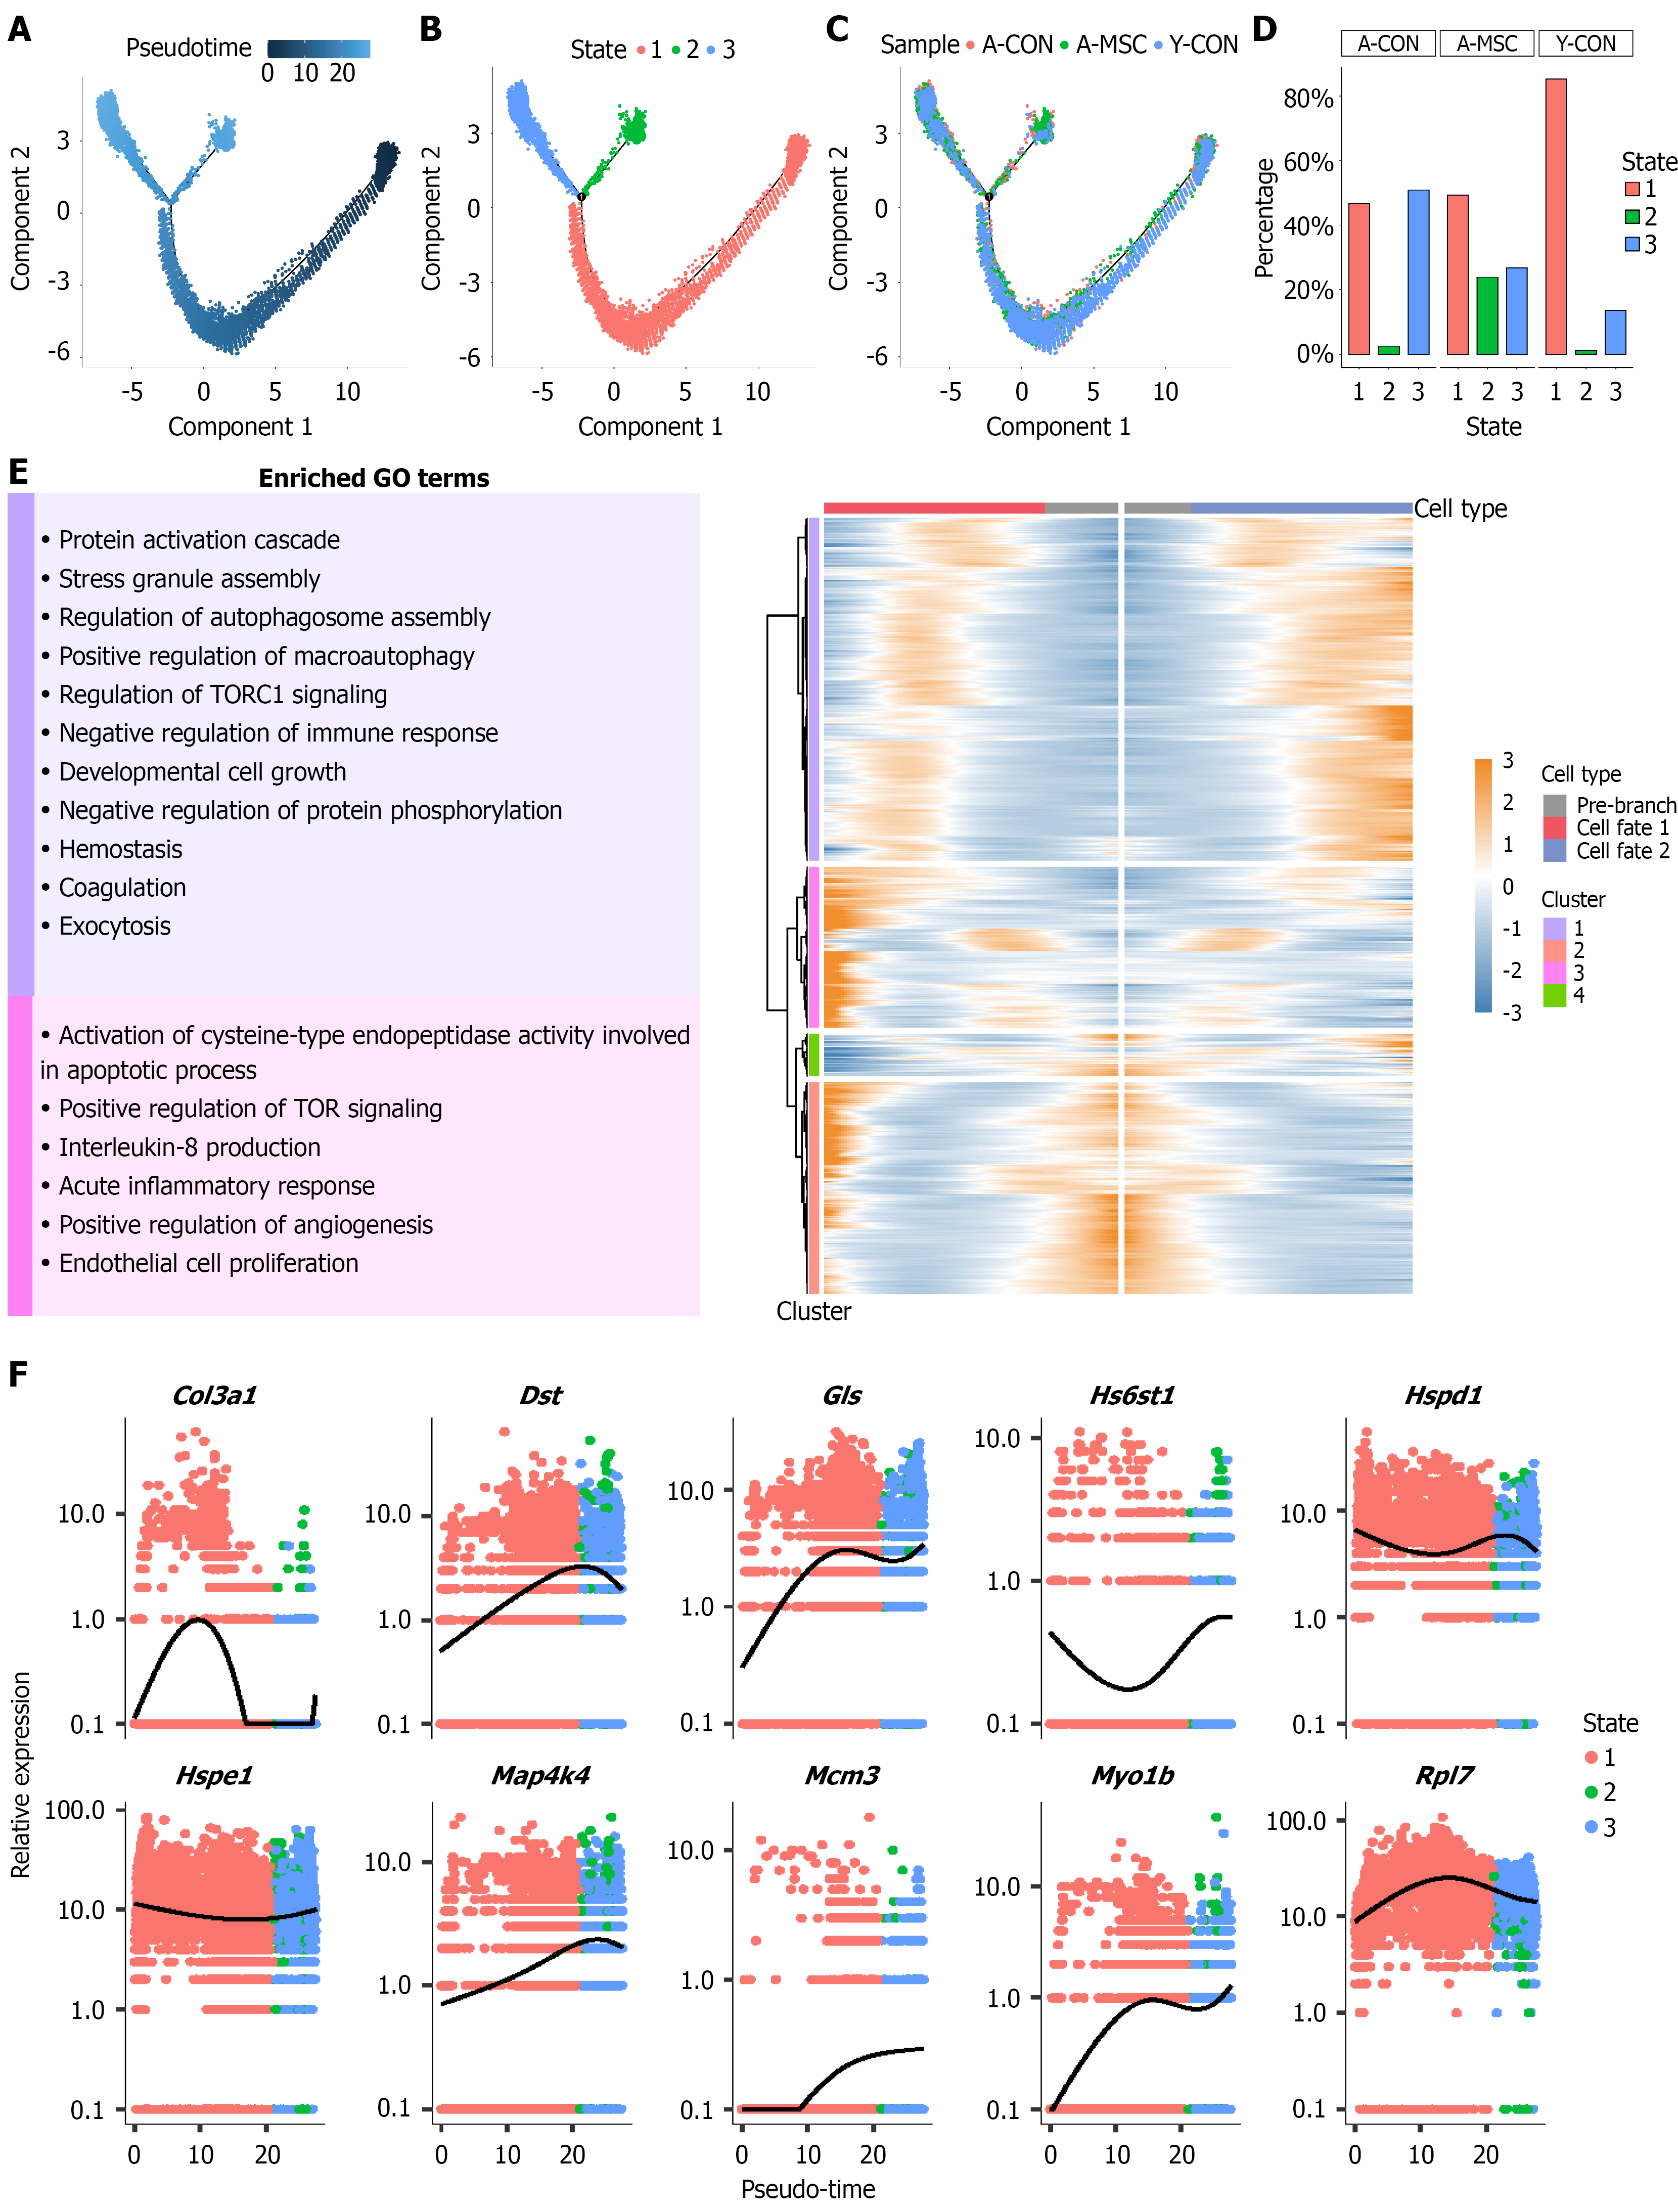
Figure 9 Pseudotime trajectory analysis reveals umbilical cord-derived mesenchymal stem cells reprogram granulosa cell fate in the aged ovary.
A: Pseudotime trajectory analysis of granulosa cells; B: The trajectory reveals three distinct cell states (state 1, 2, 3), with a bifurcation from state 1 leading to two fates (state 2 and state 3); C: Cells are colored by pseudotime and experimental group; D: Bar chart showing the distribution of granulosa cells across the three states in each experimental group. Umbilical cord-derived mesenchymal stem cells transplantation significantly altered the fate distribution, increasing the proportion of cells in state 2 and decreasing the proportion in state 3 compared to the aged control group; E: Heatmap of gene expression dynamics along the two cell fates during the pseudotime trajectory and Gene Ontology enrichment analysis of the biological processes associated with the differentially expressed genes defining cell fate 1 and cell fate 2; F: Expression patterns of the top 10 differentially expressed genes between the two cell fates. Y-CON: Young control; A-CON: Aged control; A-MSC: Umbilical cord-derived mesenchymal stem cell transplantation; GO: Gene Ontology; TORC1: Target of rapamycin complex 1; TOR: Target of rapamycin.
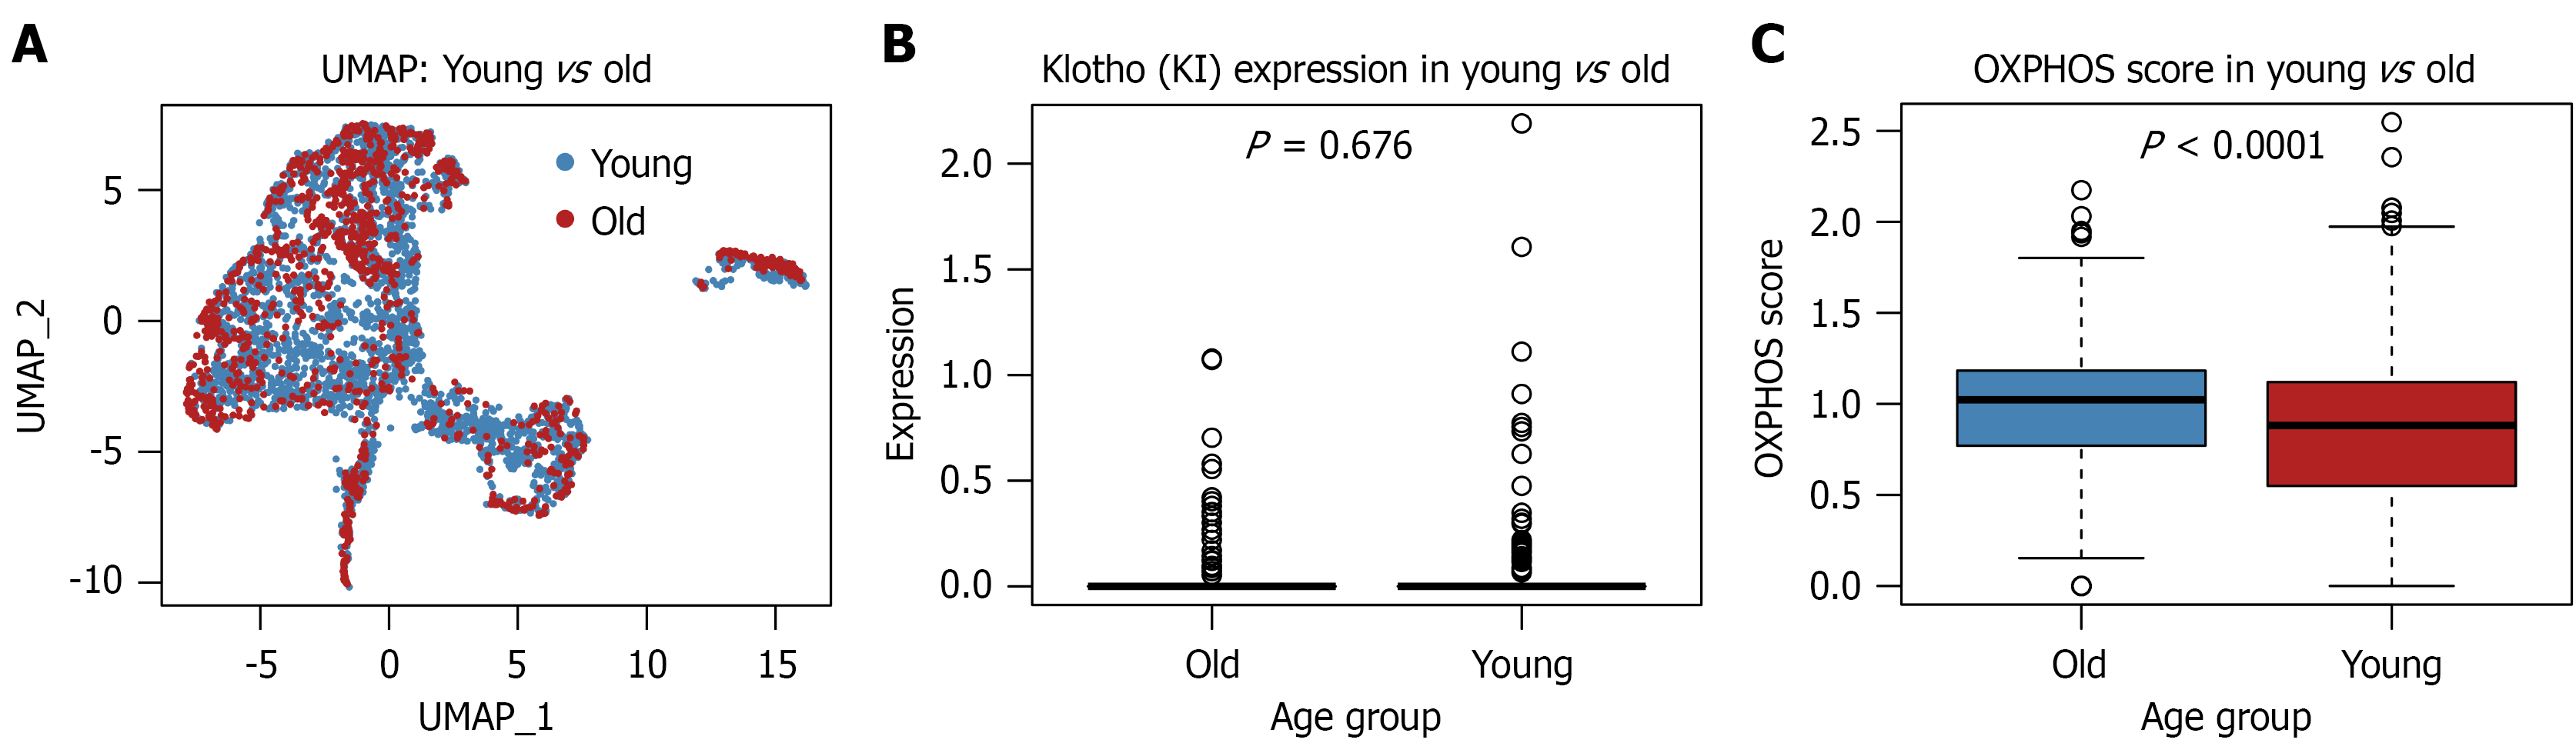
Figure 10 External validation of ovarian aging-associated transcriptional alterations using GSE232309.
A: UMAP of granulosa cells from young and aged mice showing substantial overlap between age groups; B: Klotho expression in young and aged granulosa cells; C: Oxidative phosphorylation-related gene signature score calculated from representative oxidative phosphorylation genes. OXPHOS: Oxidative phosphorylation.
- Citation: Zhang JN, Tian S, Guo XM, Zhang Q, Shang J, Yao YQ. Therapeutic potential of umbilical cord-derived mesenchymal stem cells in ameliorating ovarian aging: Insights from single-cell analysis. World J Stem Cells 2026; 18(10): 119325
- URL: https://www.wjgnet.com/1948-0210/full/v18/i10/119325.htm
- DOI: https://dx.doi.org/10.4252/wjsc.119325