©The Author(s) 2025.
World J Stem Cells. Aug 26, 2025; 17(8): 107076
Published online Aug 26, 2025. doi: 10.4252/wjsc.v17.i8.107076
Published online Aug 26, 2025. doi: 10.4252/wjsc.v17.i8.107076
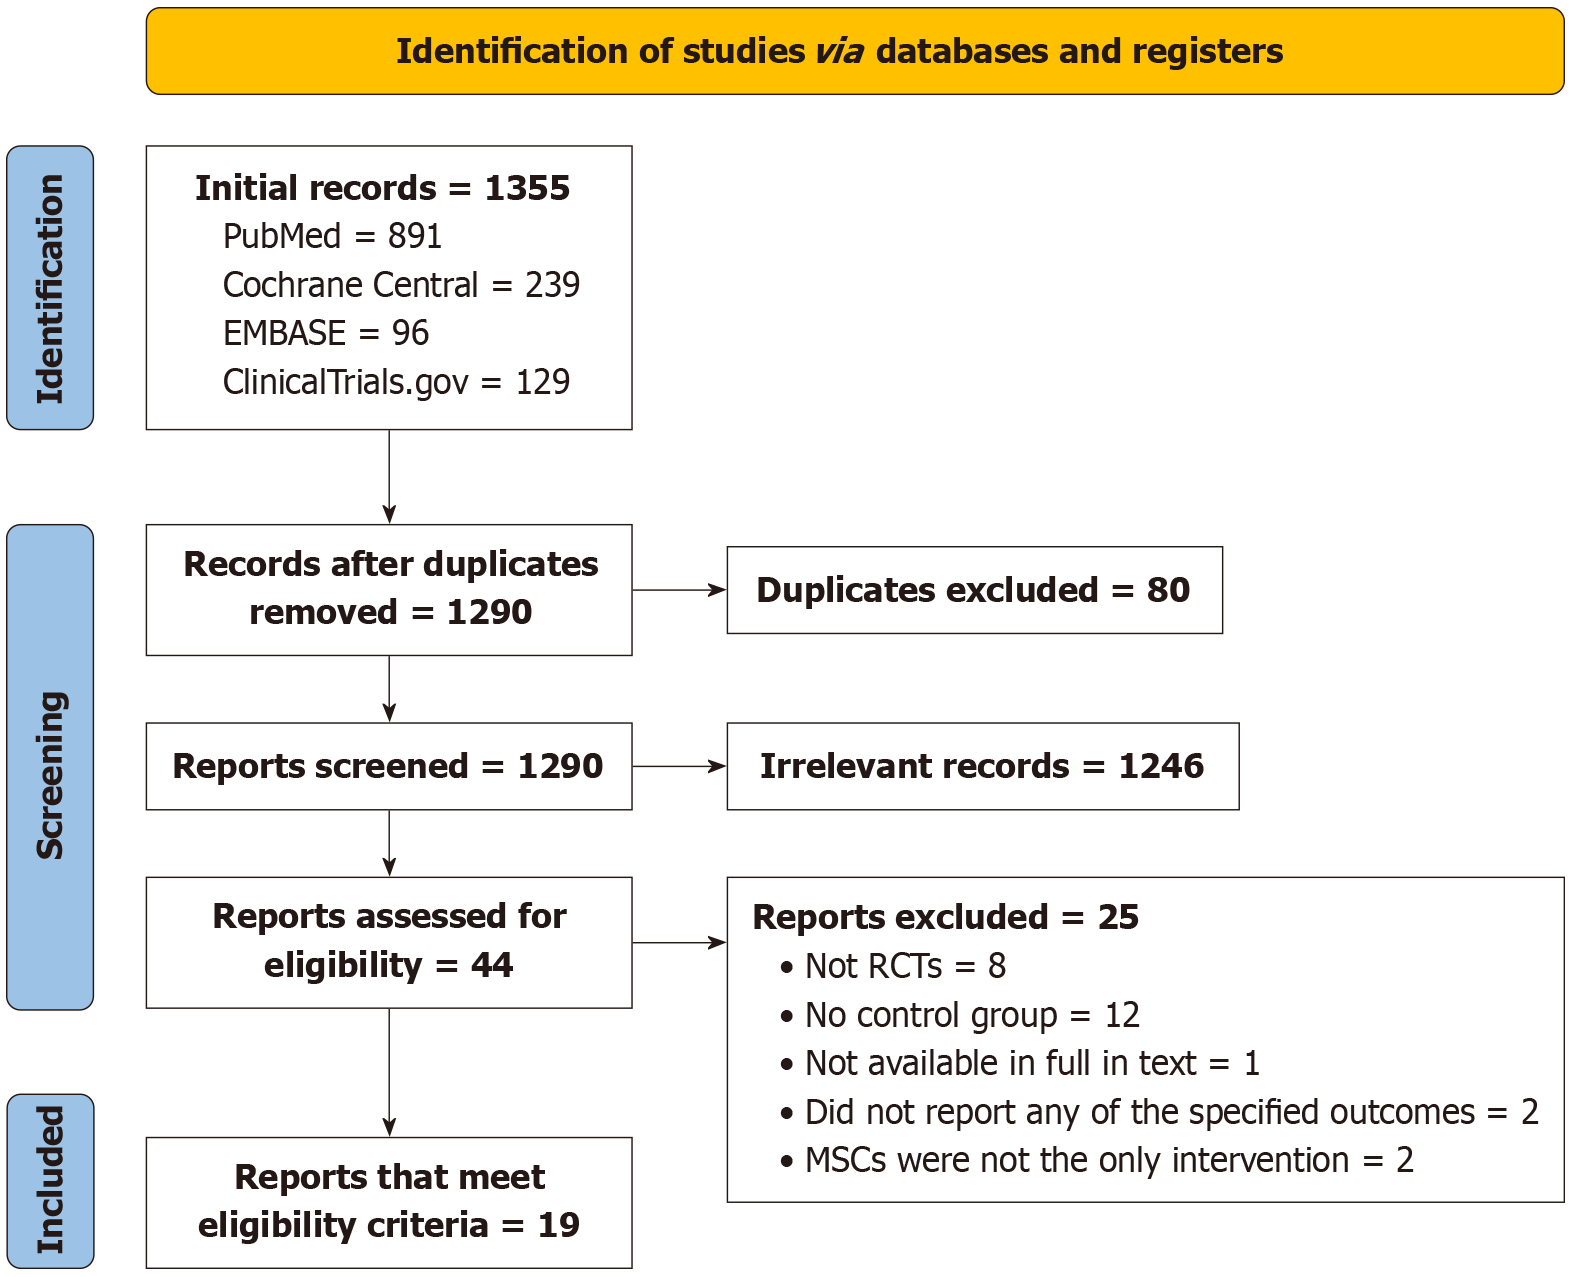
Figure 1 Study selection flow diagram (Preferred Reporting Items for Systematic Reviews and Meta-analysis chart).
RCT: Randomized controlled trial; MSCs: Mesenchymal stem cells.
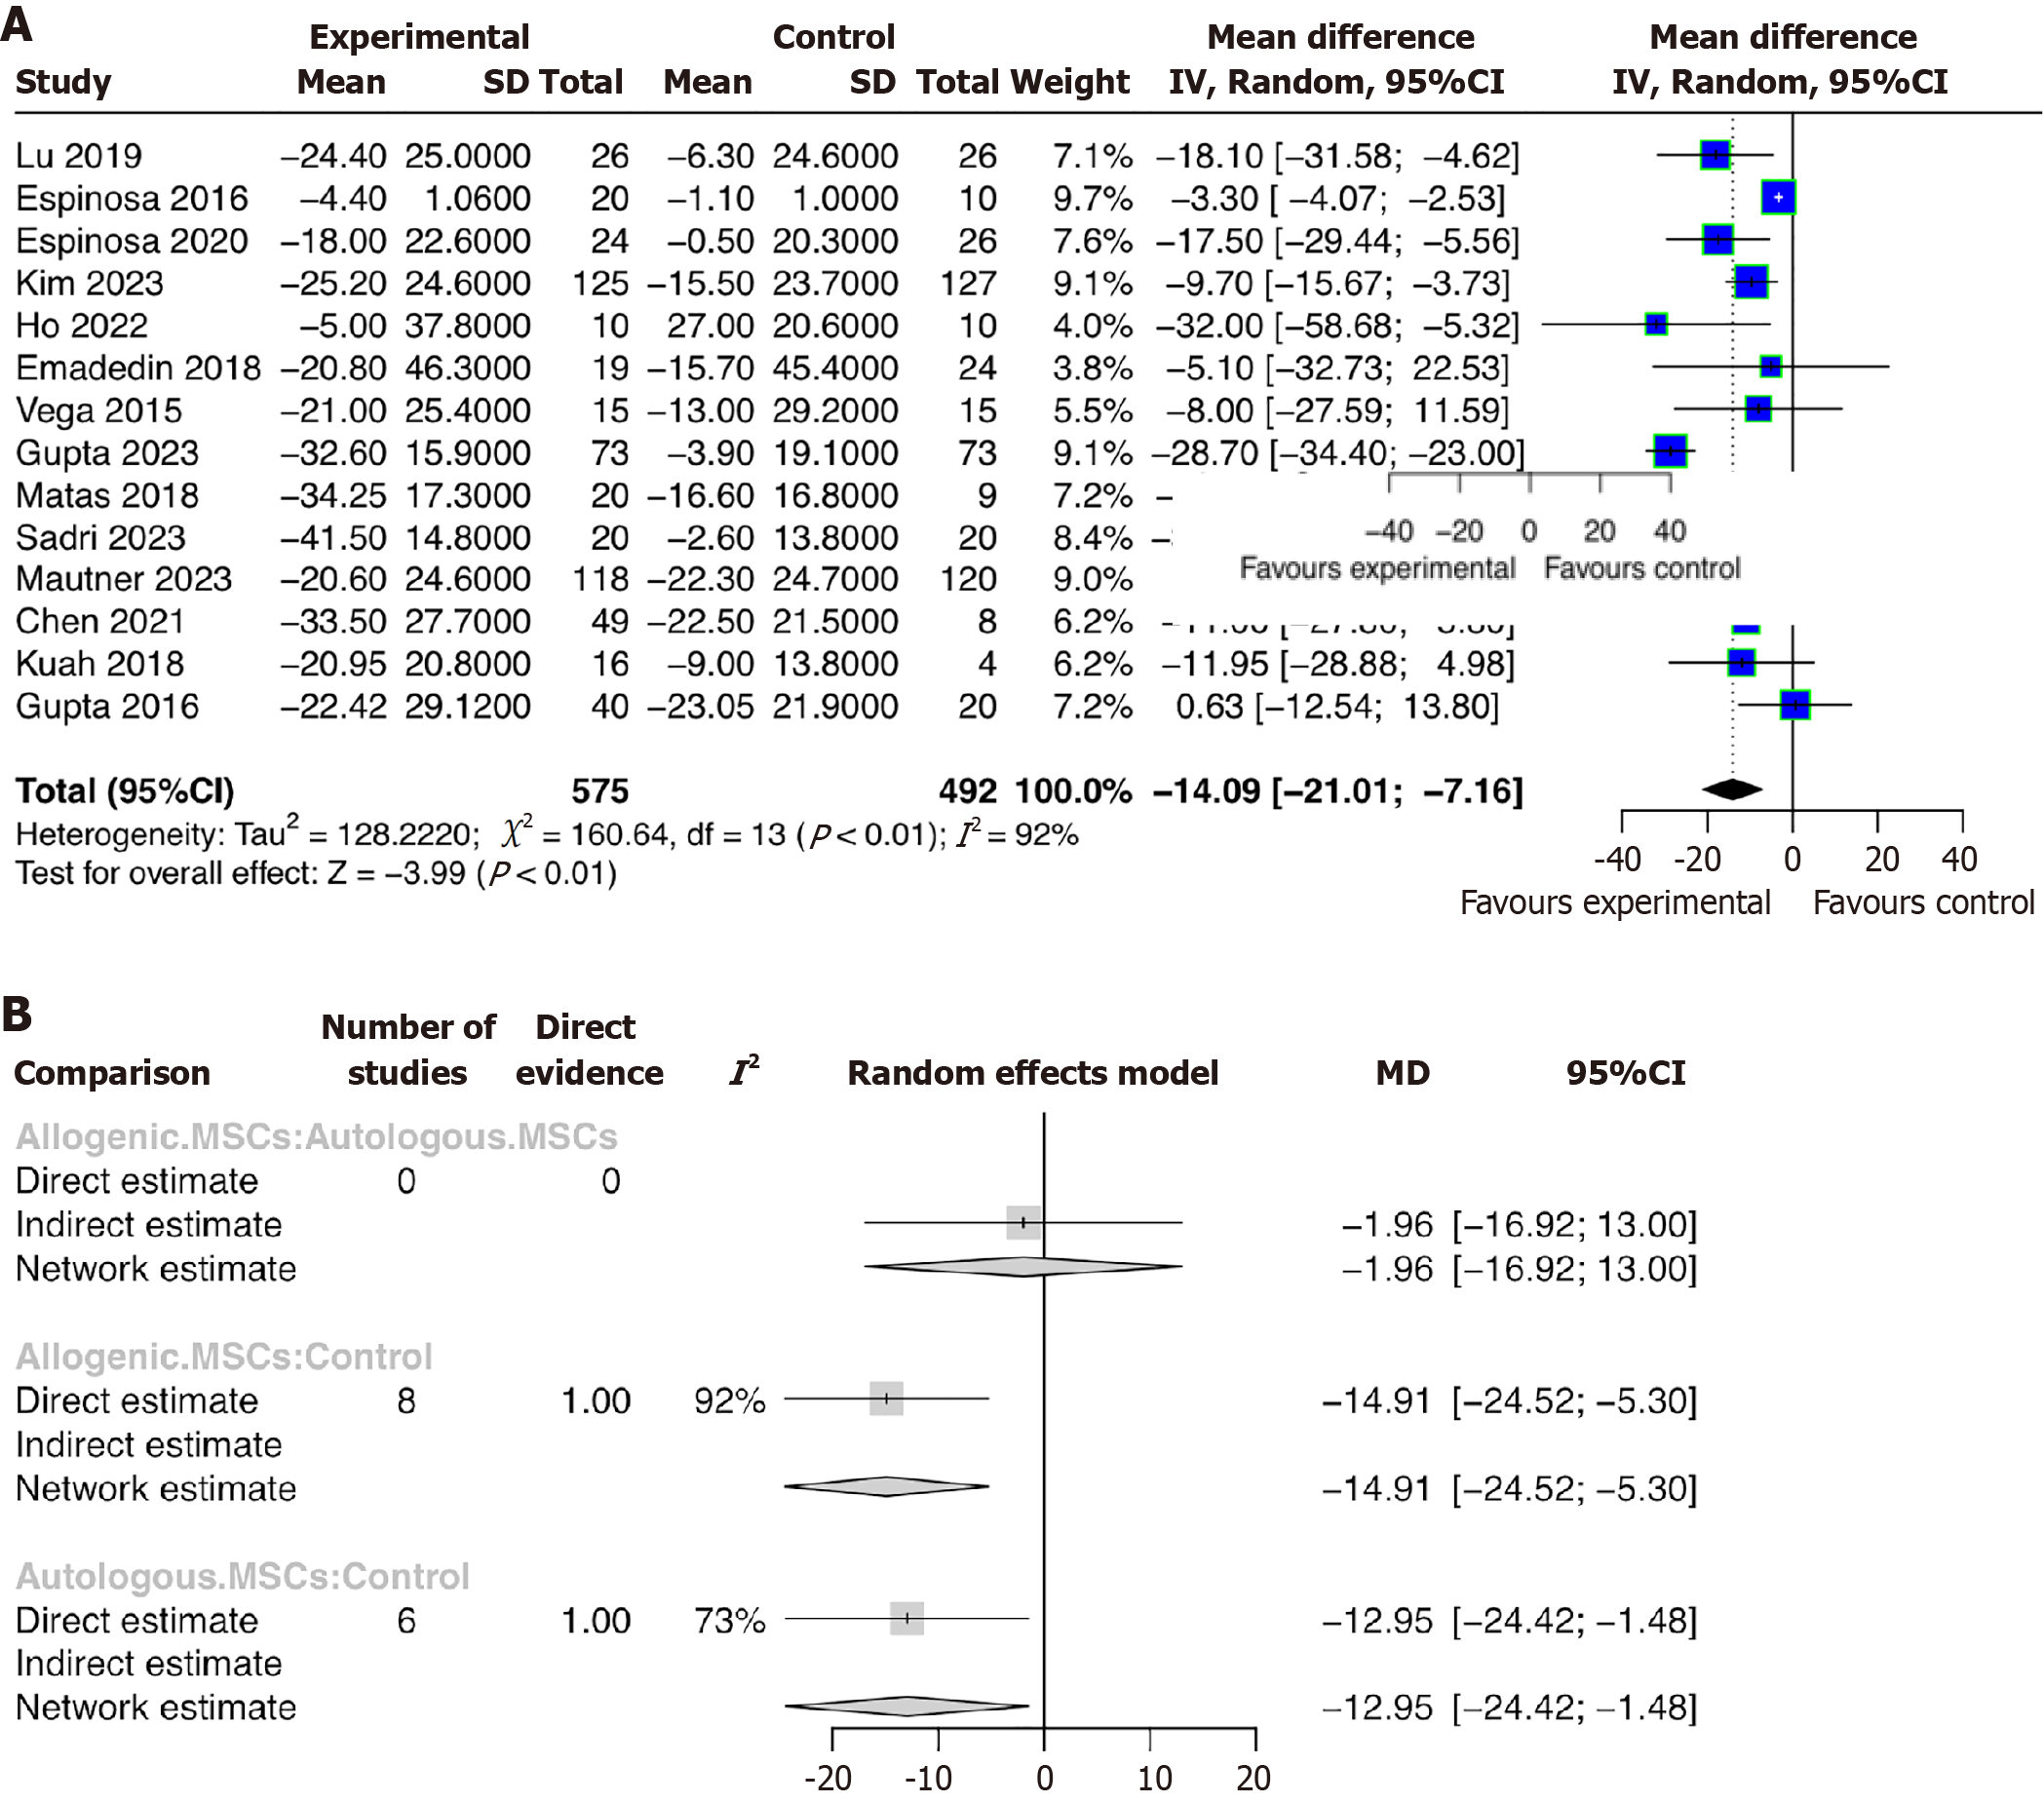
Figure 2 Visual analogue scale.
A: Conventional meta-analysis of visual analogue scale; B: Network meta-analysis forest plot of visual analogue scale score. MD: Mean difference; CI: Confidence interval; SD: Standard deviation; MSC: Mesenchymal stem cells.
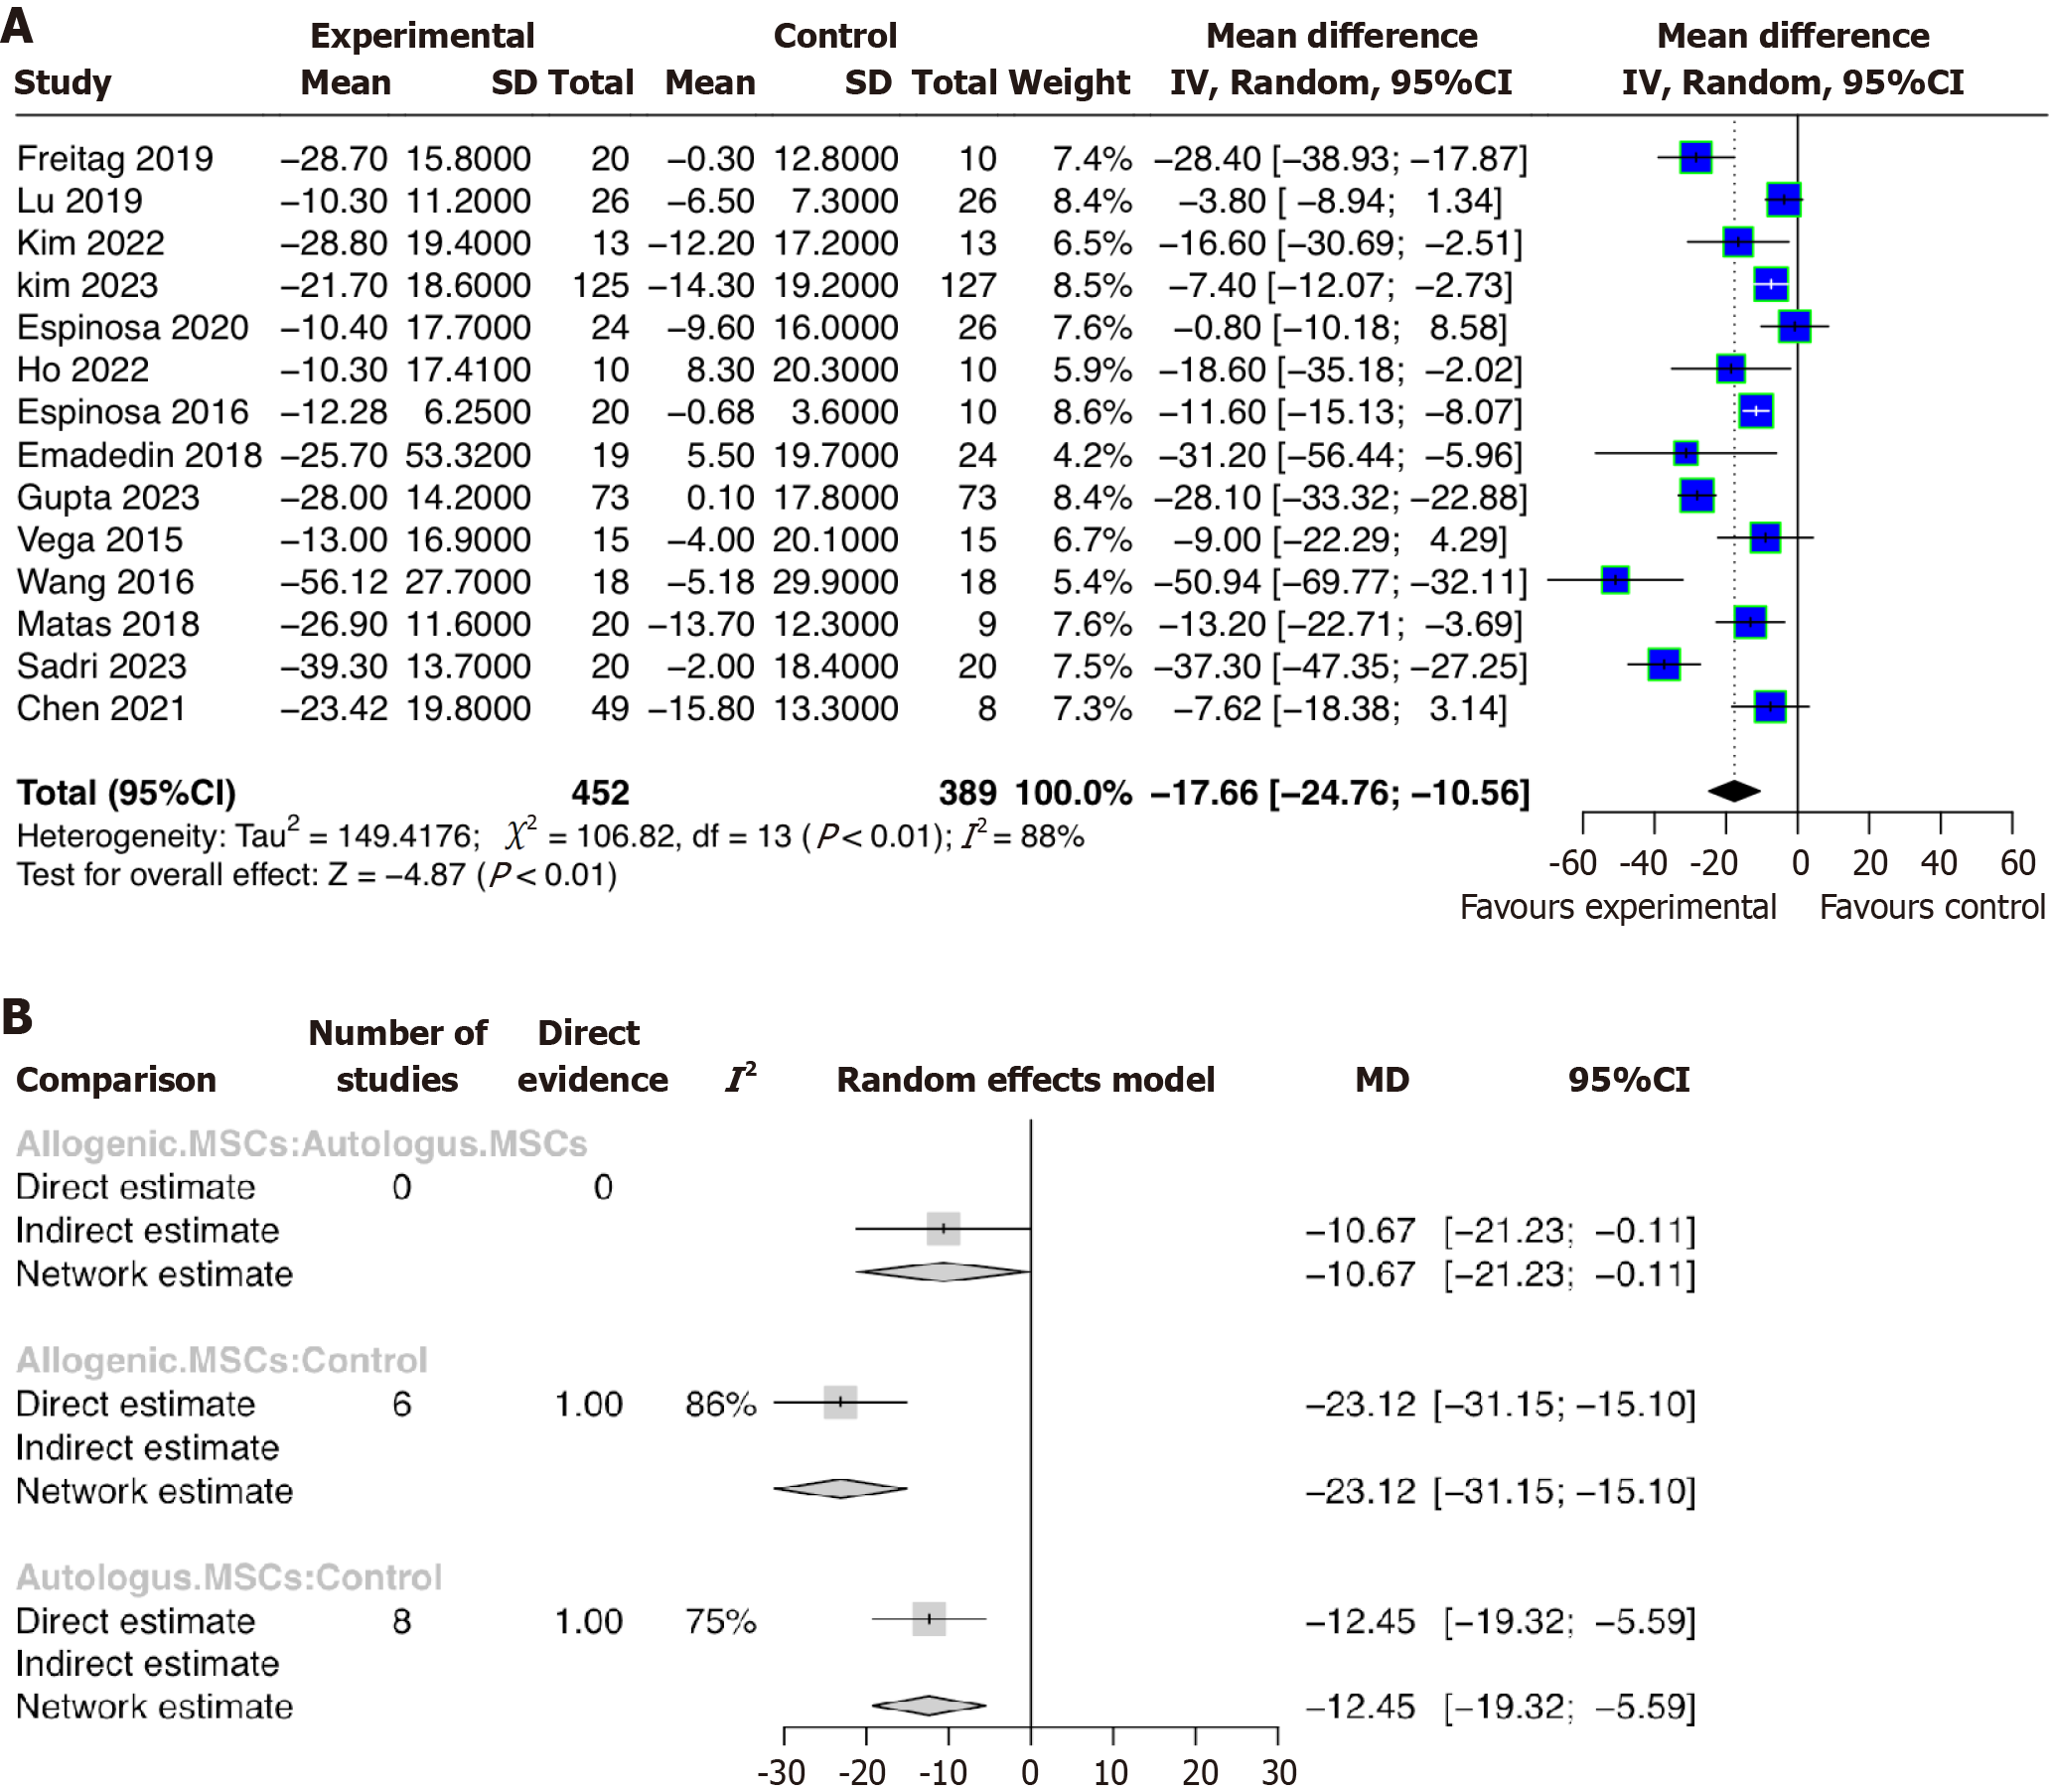
Figure 3 Western Ontario and McMaster Universities Arthritis Index.
A: Conventional meta-analysis of Western Ontario and McMaster Universities Arthritis Index; B: Network meta-analysis forest plot of Western Ontario and McMaster Universities Arthritis Index. MD: Mean difference; CI: Confidence interval; SD: Standard deviation; MSC: Mesenchymal stem cell.
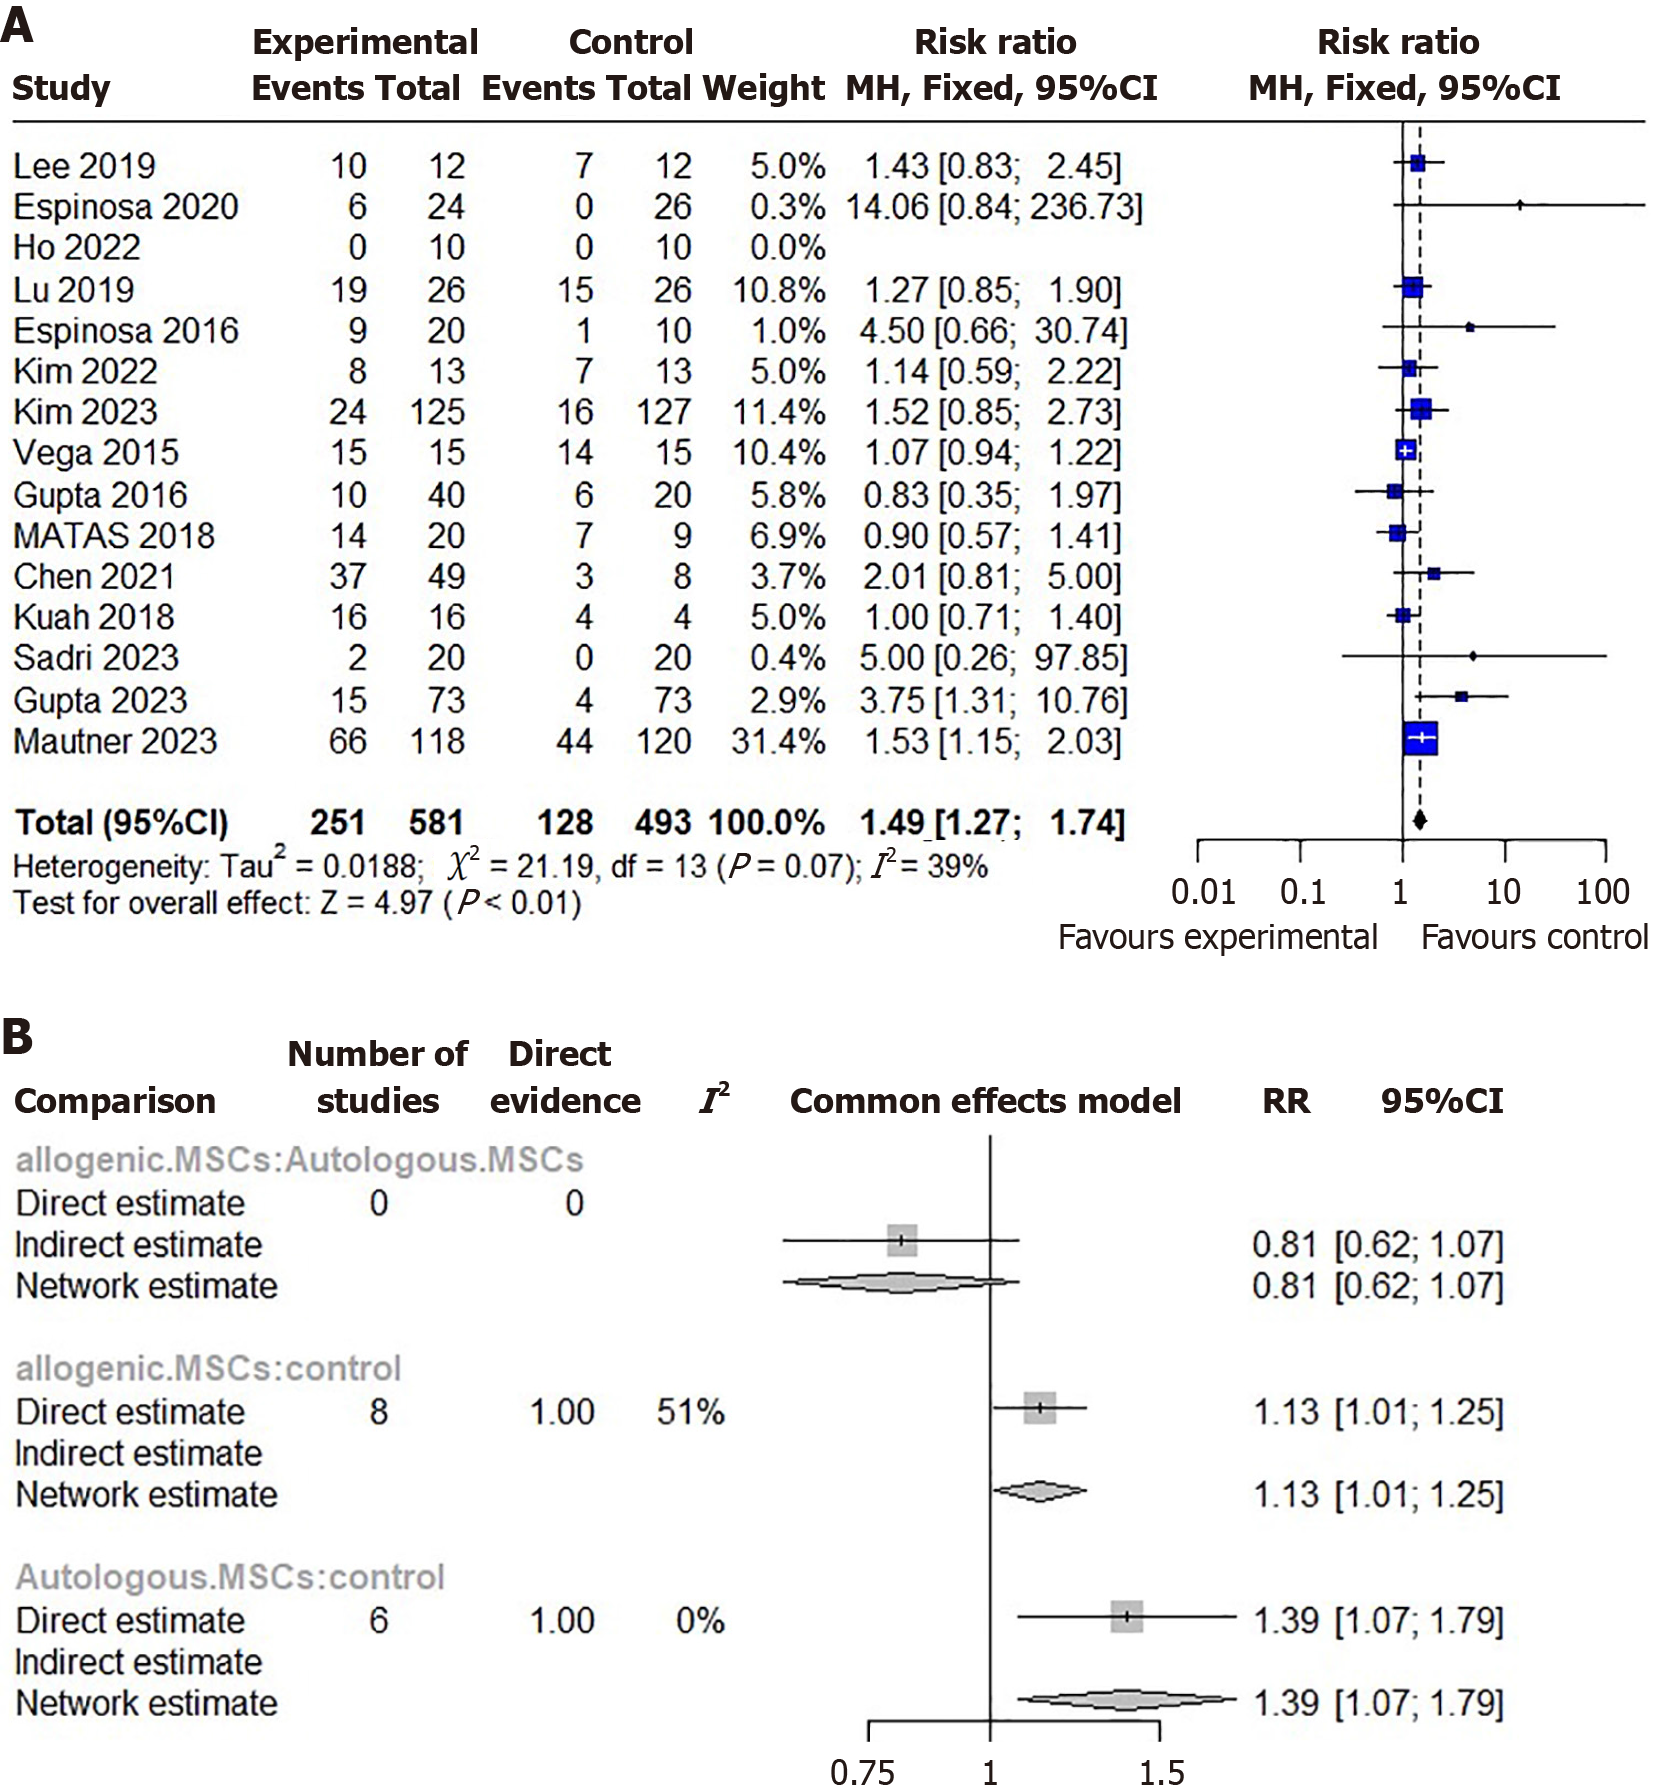
Figure 4 Joint-related adverse events.
A: Conventional meta-analysis of joint-related adverse events; B: Network meta-analysis forest plot of adverse events. RR: Risk ratio; CI: Confidence interval; MSC: Mesenchymal stem cells; MH: Mantel-Haenszel analysis.
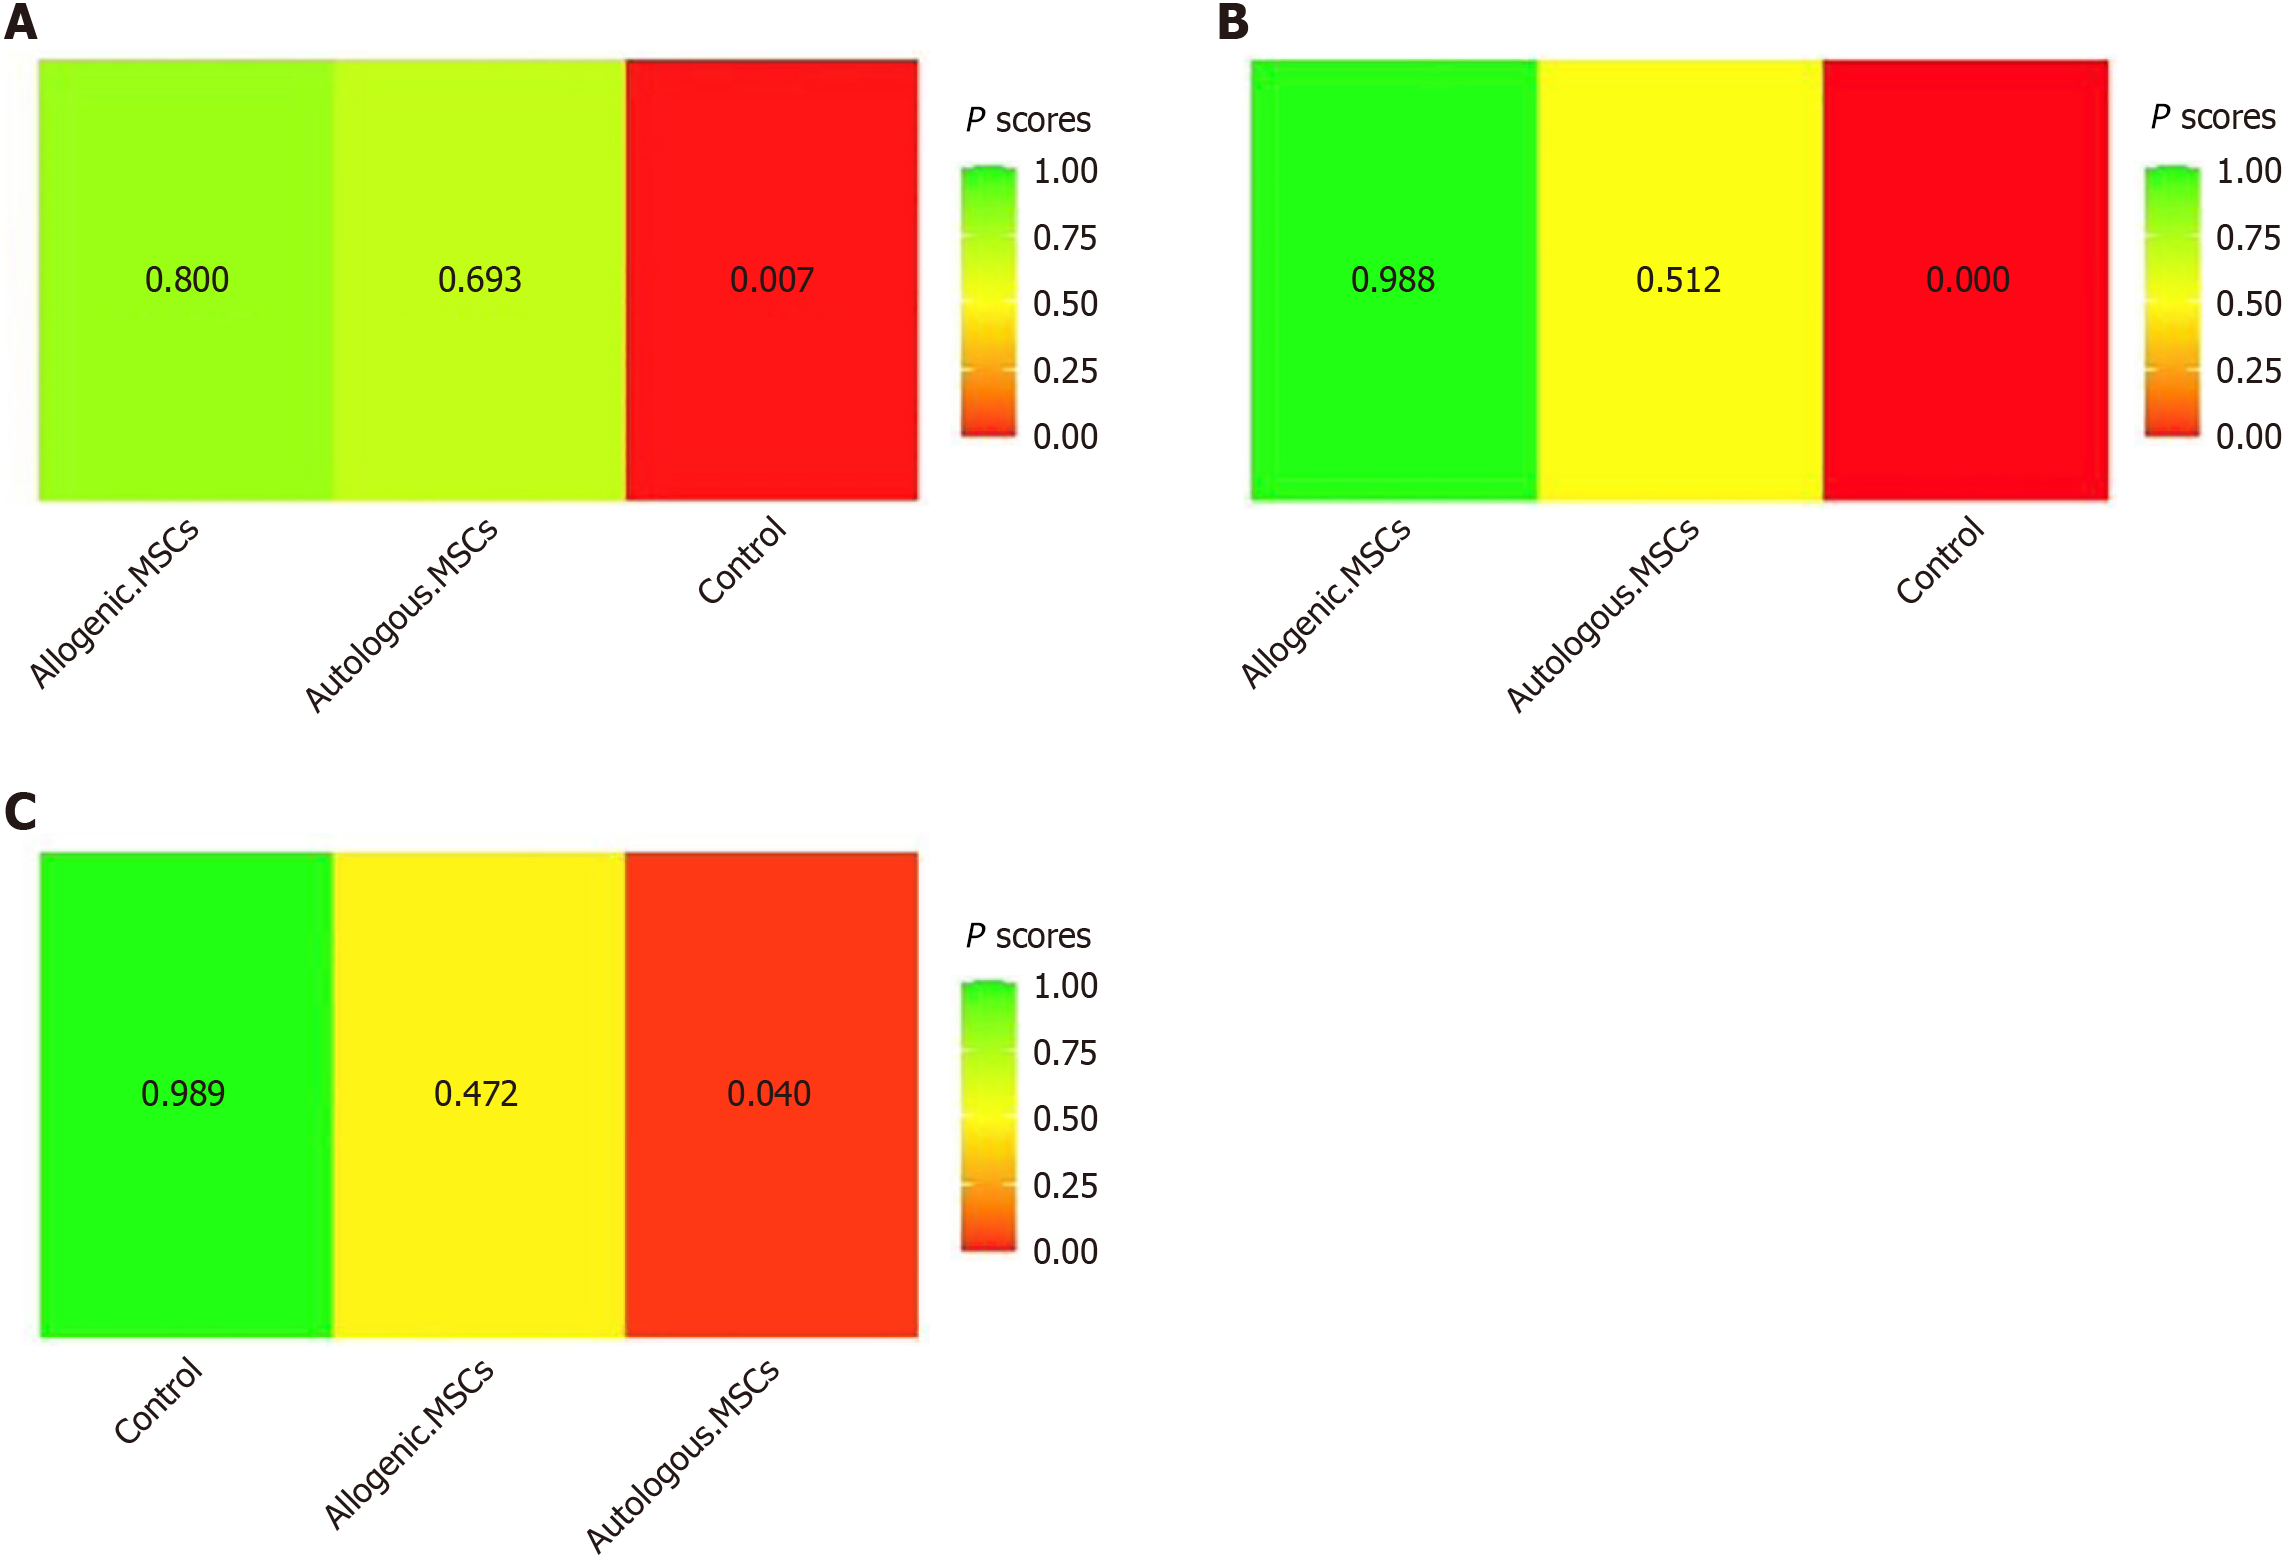
Figure 5 The surface under the cumulative ranking curve probability of ranking plot for the effect of different treatment arms.
A: Visual analogue scale; B: Western Ontario and McMaster Universities Arthritis Index; C: Adverse events. MSCs: Mesenchymal stem cells.
Figure 6 Network graphs.
A: Visual analogue scale; B: Western Ontario and McMaster Universities Arthritis Index; C: Adverse events. MSCs: Mesenchymal stem cells.
- Citation: Safwan M, Bourgleh MS, Baroudi L, Almsned A, AlBalawi R, Aibour B, AlFawaz S, Bourgleh SM, Haider KH. Entering the era of living biopharmaceuticals for treating knee osteoarthritis: A systematic review and network meta-analysis. World J Stem Cells 2025; 17(8): 107076
- URL: https://www.wjgnet.com/1948-0210/full/v17/i8/107076.htm
- DOI: https://dx.doi.org/10.4252/wjsc.v17.i8.107076


