Copyright
©The Author(s) 2025.
World J Stem Cells. Jun 26, 2025; 17(6): 104367
Published online Jun 26, 2025. doi: 10.4252/wjsc.v17.i6.104367
Published online Jun 26, 2025. doi: 10.4252/wjsc.v17.i6.104367
Figure 1 Senescence phenotype and endoplasmic reticulum stress increase in adipose-derived mesenchymal stem cells of a hypertrophic obesity mouse model.
A: Body weight of hypertrophic obesity model mice and control mice (n = 5); B: Hematoxylin and eosin staining of subcutaneous adipose tissue sections of control and hypertrophic obesity mice, bar = 50 μm; C: Subcutaneous adipocyte diameter in tissue sections analyzed by ImageJ (n = 10); D: Number of adipose-derived mesenchymal stem cells (ASCs) per gram adipose tissue in control and hypertrophic obesity mice (n = 5); E: Population doubling time of control and hypertrophic obesity ASCs (n = 3); F: SA-B-Gal staining of control and hypertrophic obesity ASCs, bar = 100 μm; G: Percentage of SA-B-Gal staining positive cells analyzed by ImageJ software (n = 3); H: Oil Red O staining of adipogenic-induced control and hypertrophic obesity ASCs, bar = 100 μm; I: Percentage of positive Oil Red O stained area to cell number (n = 3); J: Quantitative polymerase chain reaction analysis of the relative mRNA expression of senescent markers (p16 and p21), senescence-associated secretory phenotype-related genes (interleukin 6 [IL6], C-C motif ligand 2 [CCL2], and tumor necrosis factor alpha [Tnfa]) and endoplasmic reticulum stress-related genes (binding immunoglobulin protein [Bip], X-box binding protein 1 [Xbp1] and spliced Xbp1 [sXbp1]) in ASCs; K: Western blot of senescent proteins p16, p21 and endoplasmic reticulum stress-related protein inositol-requiring enzyme-1 alpha (IRE1a); L: Relative quantitative analysis of p16, p21, and IRE1a relative to β-actin (ACTB) for Western blot by ImageJ software (n = 3). aP < 0.05; bP < 0.01.
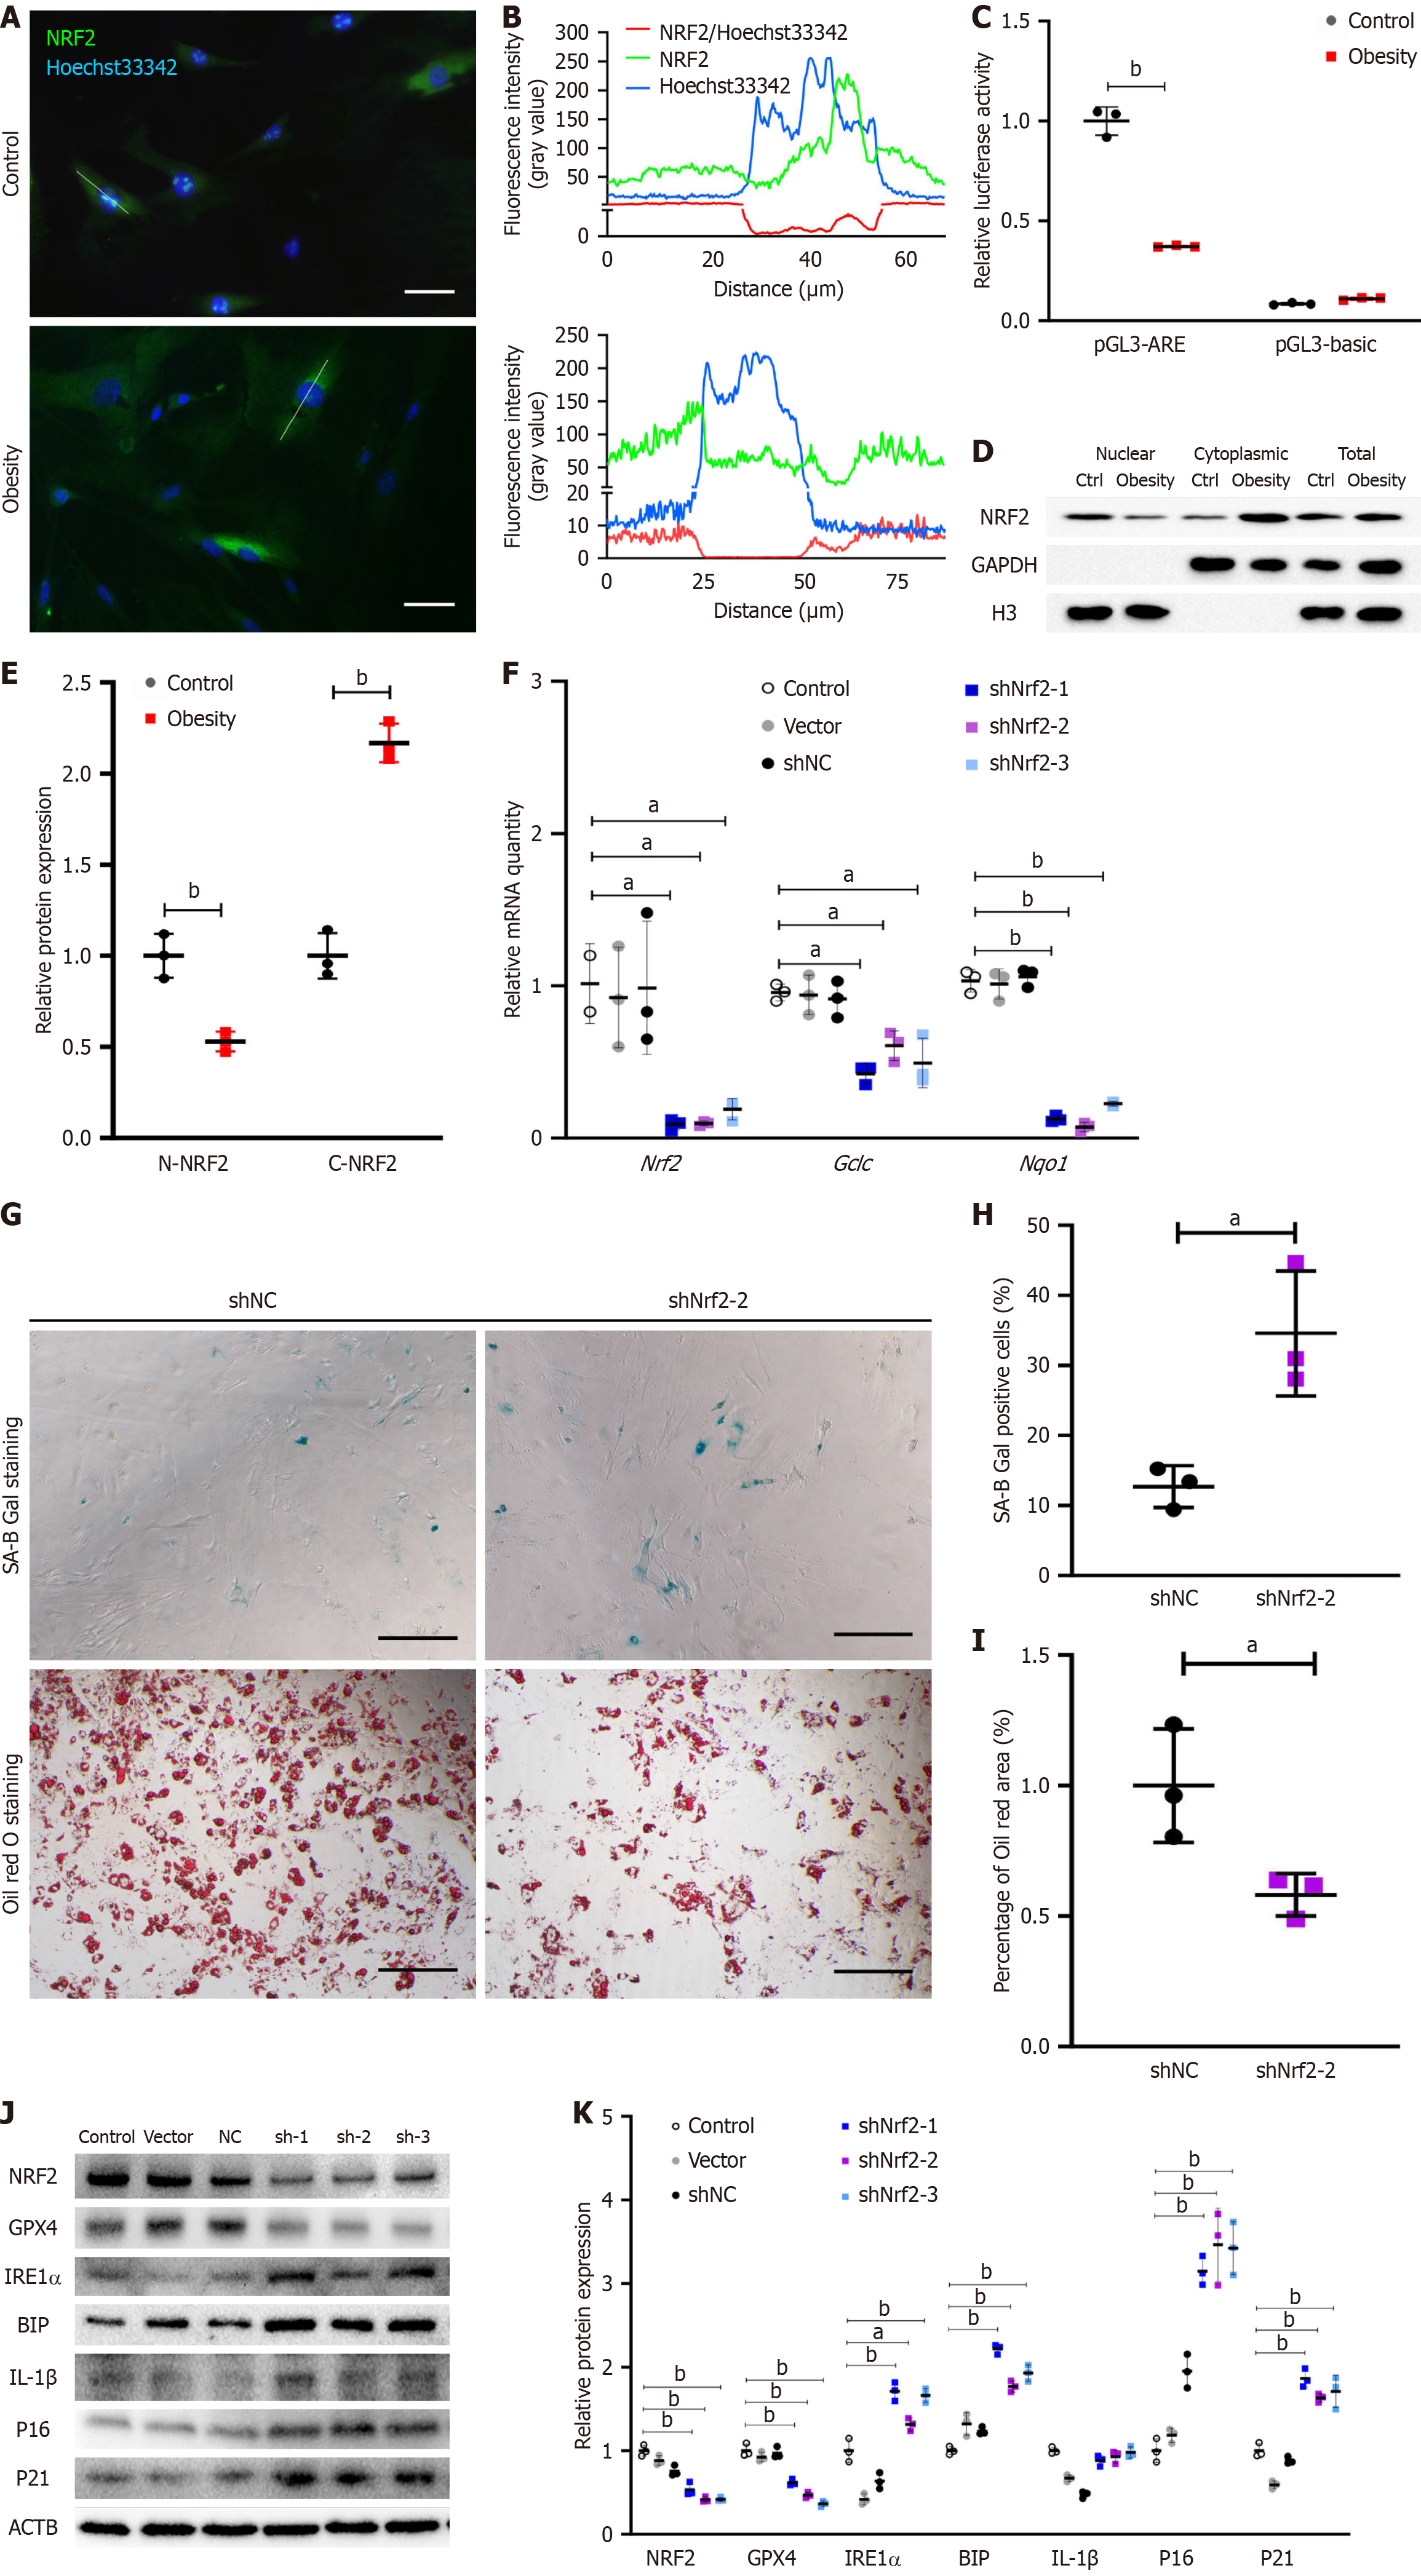
Figure 2 Nuclear factor erythroid-derived 2 knockdown promotes senescence phenotype and endoplasmic reticulum stress in adipose-derived mesenchymal stem cells.
A: Immunofluorescence staining showed nuclear factor erythroid-derived 2 (NRF2) nuclear localization in control adipose-derived mesenchymal stem cells (ASCs), bar = 50 μm; B: Long-axis NRF2 fluorescence intensity of ASCs in control and hypertrophic obesity groups analyzed by ImageJ software; C: Dual-luciferase assay for NRF2 activity in ASCs (n = 3); D: Western blot analysis of NRF2 in nuclear, cytoplasmic, and total cell fractions of ASCs; E: Relative quantitative analysis of nuclear NRF2 relative to H3 and cytoplasmic NRF2 relative to GAPDH for Western blot by ImageJ software (n = 3); F: Relative expression of Nrf2 and its downstream genes relative to β-actin was detected by quantitative polymerase chain reaction in the Nrf2 RNA interference assay of ASCs (n = 3); G: SA-B-Gal staining and Oil Red O staining of control and Nrf2 knockdown ASCs, bar = 100 μm; H: Percentage of SA-B-Gal staining positive cells was analyzed by ImageJ software (n = 3); I: Percentage of positive Oil Red O stained area to cell number (n = 3); J: Western blot of NRF2 and its target glutathione peroxidase 4 (GPX4), senescent proteins p16, p21, and interleukin-1β (IL-1b) and endoplasmic reticulum stress-related proteins inositol-requiring enzyme-1 alpha (IRE1a), binding immunoglobulin protein (BIP) in control and Nrf2 knockdown ASCs; K: Relative quantitative analysis of NRF2, senescent proteins and endoplasmic reticulum stress-related proteins relative to β-actin (ACTB) for Western blotting by ImageJ software (n = 3). aP < 0.05; bP < 0.01. Gclc: Glutamate cysteine ligase catalytic; Nqo1: NAD(P)H:quinone oxidoreductase 1.
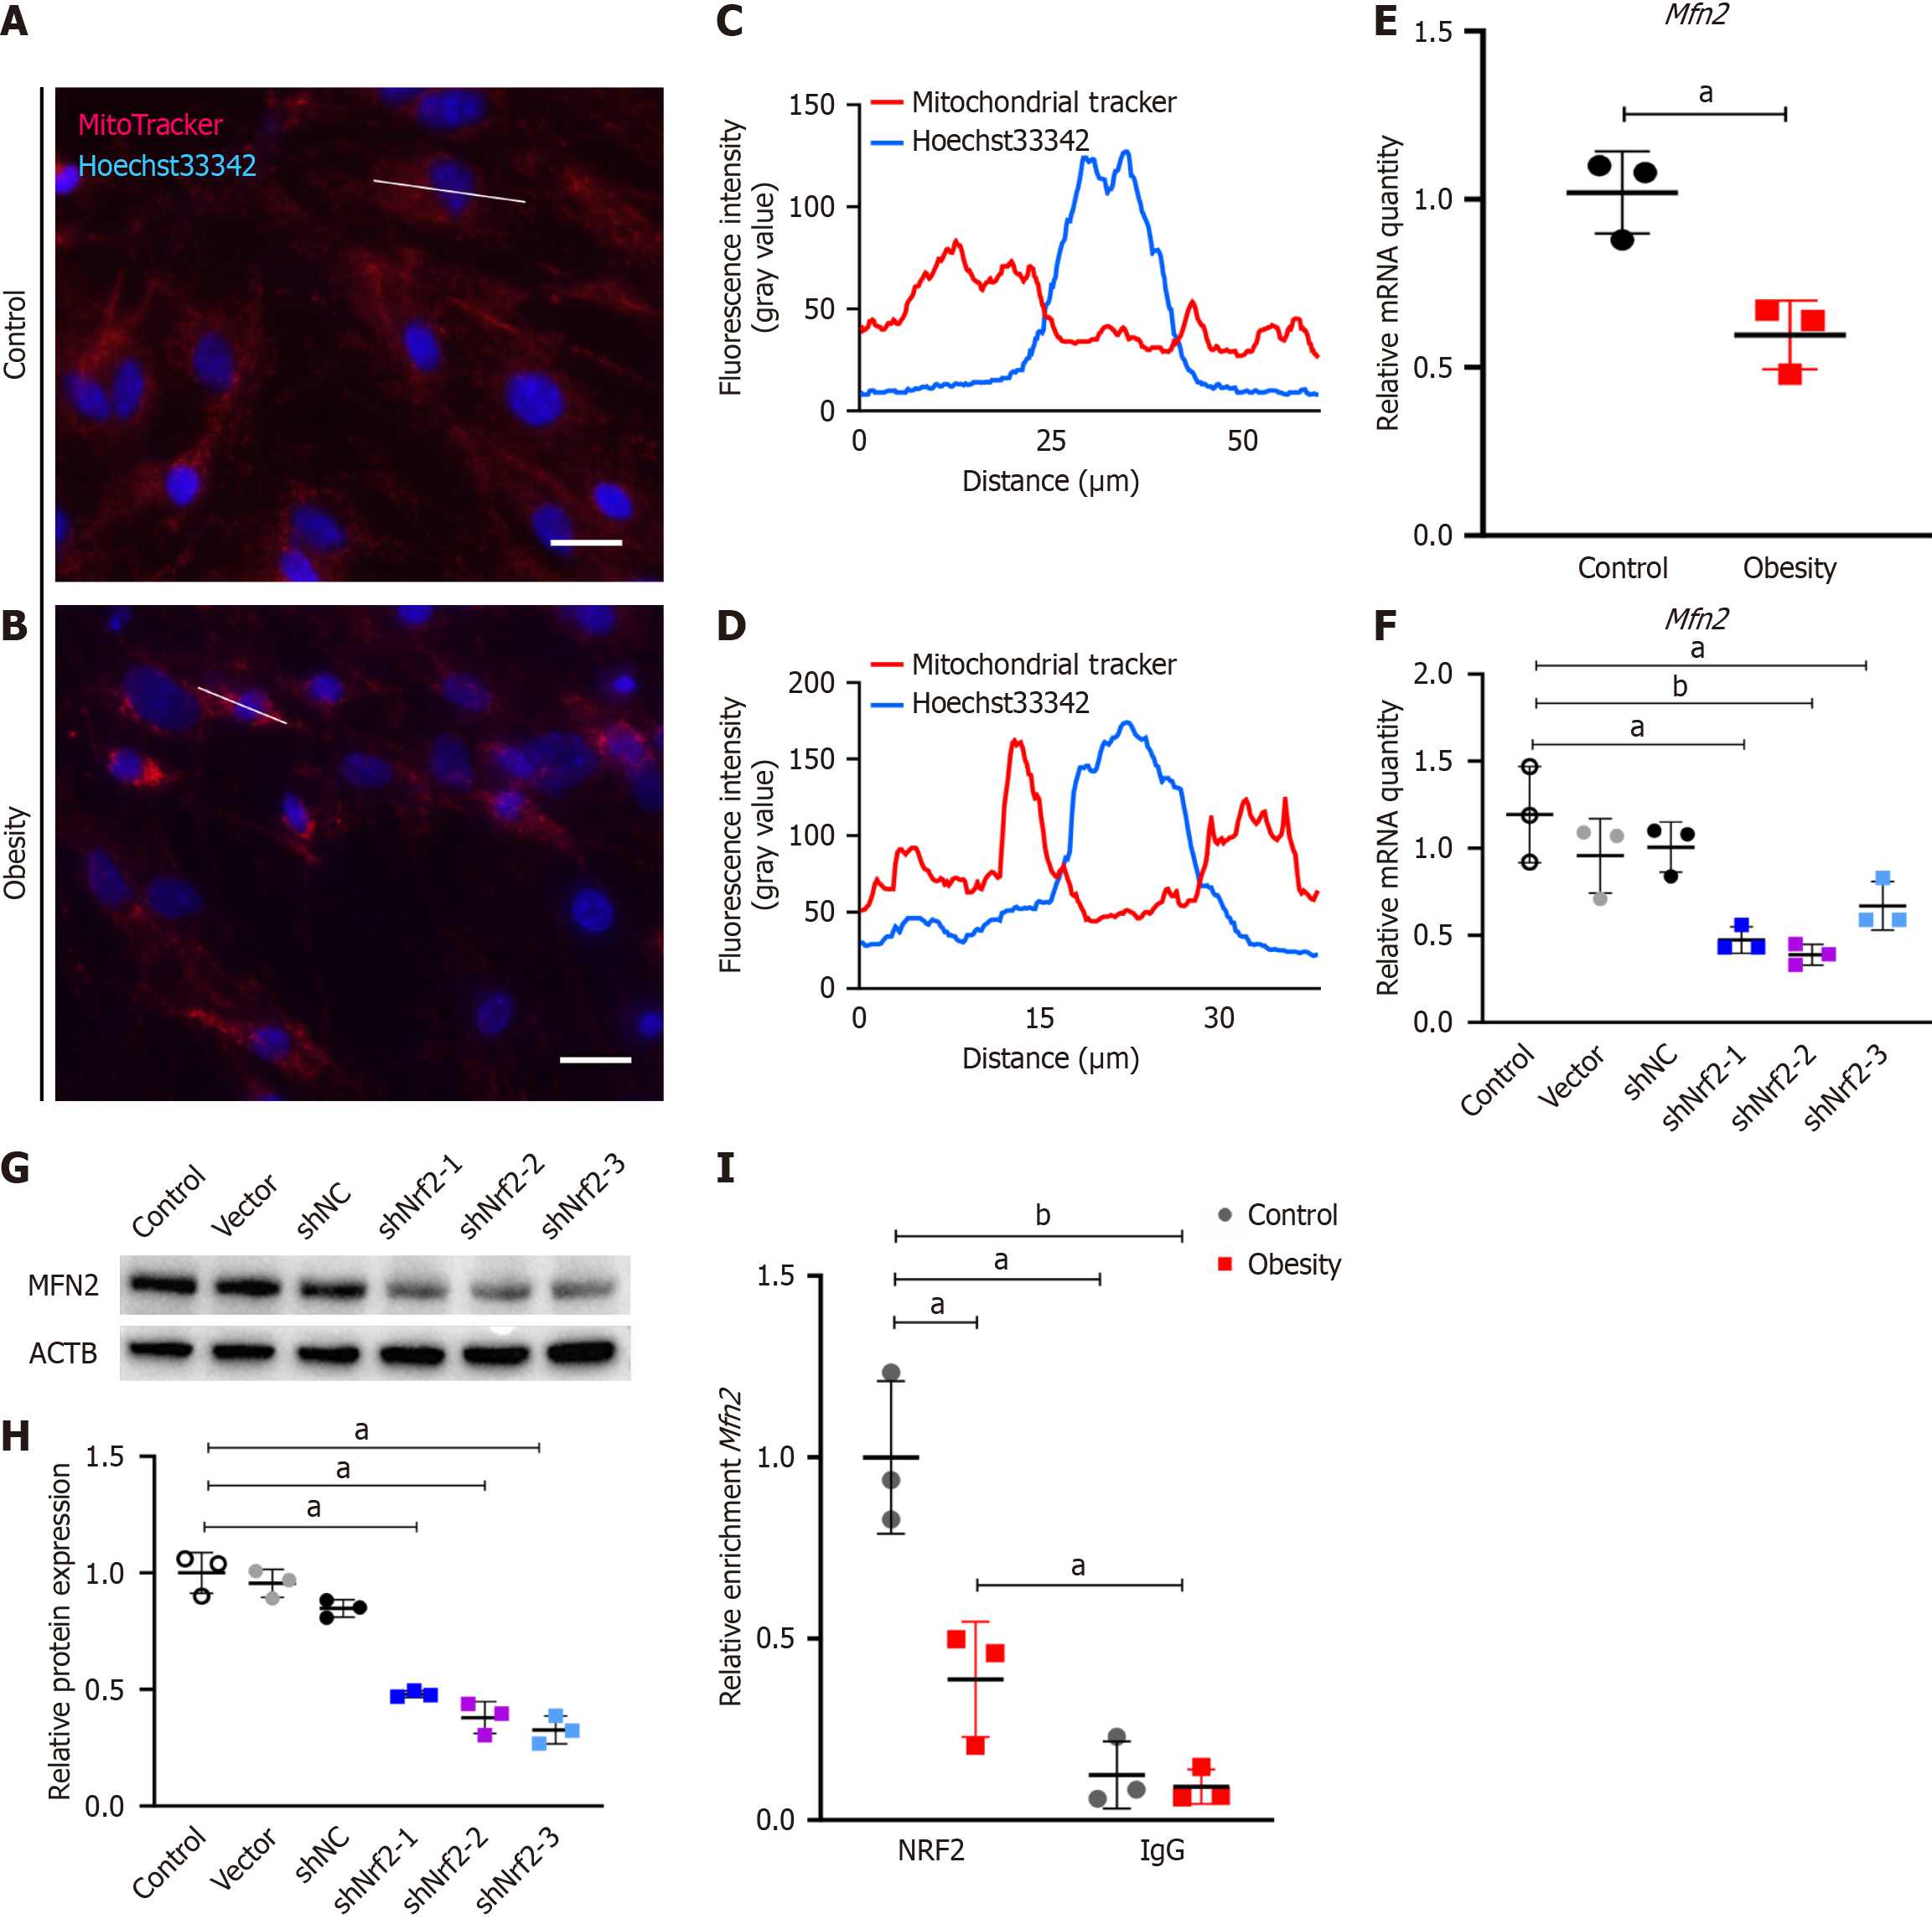
Figure 3 Nuclear factor erythroid-derived 2 regulates mitofusin-2 transcriptional activity.
A and B: Mitochondrial staining of adipose-derived mesenchymal stem cells (ASCs) with MitoTracker Red dye in control and hypertrophic obesity group, bar = 25 μm; C and D: Long-axis MitoTracker Red intensity of ASCs in control and hypertrophic obesity groups analyzed by ImageJ; E: Quantitative polymerase chain reaction (qPCR) analysis of the relative mRNA expression of mitofusin-2 (Mfn2) relative to β-actin (ACTB) in control and hypertrophic obesity ASCs (n = 3); F: qPCR analysis of the relative mRNA expression of Mfn2 relative to ACTB in control and nuclear factor erythroid-derived 2 (Nrf2) knockdown ASCs (n = 3); G: Western blot of MFN2 in control and Nrf2 knockdown ASCs; H: Relative quantitative analysis of MFN2 relative to β-actin for Western blot by ImageJ software (n = 3); I: Relative enrichment of NRF2 on the Mfn2 promoter region was detected by chromatin immunoprecipitation-qPCR (n = 3). aP < 0.05; bP < 0.01. IgG: Immunoglobulin G; IRE1α: Inositol-requiring enzyme-1 alpha.
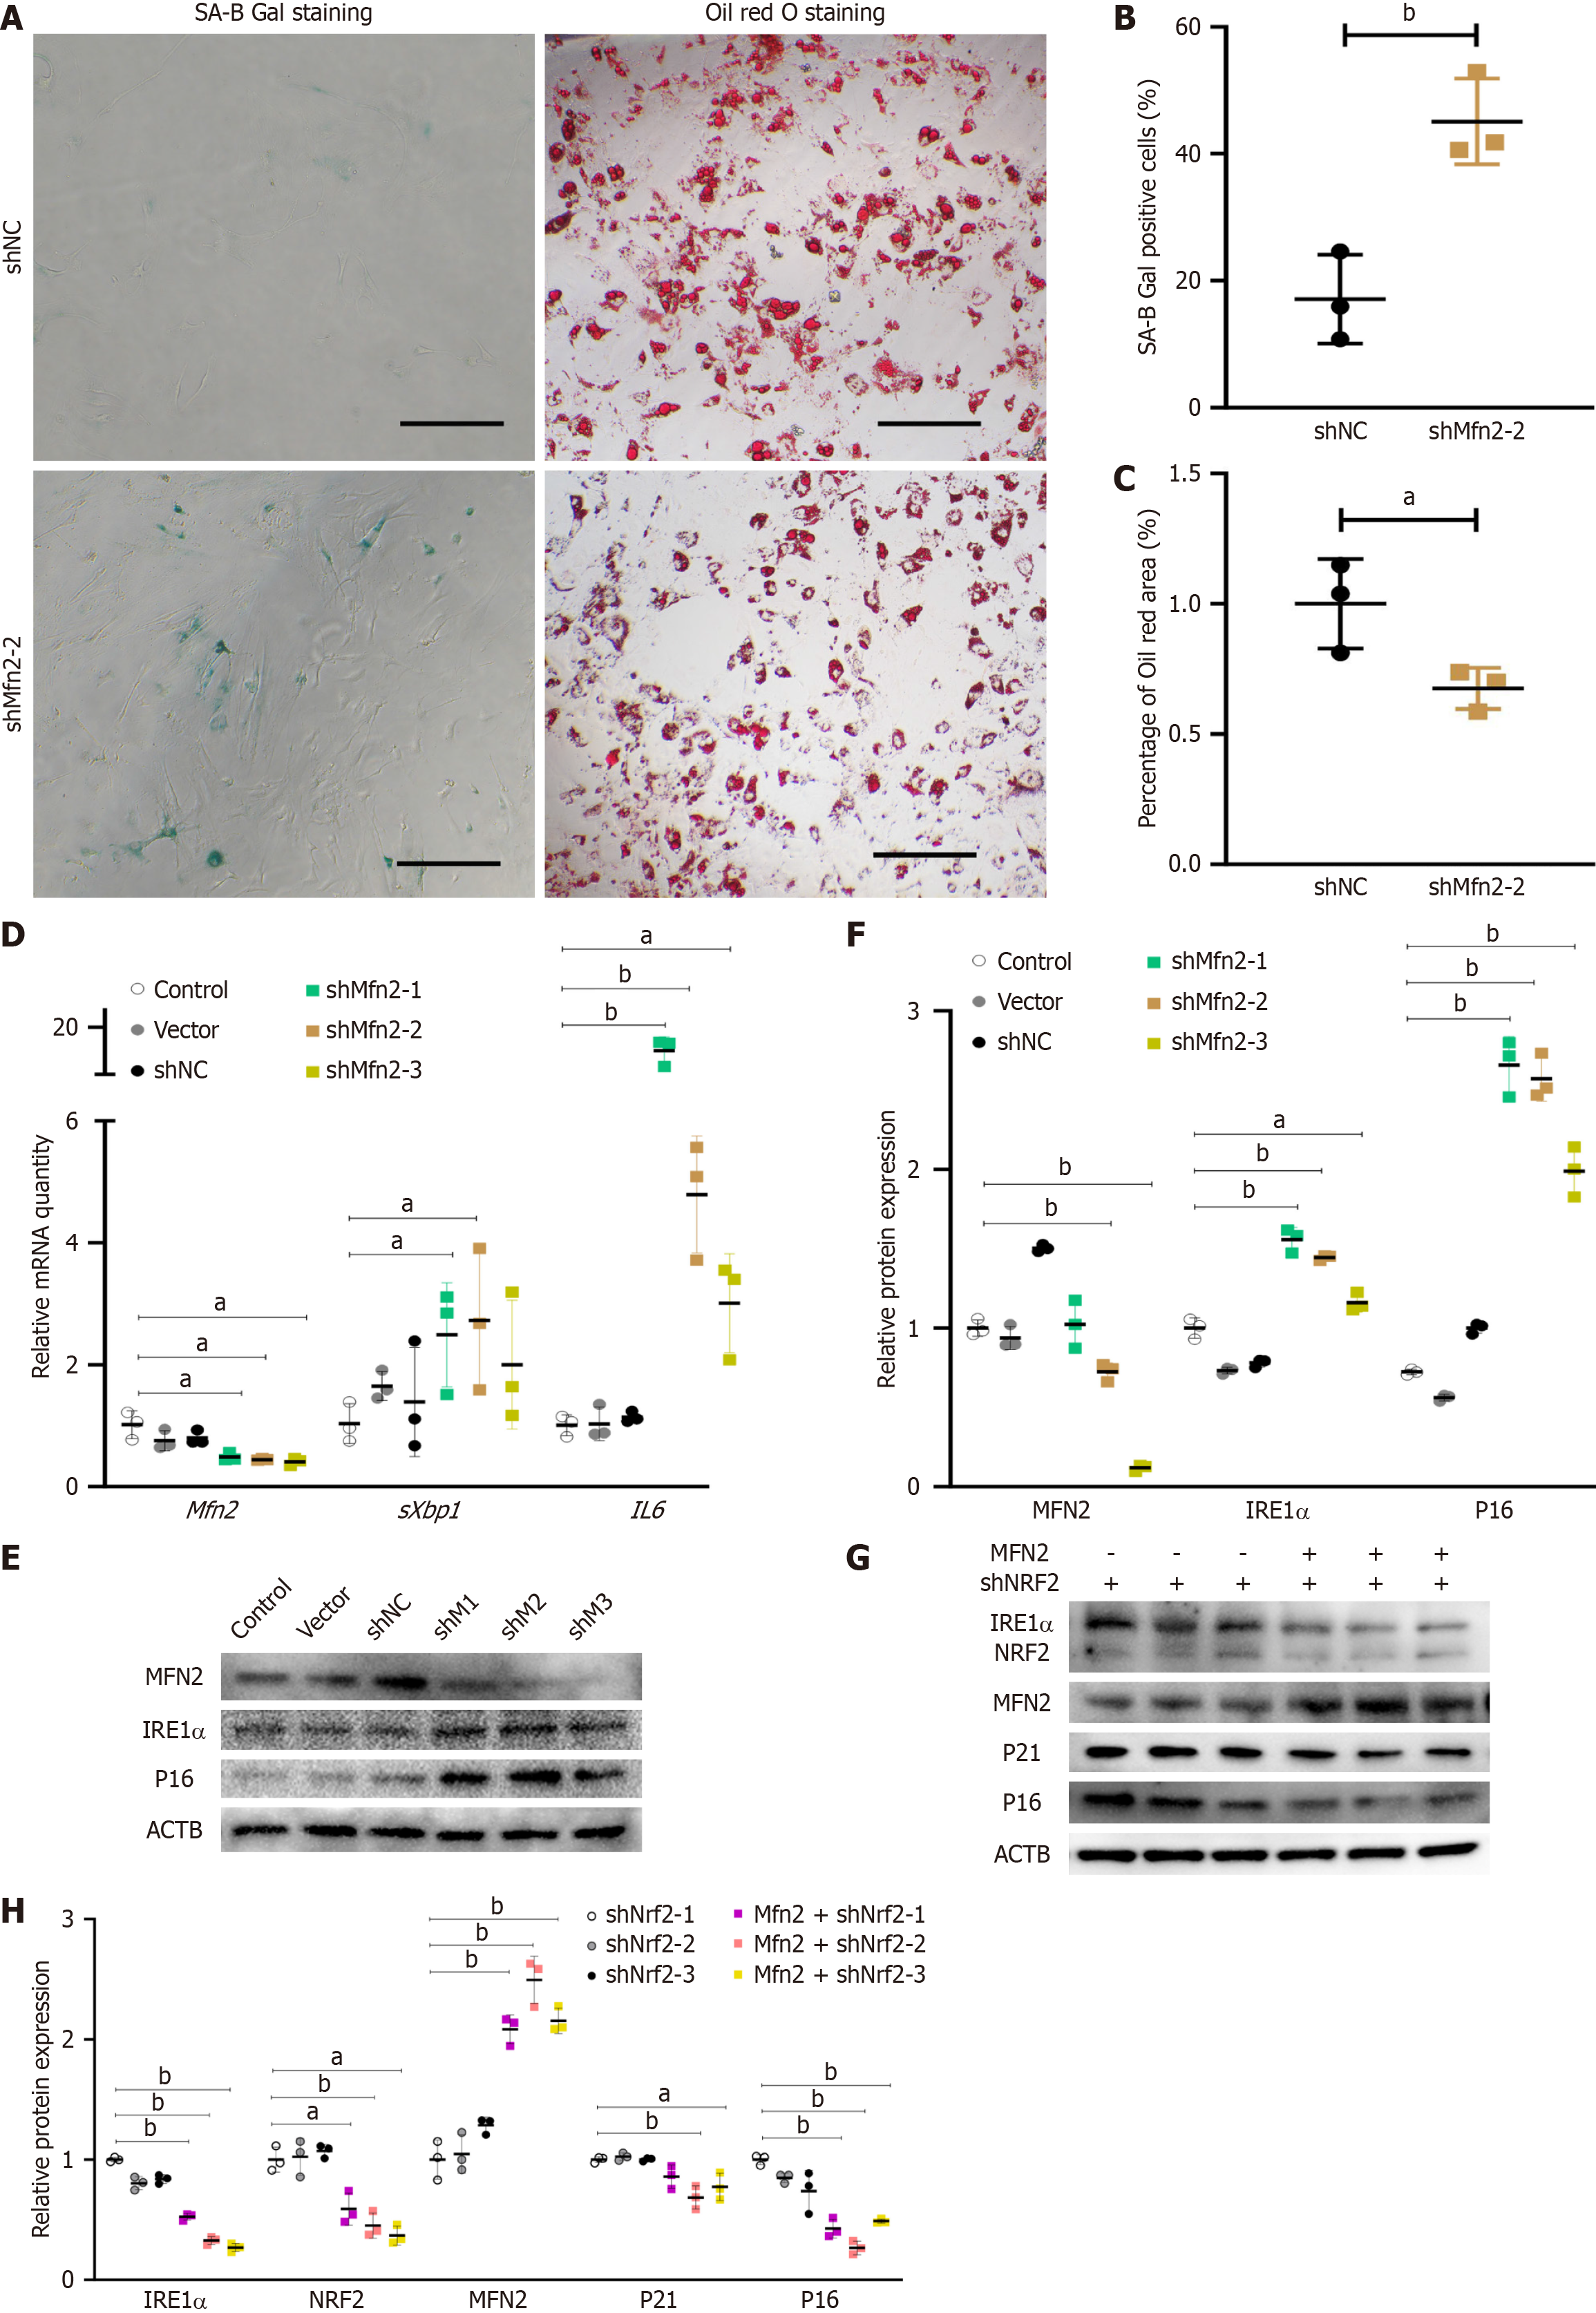
Figure 4 Nuclear factor erythroid-derived 2 regulates senescence phenotype and endoplasmic reticulum stress through mitofusin-2.
A: SA-B-Gal staining and Oil Red O staining of control and mitofusin-2 (Mfn2) knockdown adipose-derived mesenchymal stem cells (ASCs), bar = 100 μm; B: Percentage of SA-B-Gal staining-positive cells analyzed by ImageJ software (n = 3); C: Percentage of positive Oil Red O stained area to cell number (n = 3); D: Quantitative polymerase chain reaction analysis of the relative mRNA expression relative to β-actin (ACTB) in control and Mfn2 knockdown ASCs; E: Western blot of control and Mfn2 knockdown ASCs; F: Relative quantitative analysis of MFN2, inositol-requiring enzyme-1 alpha (IRE1a), and p16 relative to β-actin for Western blotting by ImageJ software (n = 3); G: Western blot of nuclear factor erythroid-derived 2 (Nrf2) knockdown ASCs and Nrf2 knockdown with superimposed Mfn2 overexpression ASCs; H: Relative quantitative analysis of proteins relative to ACTB for Western blotting by ImageJ software in Nrf2 knockdown ASCs and Nrf2 knockdown with superimposed Mfn2 overexpression ASCs (n = 3). aP < 0.05; bP < 0.01.
Figure 5 Mitofusin-2 is physically bound to binding immunoglobulin protein.
A: Eukaryotic Orthologous Group; B: Gene Ontology; C: Kyoto Encyclopedia of Genes and Genome analysis of mitofusin-2 (MFN2) binding protein; D: Western blot verified MFN2 binding immunoglobulin (IgG) protein (BIP) in a coimmunoprecipitation assay; E: Co-localized immunofluorescence staining of MFN2 and BIP, bar = 25 μm; F: Long-axis MFN2 and BIP intensity of adipose-derived mesenchymal stem cells (ASCs) analyzed by ImageJ software; G: SA-B-Gal staining of short hairpin RNA against negative control (shNC) ASCs, Mfn2 knockdown ASCs, and Mfn2 knockdown ASCs treated with BIP inducer X, bar = 100 μm; H: Quantitative polymerase chain reaction analysis of the relative mRNA expression relative to β-actin in shNC ASCs, Mfn2 knockdown ASCs, and Mfn2 knockdown ASCs treated with BIP inducer X. aP < 0.05; bP < 0.01.
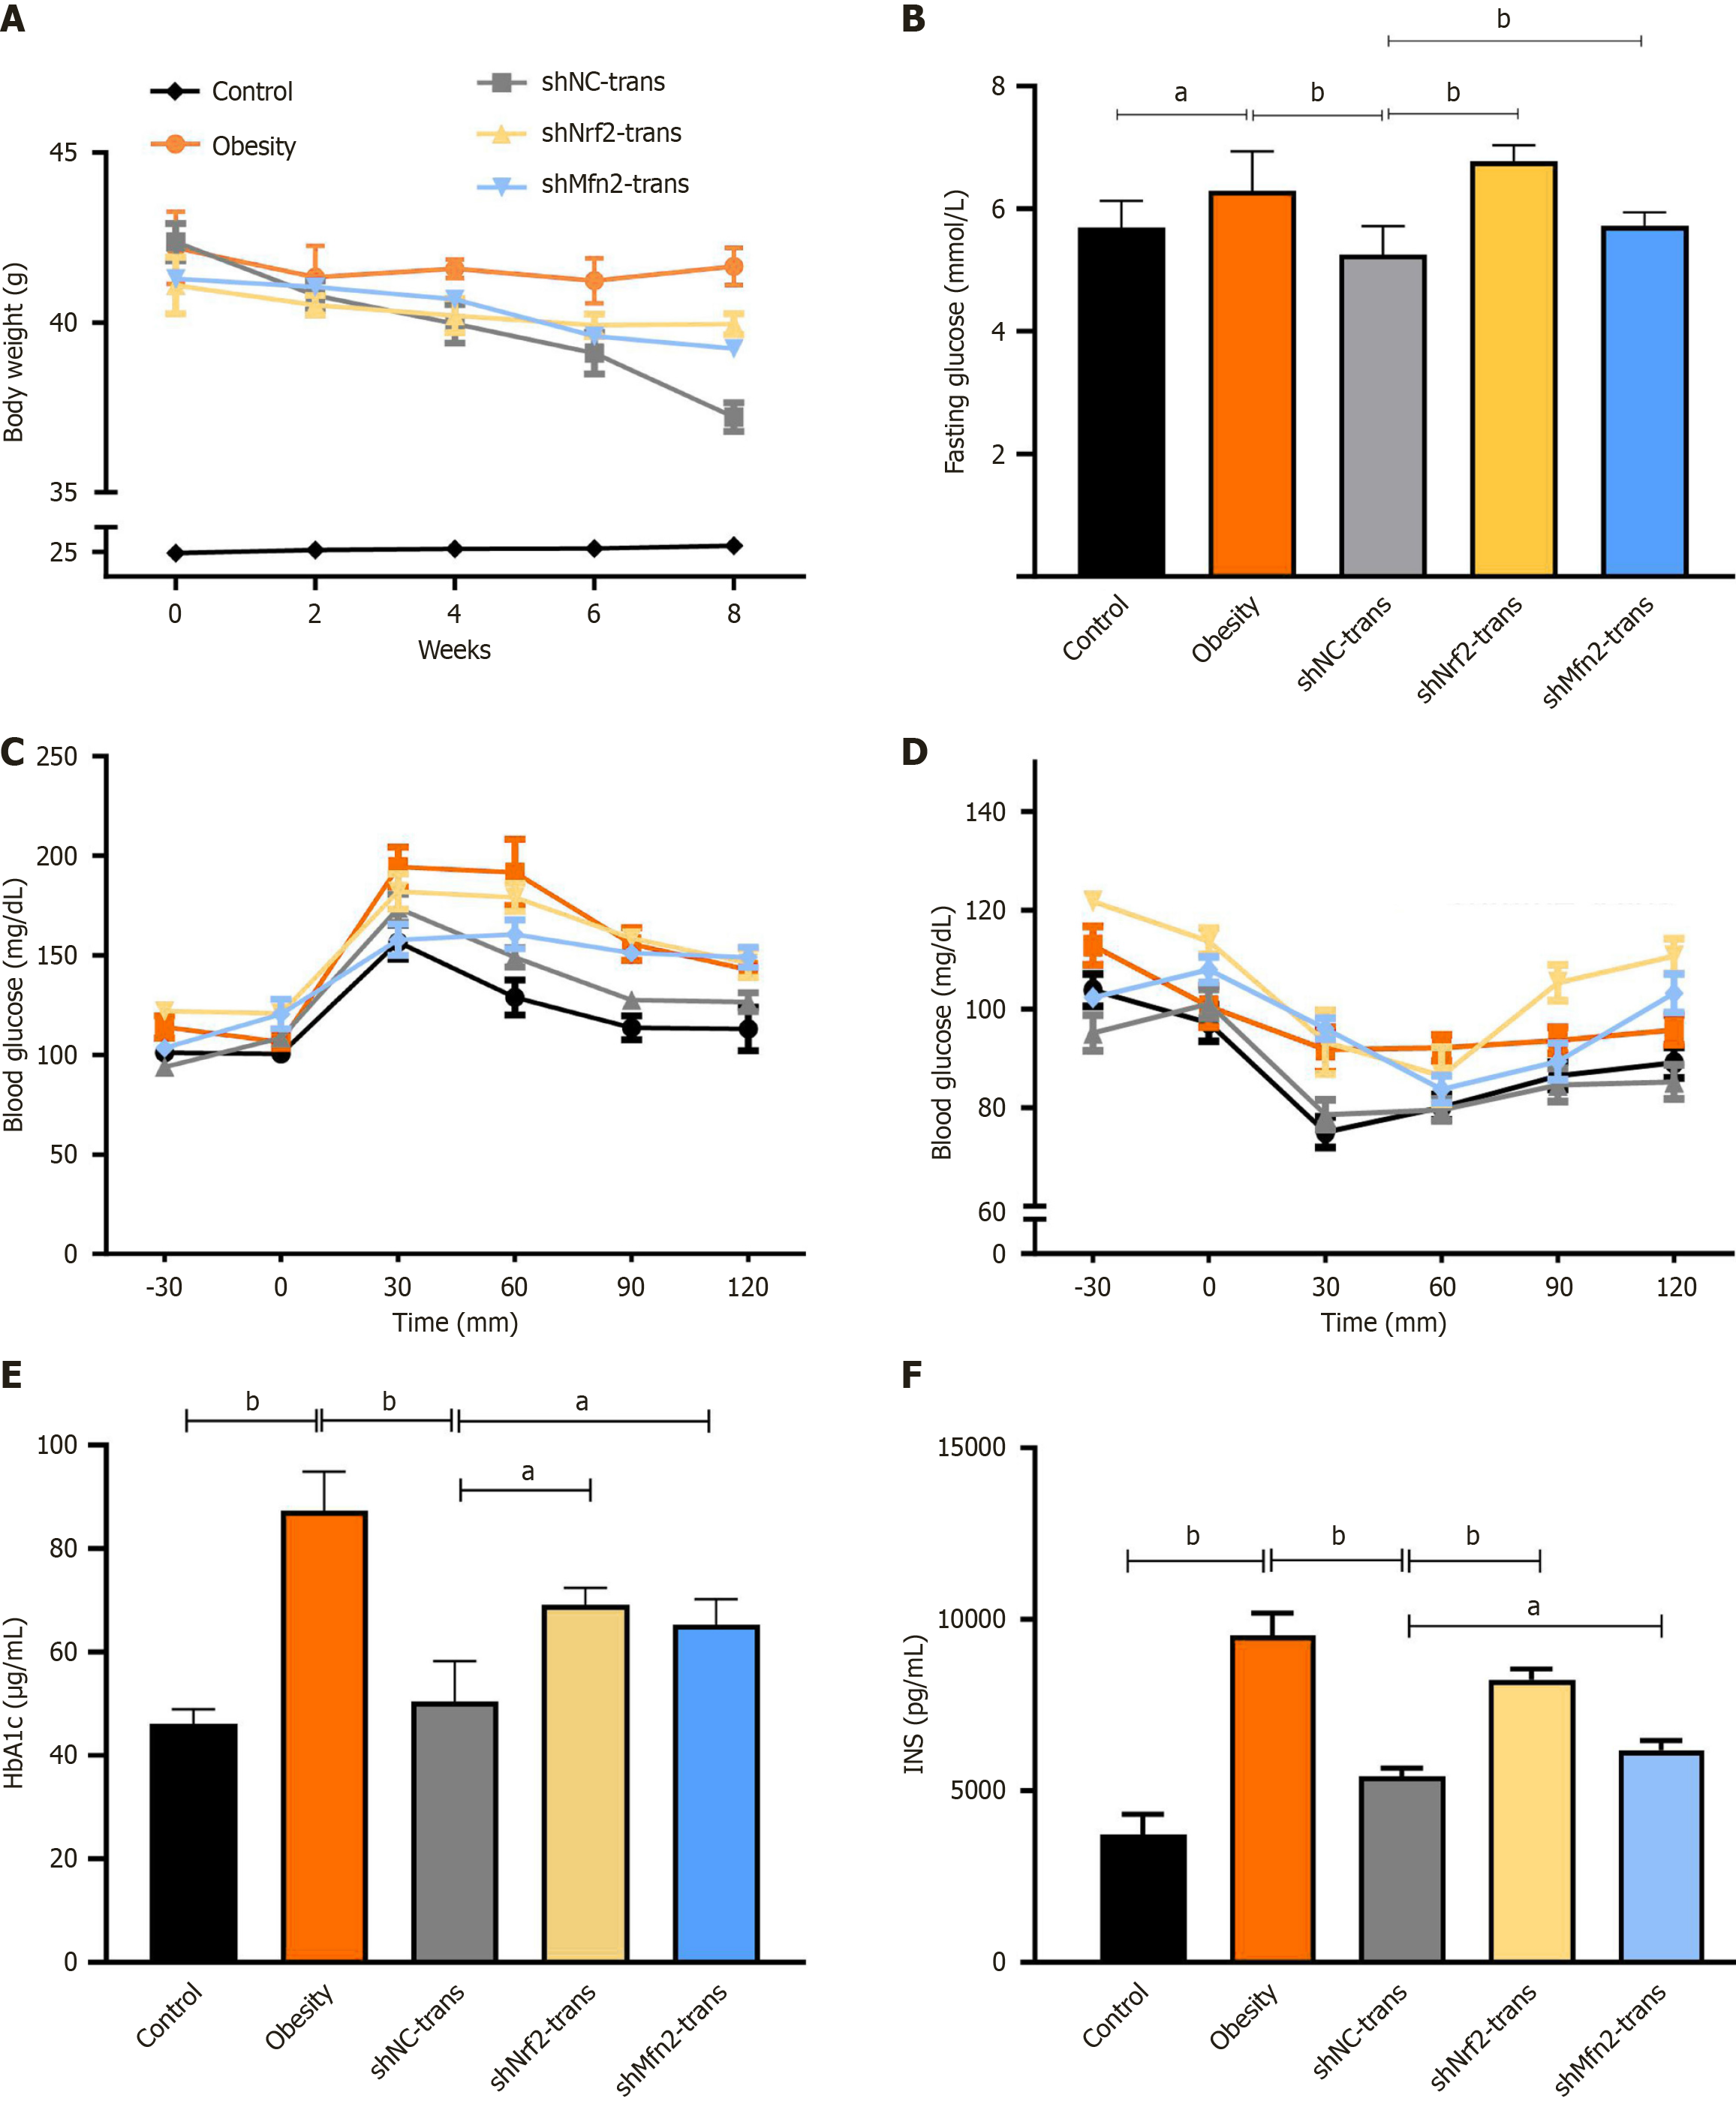
Figure 6 Nuclear factor erythroid-derived 2 or mitofusin-2 knockdown impair the therapeutic effect of adipose-derived mesenchymal stem cell transplantation.
A and B: Body weight and blood glucose of control, obesity mice transplanted with phosphate buffered saline and obesity mice transplanted with short hairpin RNA (shRNA) against nuclear factor erythroid-derived 2 (shNrf2) and shRNA against mitofusin-2 (shMfn2) young adipose-derived mesenchymal stem cells (n = 6); C and D: Glucose tolerance test and insulin tolerance test of each group after 8 weeks of transplantation (n = 6); E and F: Hemoglobin A1c (HbA1C) and insulin enzyme linked immunosorbent assay detection of each group after 8 weeks of transplantation (n = 3). aP < 0.05; bP < 0.01.
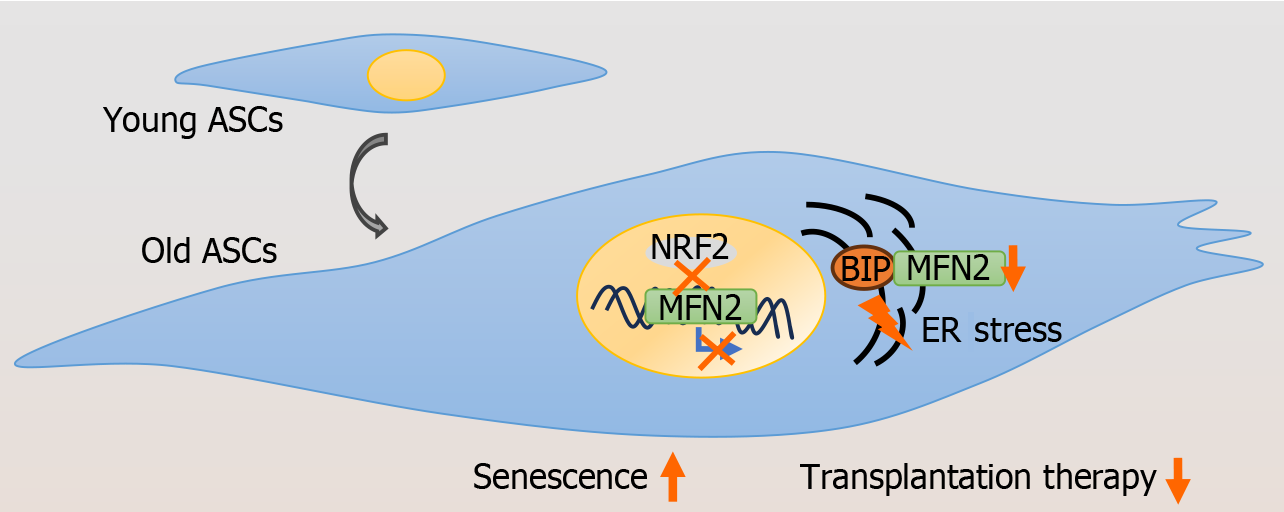
Figure 7 Patterns of adipose-derived mesenchymal stem cell senescence.
The decreased transcriptional activity of nuclear factor erythroid-derived 2 (NRF2) in the mitofusin-2 (Mfn2) gene region in adipose-derived mesenchymal stem cells (ASCs) leads to MFN2 deficiency and binding immunoglobulin protein (BIP) instability, which promotes endoplasmic reticulum (ER) stress and cell senescence. Knocking down Nrf2 or Mfn2 reduces the therapeutic efficacy of ASC transplantation.
- Citation: Fang J. Reduced NRF2/Mfn2 activity promotes endoplasmic reticulum stress and senescence in adipose-derived mesenchymal stem cells in hypertrophic obese mice. World J Stem Cells 2025; 17(6): 104367
- URL: https://www.wjgnet.com/1948-0210/full/v17/i6/104367.htm
- DOI: https://dx.doi.org/10.4252/wjsc.v17.i6.104367


