Copyright
©The Author(s) 2025.
World J Stem Cells. Oct 26, 2025; 17(10): 110190
Published online Oct 26, 2025. doi: 10.4252/wjsc.v17.i10.110190
Published online Oct 26, 2025. doi: 10.4252/wjsc.v17.i10.110190
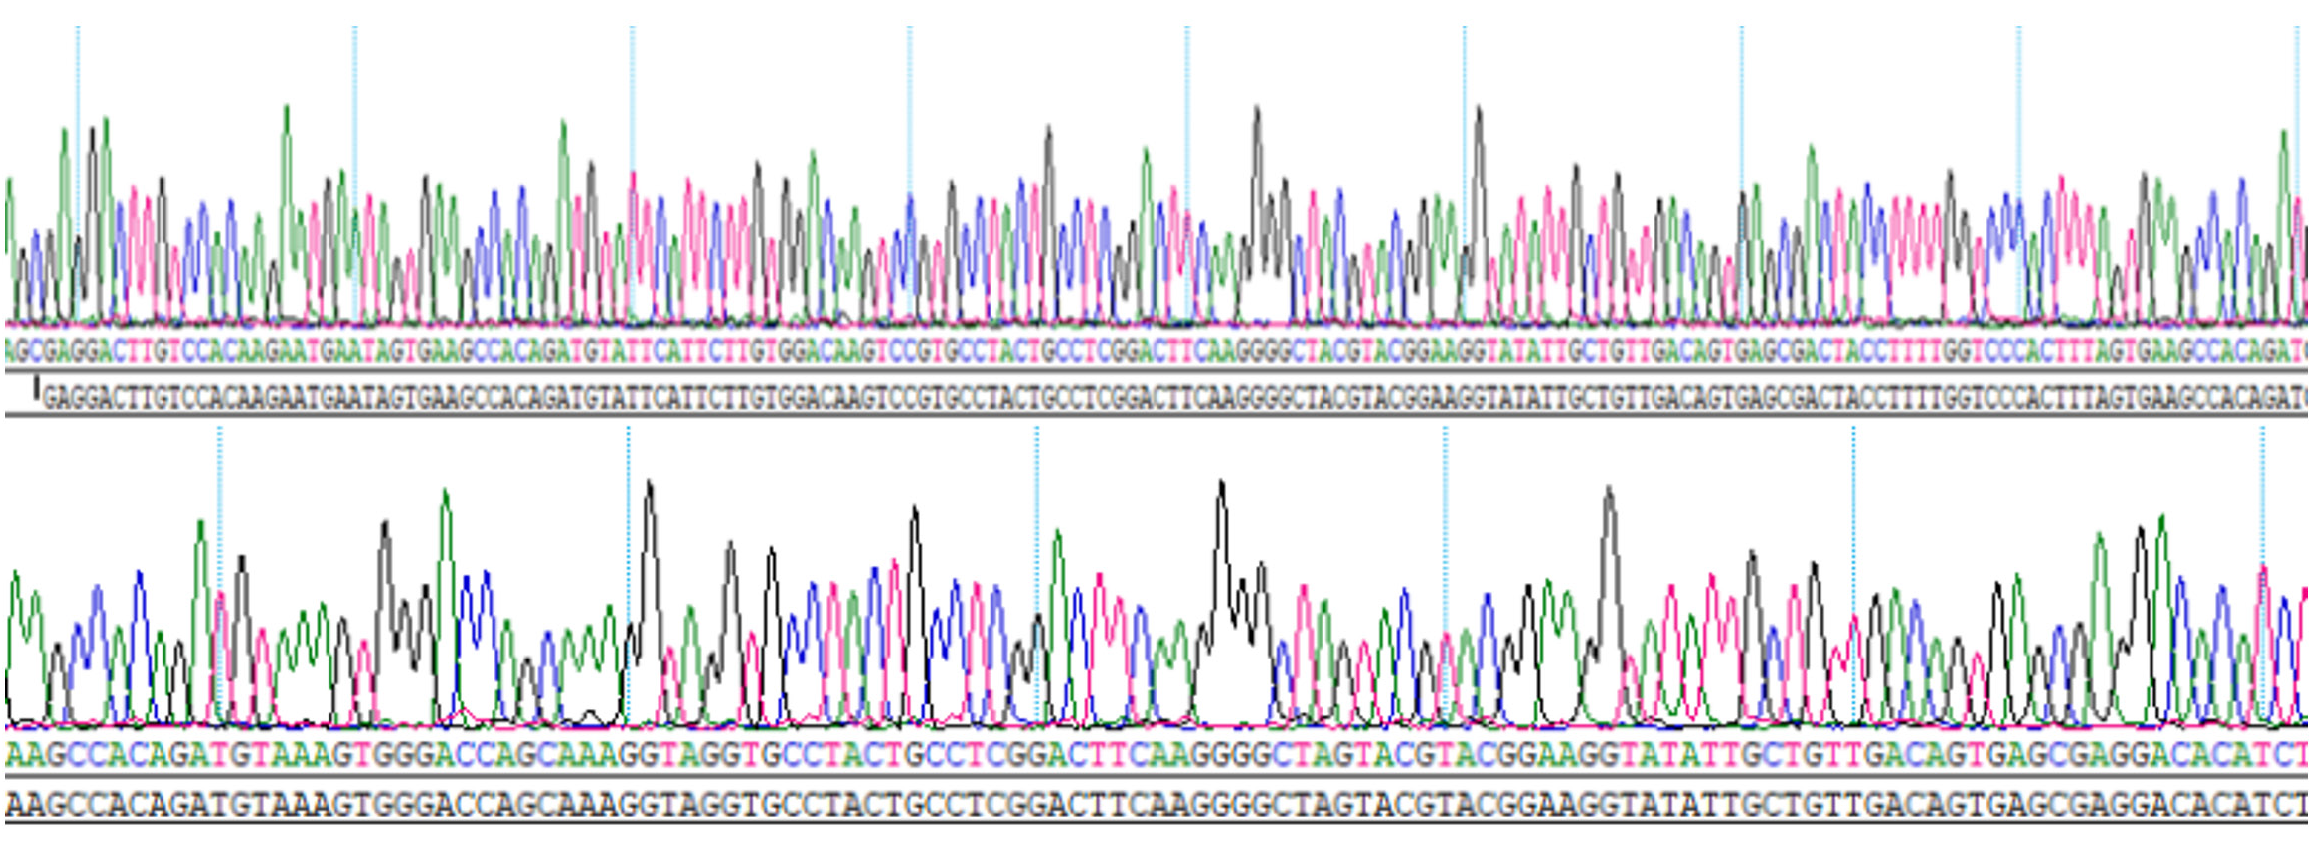
Figure 1
Sequencing of sclerostin gene silencing dinucleotide chain target sequence after insertion into pLEX (lentiviral expression)-short hairpin RNA-1 plasmid.
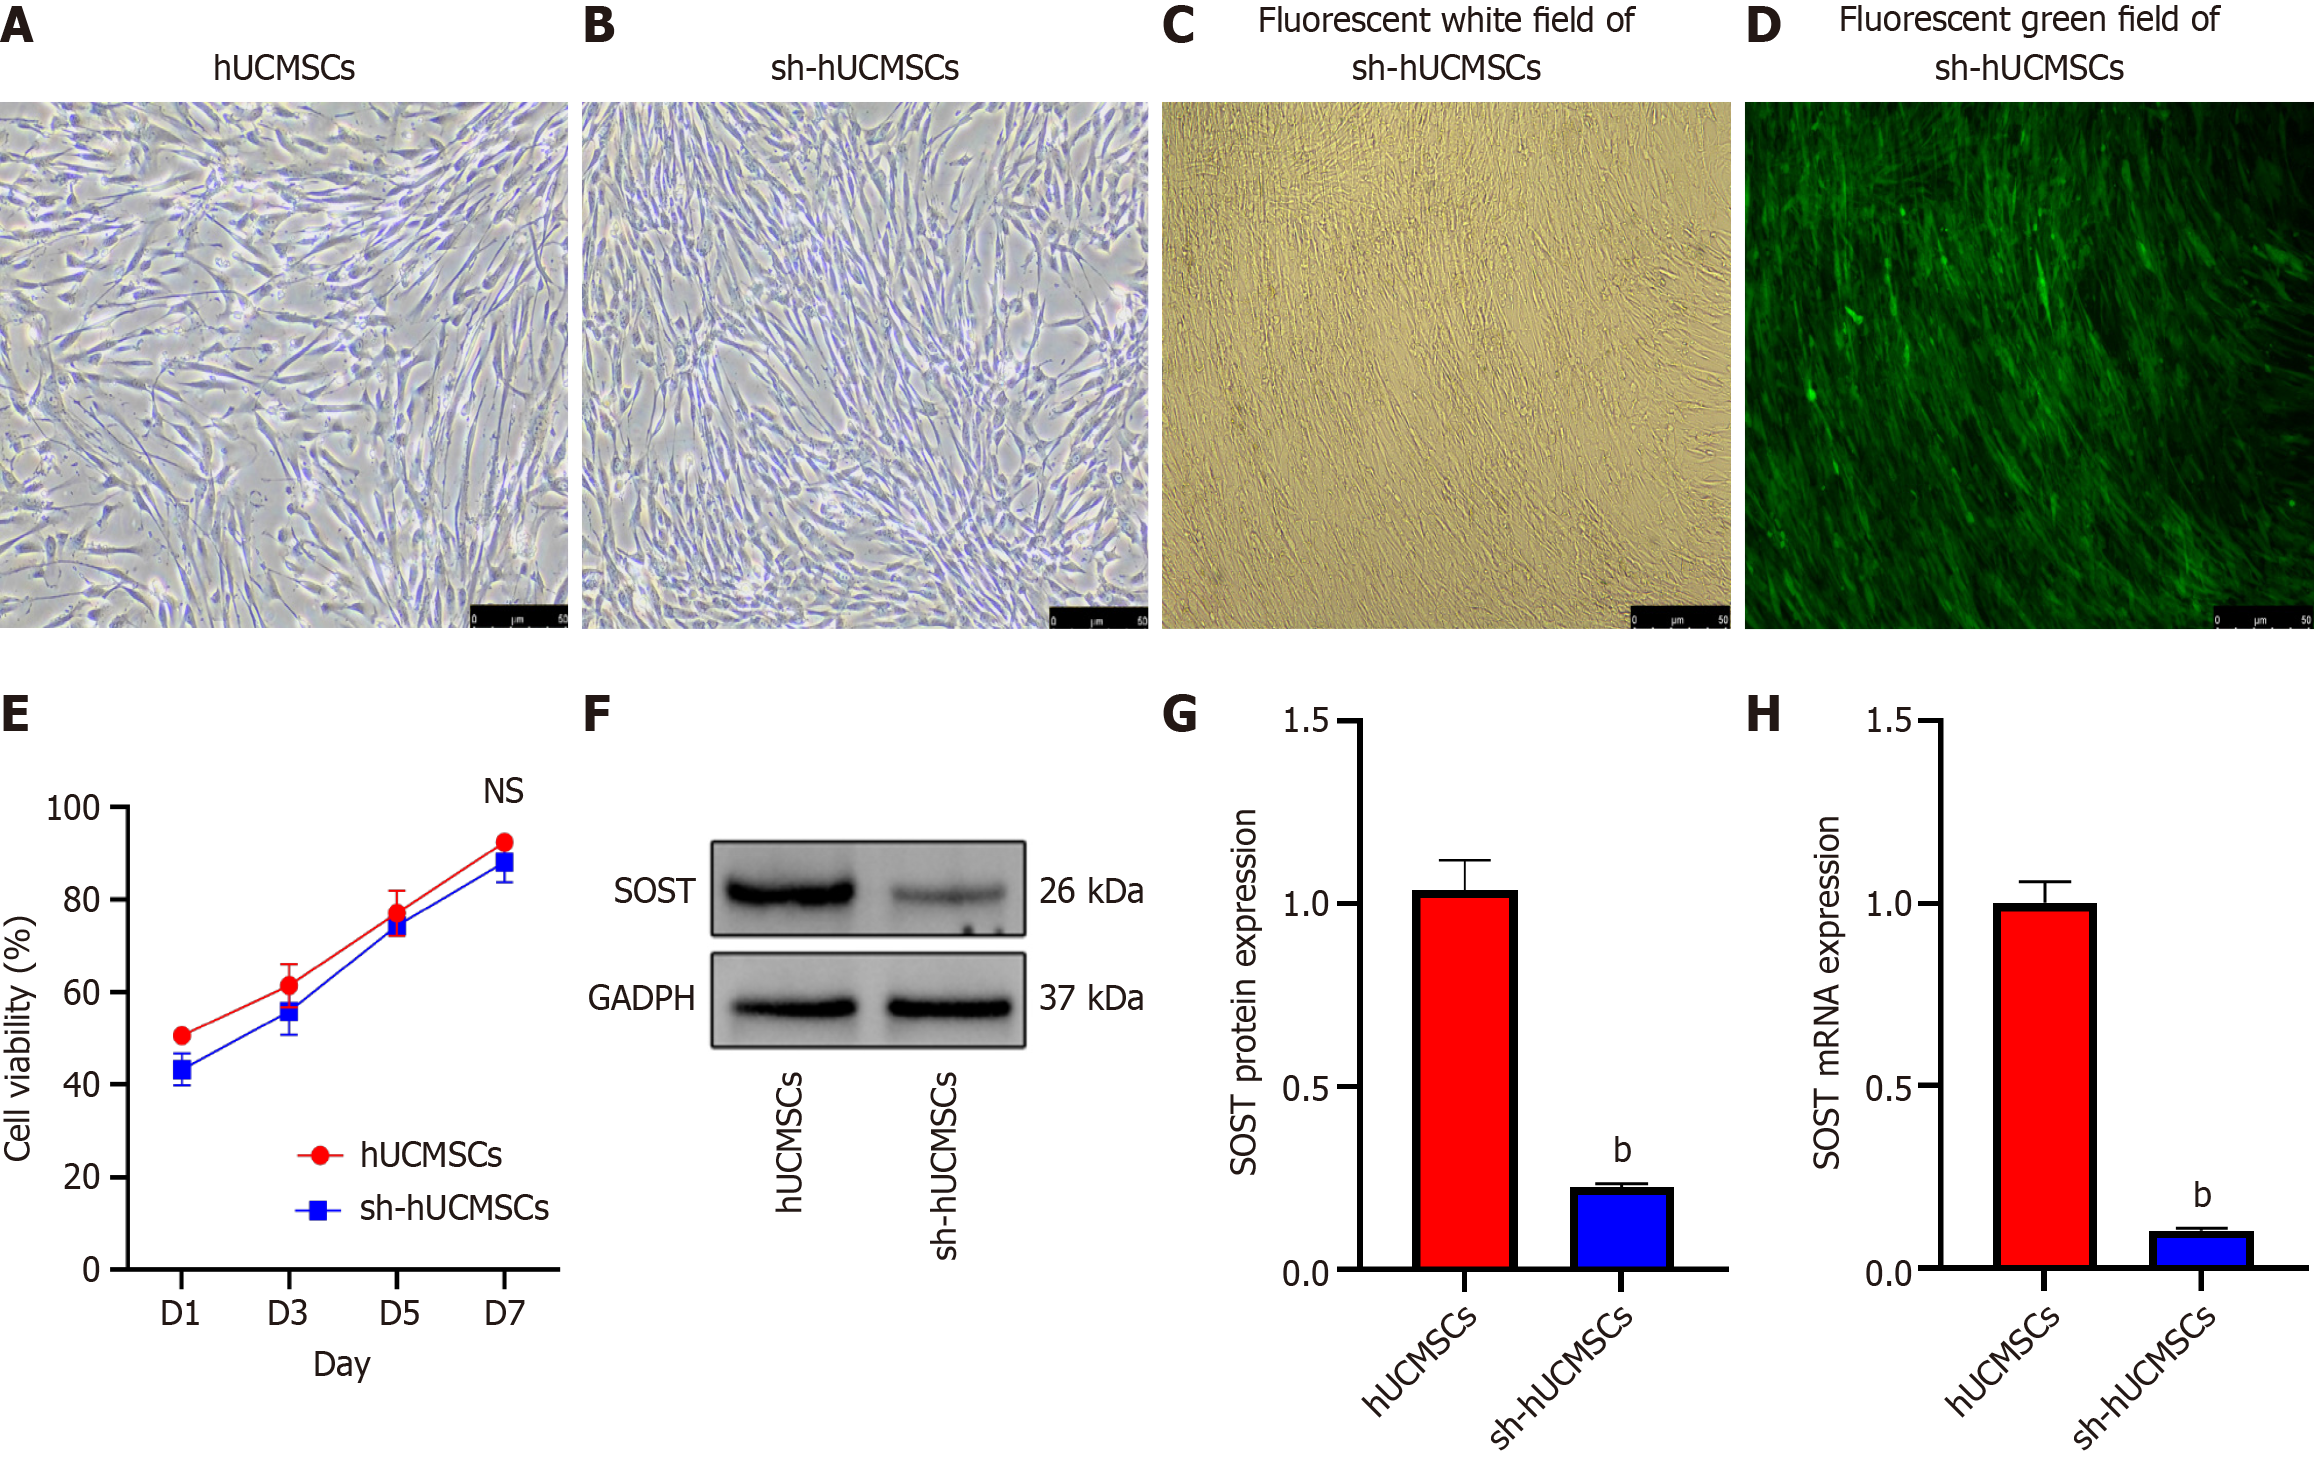
Figure 2 Human umbilical cord mesenchymal stem cells and their morphology after electroporation.
Morphology and transfection efficiency of human umbilical cord mesenchymal stem cells. A: Passage 3 (P3) human umbilical cord mesenchymal stem cells (hUCMSCs) showing spindle-shaped, radially arranged growth (scale bar = 50 μm); B: P3 hUCMSCs post-electroporation with sclerostin (SOST) inhibitor plasmid (scale bar = 50 μm); C and D: P4 SOST-RNAi hUCMSCs showing stable green fluorescent protein expression after puromycin selection (C: Bright field; D: Fluorescence field), scale bar = 50 μm; E: The cell viability of each group of hUCMSCs; F: Western blot of SOST gene silencing; G: SOST protein expression levels were significantly decreased in hUCMSCs with SOST-silenced; H: SOST mRNA expression levels were significantly decreased in hUCMSCs with SOST-silenced via quantitative real-time polymerase chain reaction. All data were presents as mean ± SD, n = 3. bP < 0.01 vs human umbilical cord mesenchymal stem cells; NS: Not significant. SOST: Sclerostin; hUCMSC: Human umbilical cord mesenchymal stem cells; sh-hUCMSCs: Human umbilical cord mesenchymal stem cells with sclerostin-silenced.
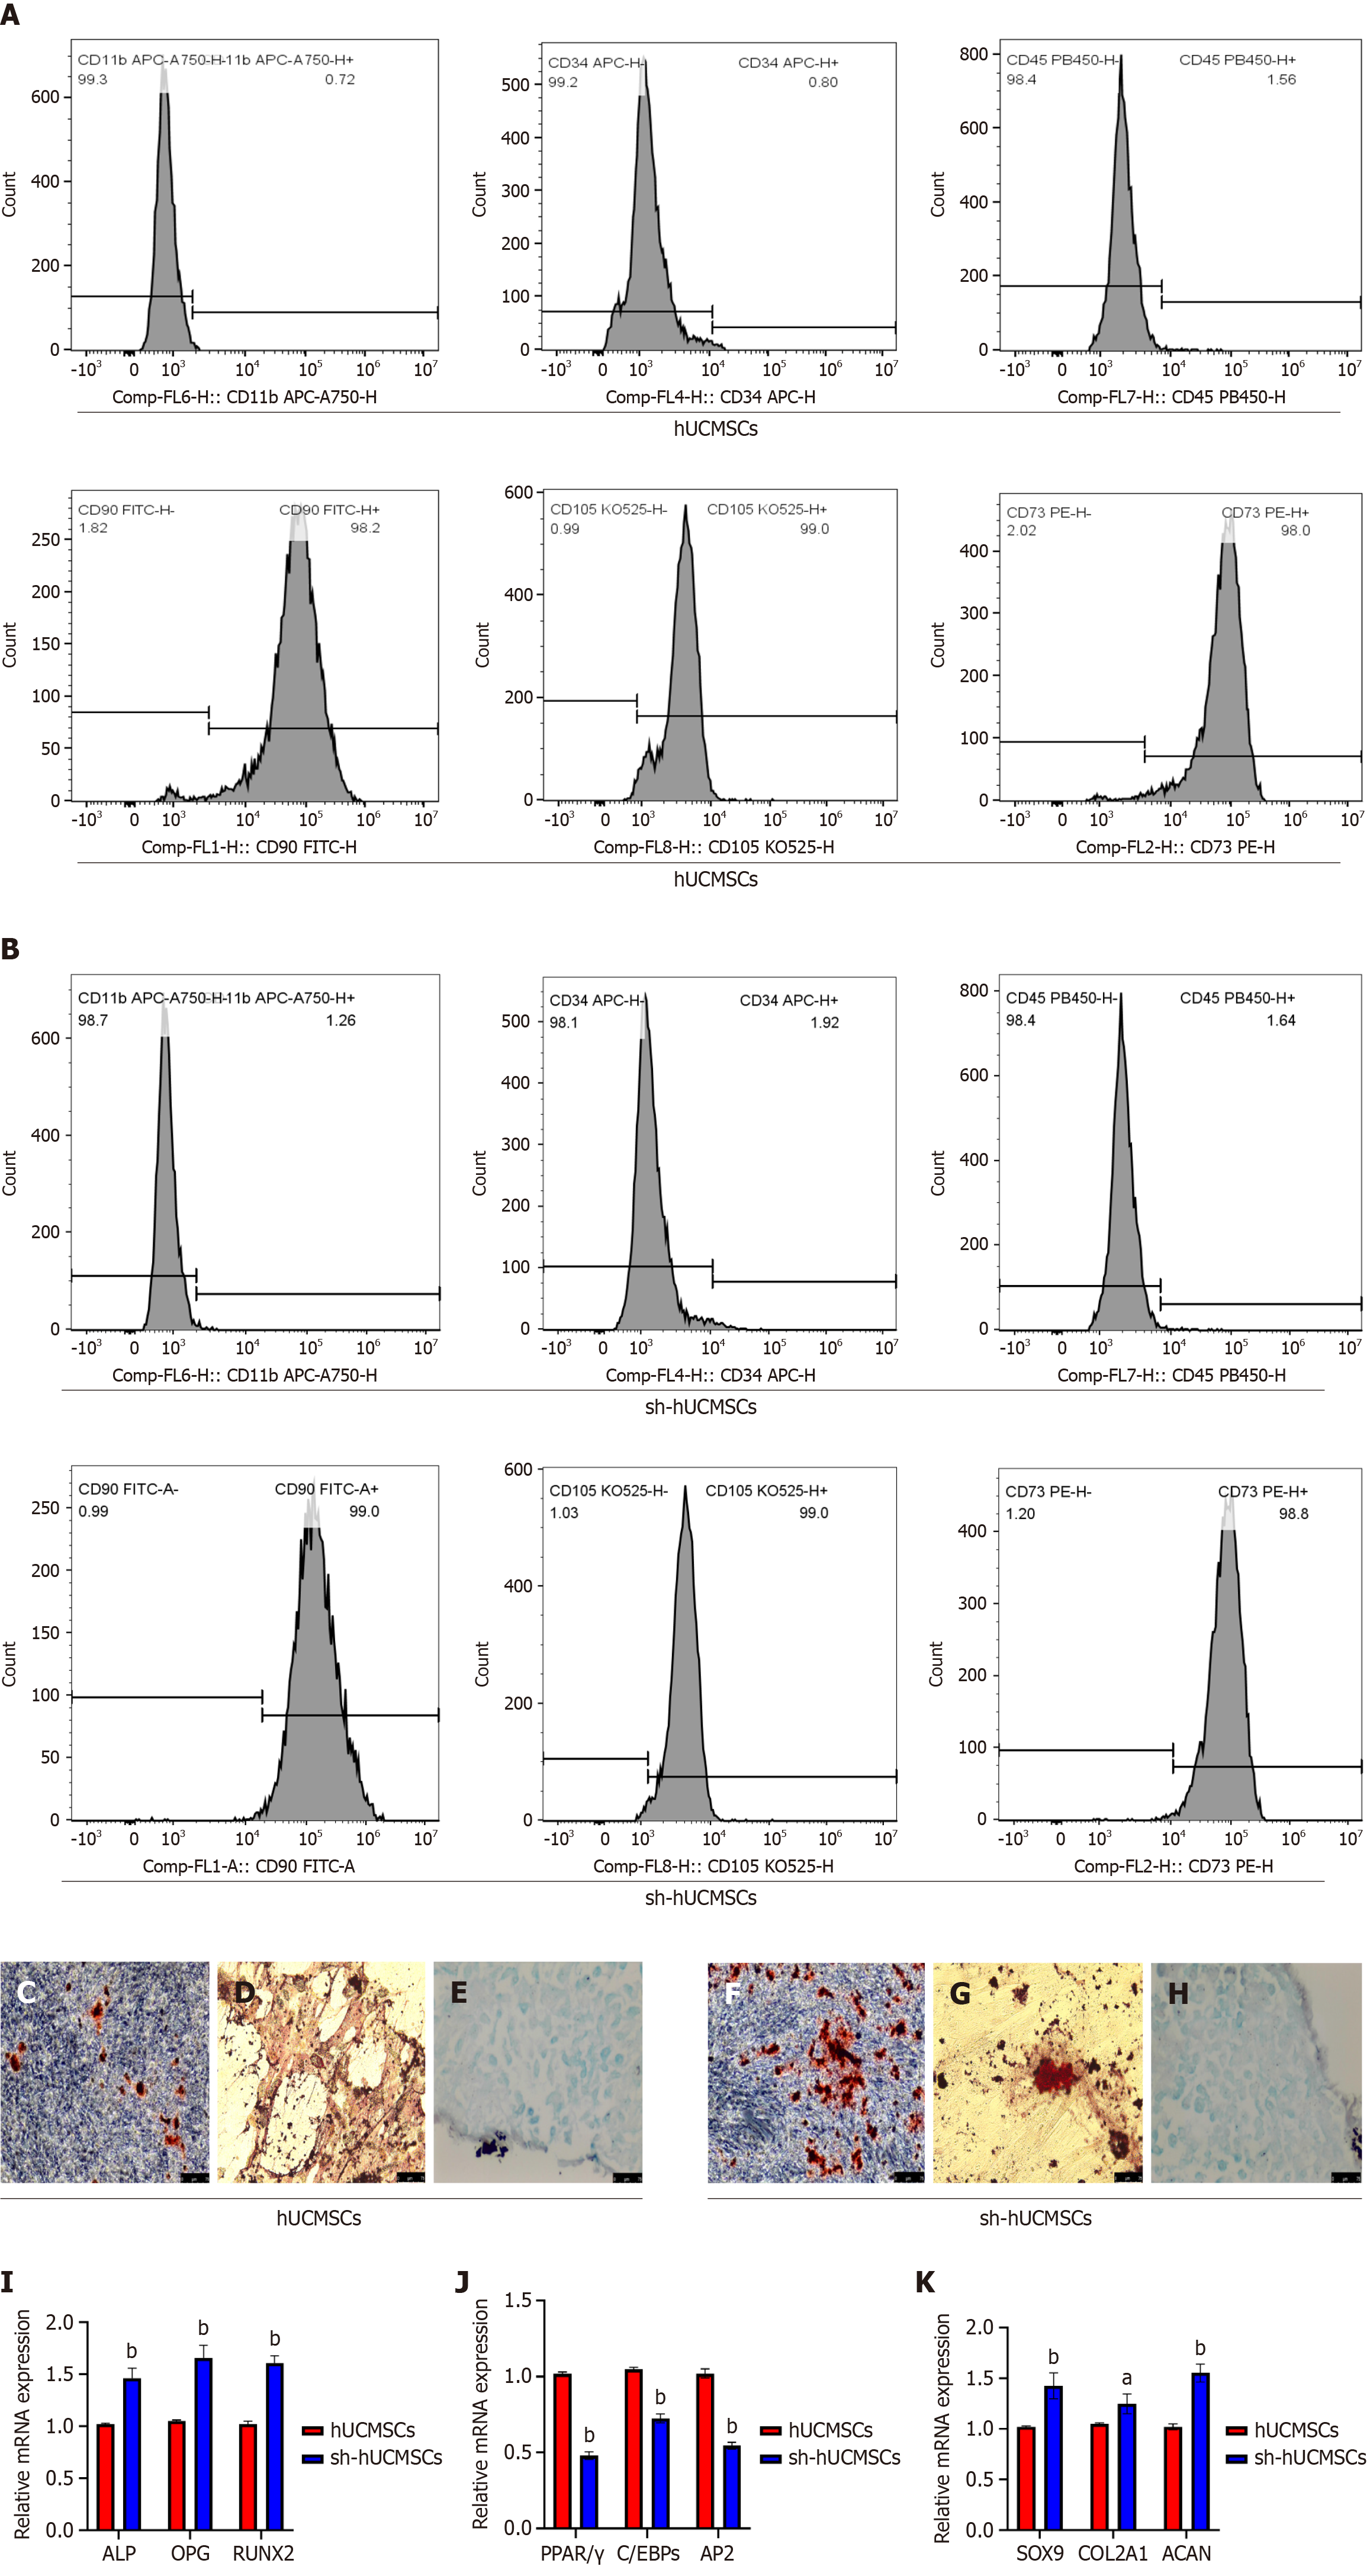
Figure 3 Phenotypic identification and multipotent differentiation of human umbilical cord mesenchymal stem cells and human umbilical cord mesenchymal stem cells with sclerostin-silenced.
Characterization of human umbilical cord mesenchymal stem cells and human umbilical cord mesenchymal stem cells with sclerostin-silenced. A and B: Flow cytometry analysis of the two cell groups demonstrated typical expression of mesenchymal stem cell surface markers: CD73, CD90 and CD105 were highly expressed (≥ 95%), while hematopoietic markers CD34, CD11b and CD45 showed minimal expression (≤ 5%), confirming mesenchymal stem cell phenotype; C-E: Multilineage differentiation potential of human umbilical cord mesenchymal stem cells (hUCMSCs); F-H: Multilineage differentiation potential of hUCMSCs with sclerostin-silenced (sh-hUCMSCs); I: Alizarin Red staining of both cell groups demonstrated upregulation of osteogenic markers (Runt-related transcription factor 2, alkaline phosphatase, and osteoprotegerin), confirming osteogenic differentiation, with sh-hUCMSCs exhibiting a stronger osteogenic potential; J: Oil Red O staining of both cell groups demonstrated upregulation of adipogenic markers (peroxisome proliferator-activated receptor gamma, adipocyte protein 2, and CCAAT/enhancer-binding proteins), confirming adipogenic differentiation. Notably, sh-hUCMSCs exhibited a reduced adipogenic potential compared to the hUCMSCs group; K: Alcian Blue staining of both cell groups revealed upregulation of chondrogenic markers (SRY-box transcription factor 9, type II collagen alpha 1 chain, and aggrecan), confirming chondrogenic differentiation. Notably, sh-hUCMSCs exhibited enhanced chondrogenic potential compared to the hUCMSCs group. All mRNA expression data represent three independent experiments (mean ± SEM). aP < 0.05 vs human umbilical cord mesenchymal stem cells; bP < 0.01 vs human umbilical cord mesenchymal stem cells. hUCMSCs: Human umbilical cord mesenchymal stem cells; sh-hUCMSCs: Human umbilical cord mesenchymal stem cells with sclerostin-silenced; ALP: Alkaline phosphatase; OPG: Osteoprotegerin; RUNX2: Runt-related transcription factor 2; PPARγ: Peroxisome proliferator-activated receptor gamma; C/EBPs: CCAAT/enhancer-binding proteins; AP2: Adipocyte protein 2; SOX9: SRY-box transcription factor 9; COL2A1: Type II collagen alpha 1 chain; ACAN: Aggrecan.
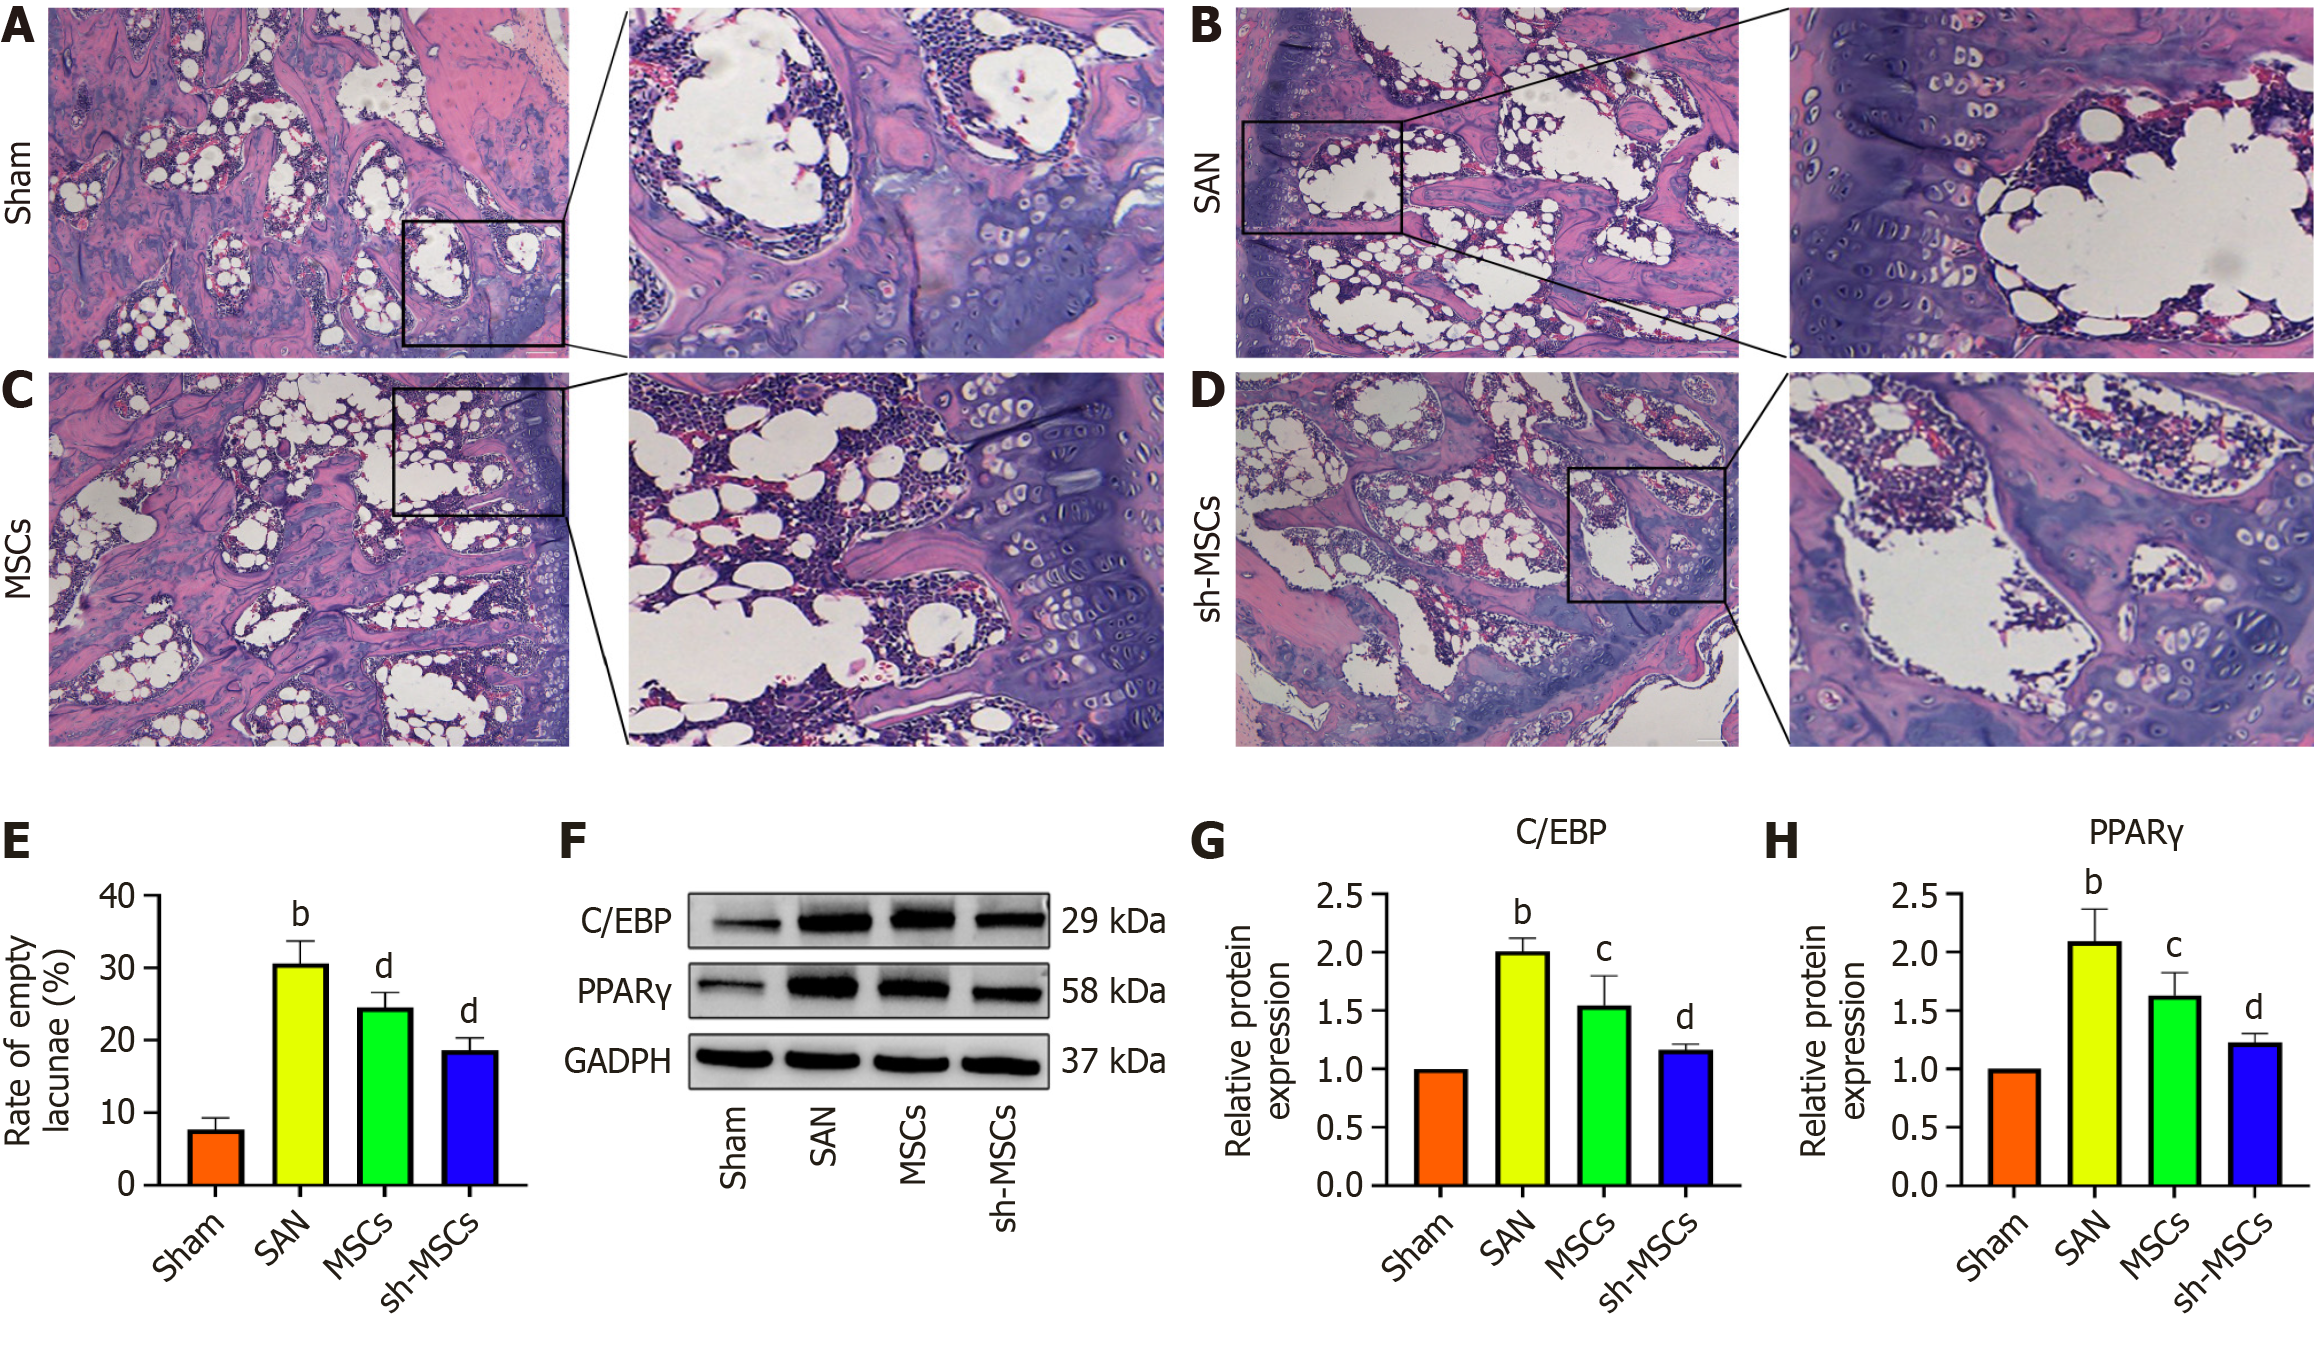
Figure 4 Sclerostin inhibitor-silenced human umbilical cord mesenchymal stem cells can inhibit the formation of adipose tissue in mice with steroid-induced avascular necrosis of the femoral head.
Histological and molecular analysis of femoral heads. A-D: Hematoxylin and eosin staining of: Sham, SAN + NS, SAN + hUCMSCs (MSCs), and SAN + SOSTi-hUCMSCs (sh-MSCs) groups; E: Quantification of empty bone pits; F: Representative western blot; G and H: Protein expression of CCAAT/enhancer-binding protein (G) and peroxisome proliferator-activated receptor gamma (H), showing lowest levels in sham, highest in SAN, with sh-MSCs < MSCs < SAN. Statistical comparisons: aP < 0.05, bP < 0.01 vs sham; cP < 0.05, dP < 0.01 vs SAN. C/EBP: CCAAT/enhancer-binding proteins; PPARγ: Peroxisome proliferator-activated receptor γ. Data represent mean ± SEM from three independent experiments.
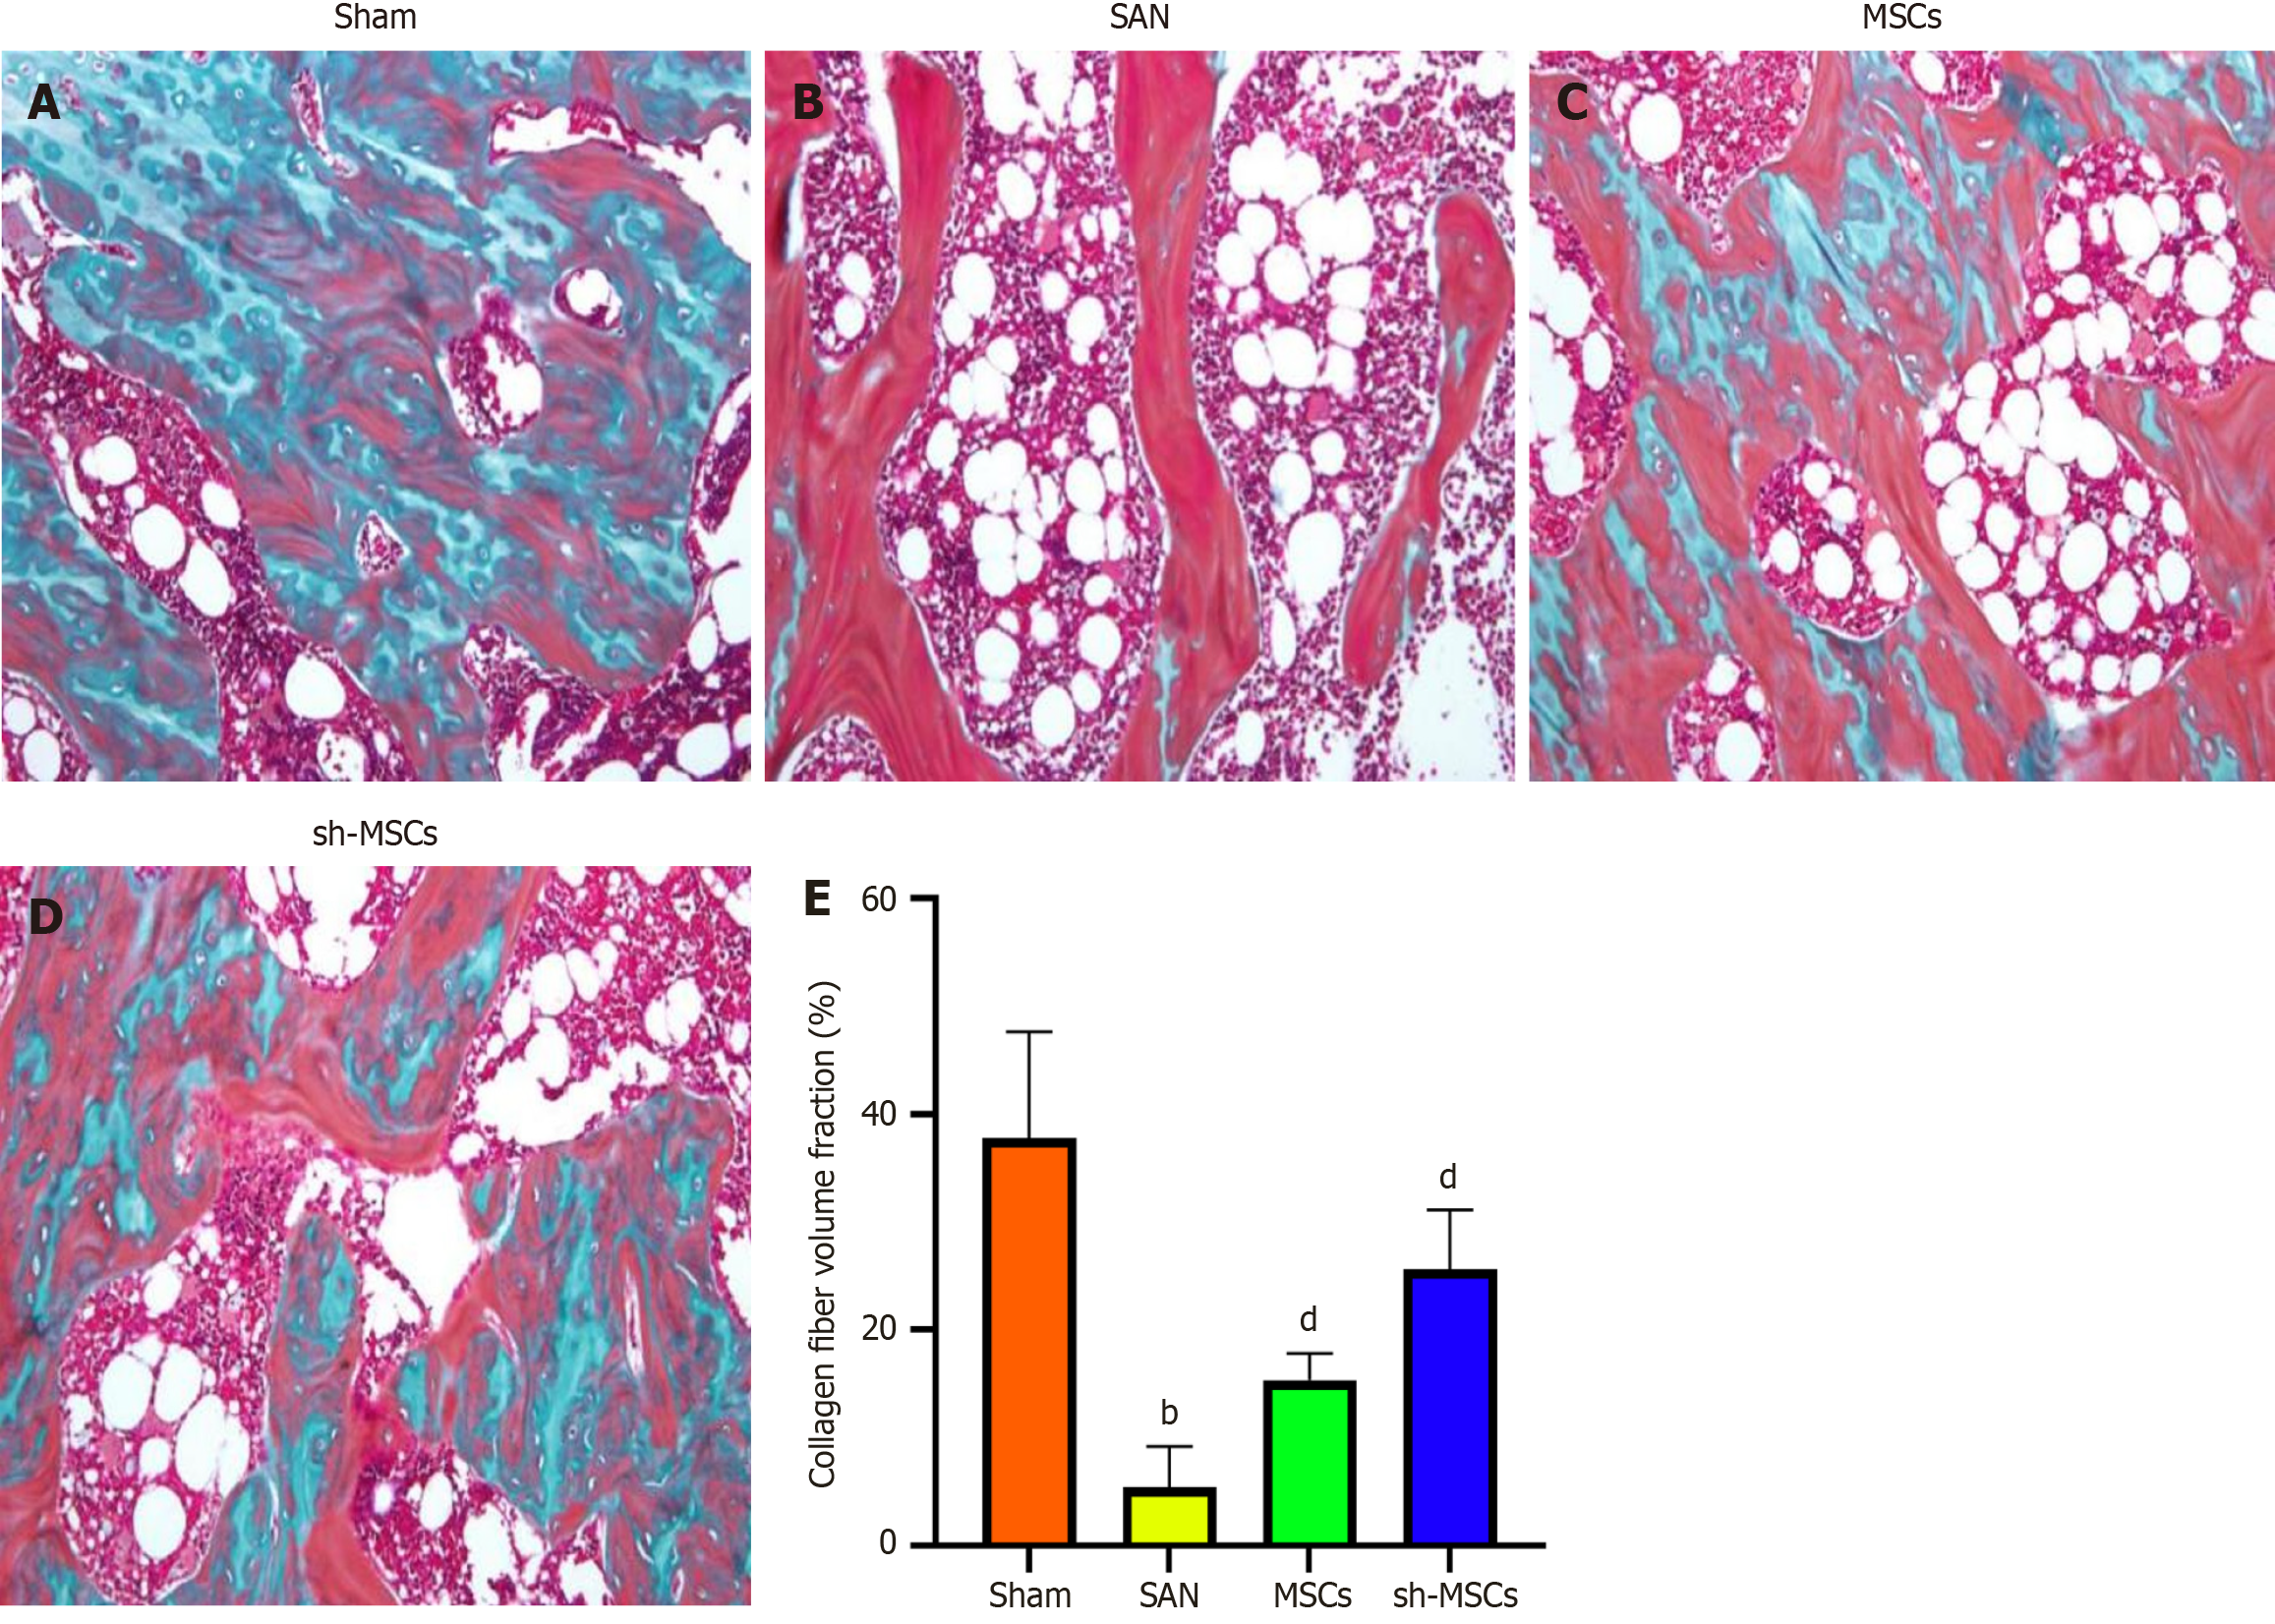
Figure 5 Sclerostin inhibitor-silenced human umbilical cord mesenchymal stem cells promote new bone formation in mice with steroid-induced avascular necrosis of the femoral head.
A and B: Masson staining revealed distinct bone repair patterns: Sham group showed prominent blue-stained new bone areas, indicating active repair (A), SAN group exhibited predominantly red-stained old bone with minimal blue areas, suggesting impaired repair (B); C and D: Both MSCs-treated groups displayed osteoblasts, with sh-MSCs group (D) showing more extensive blue staining than MSCs group (C); E: Quantification demonstrated significantly reduced collagen fiber volume in SAN group vs sham (P < 0.01). MSC treatments restored collagen content, with sh-MSCs showing superior improvement vs MSCs (P < 0.01 vs SAN). Data represent mean ± SEM from three independent experiments. bP < 0.01 vs sham; dP < 0.01 vs SAN. SAN: Steroid-induced avascular necrosis of the femoral head; MSC: Mesenchymal stem cell.
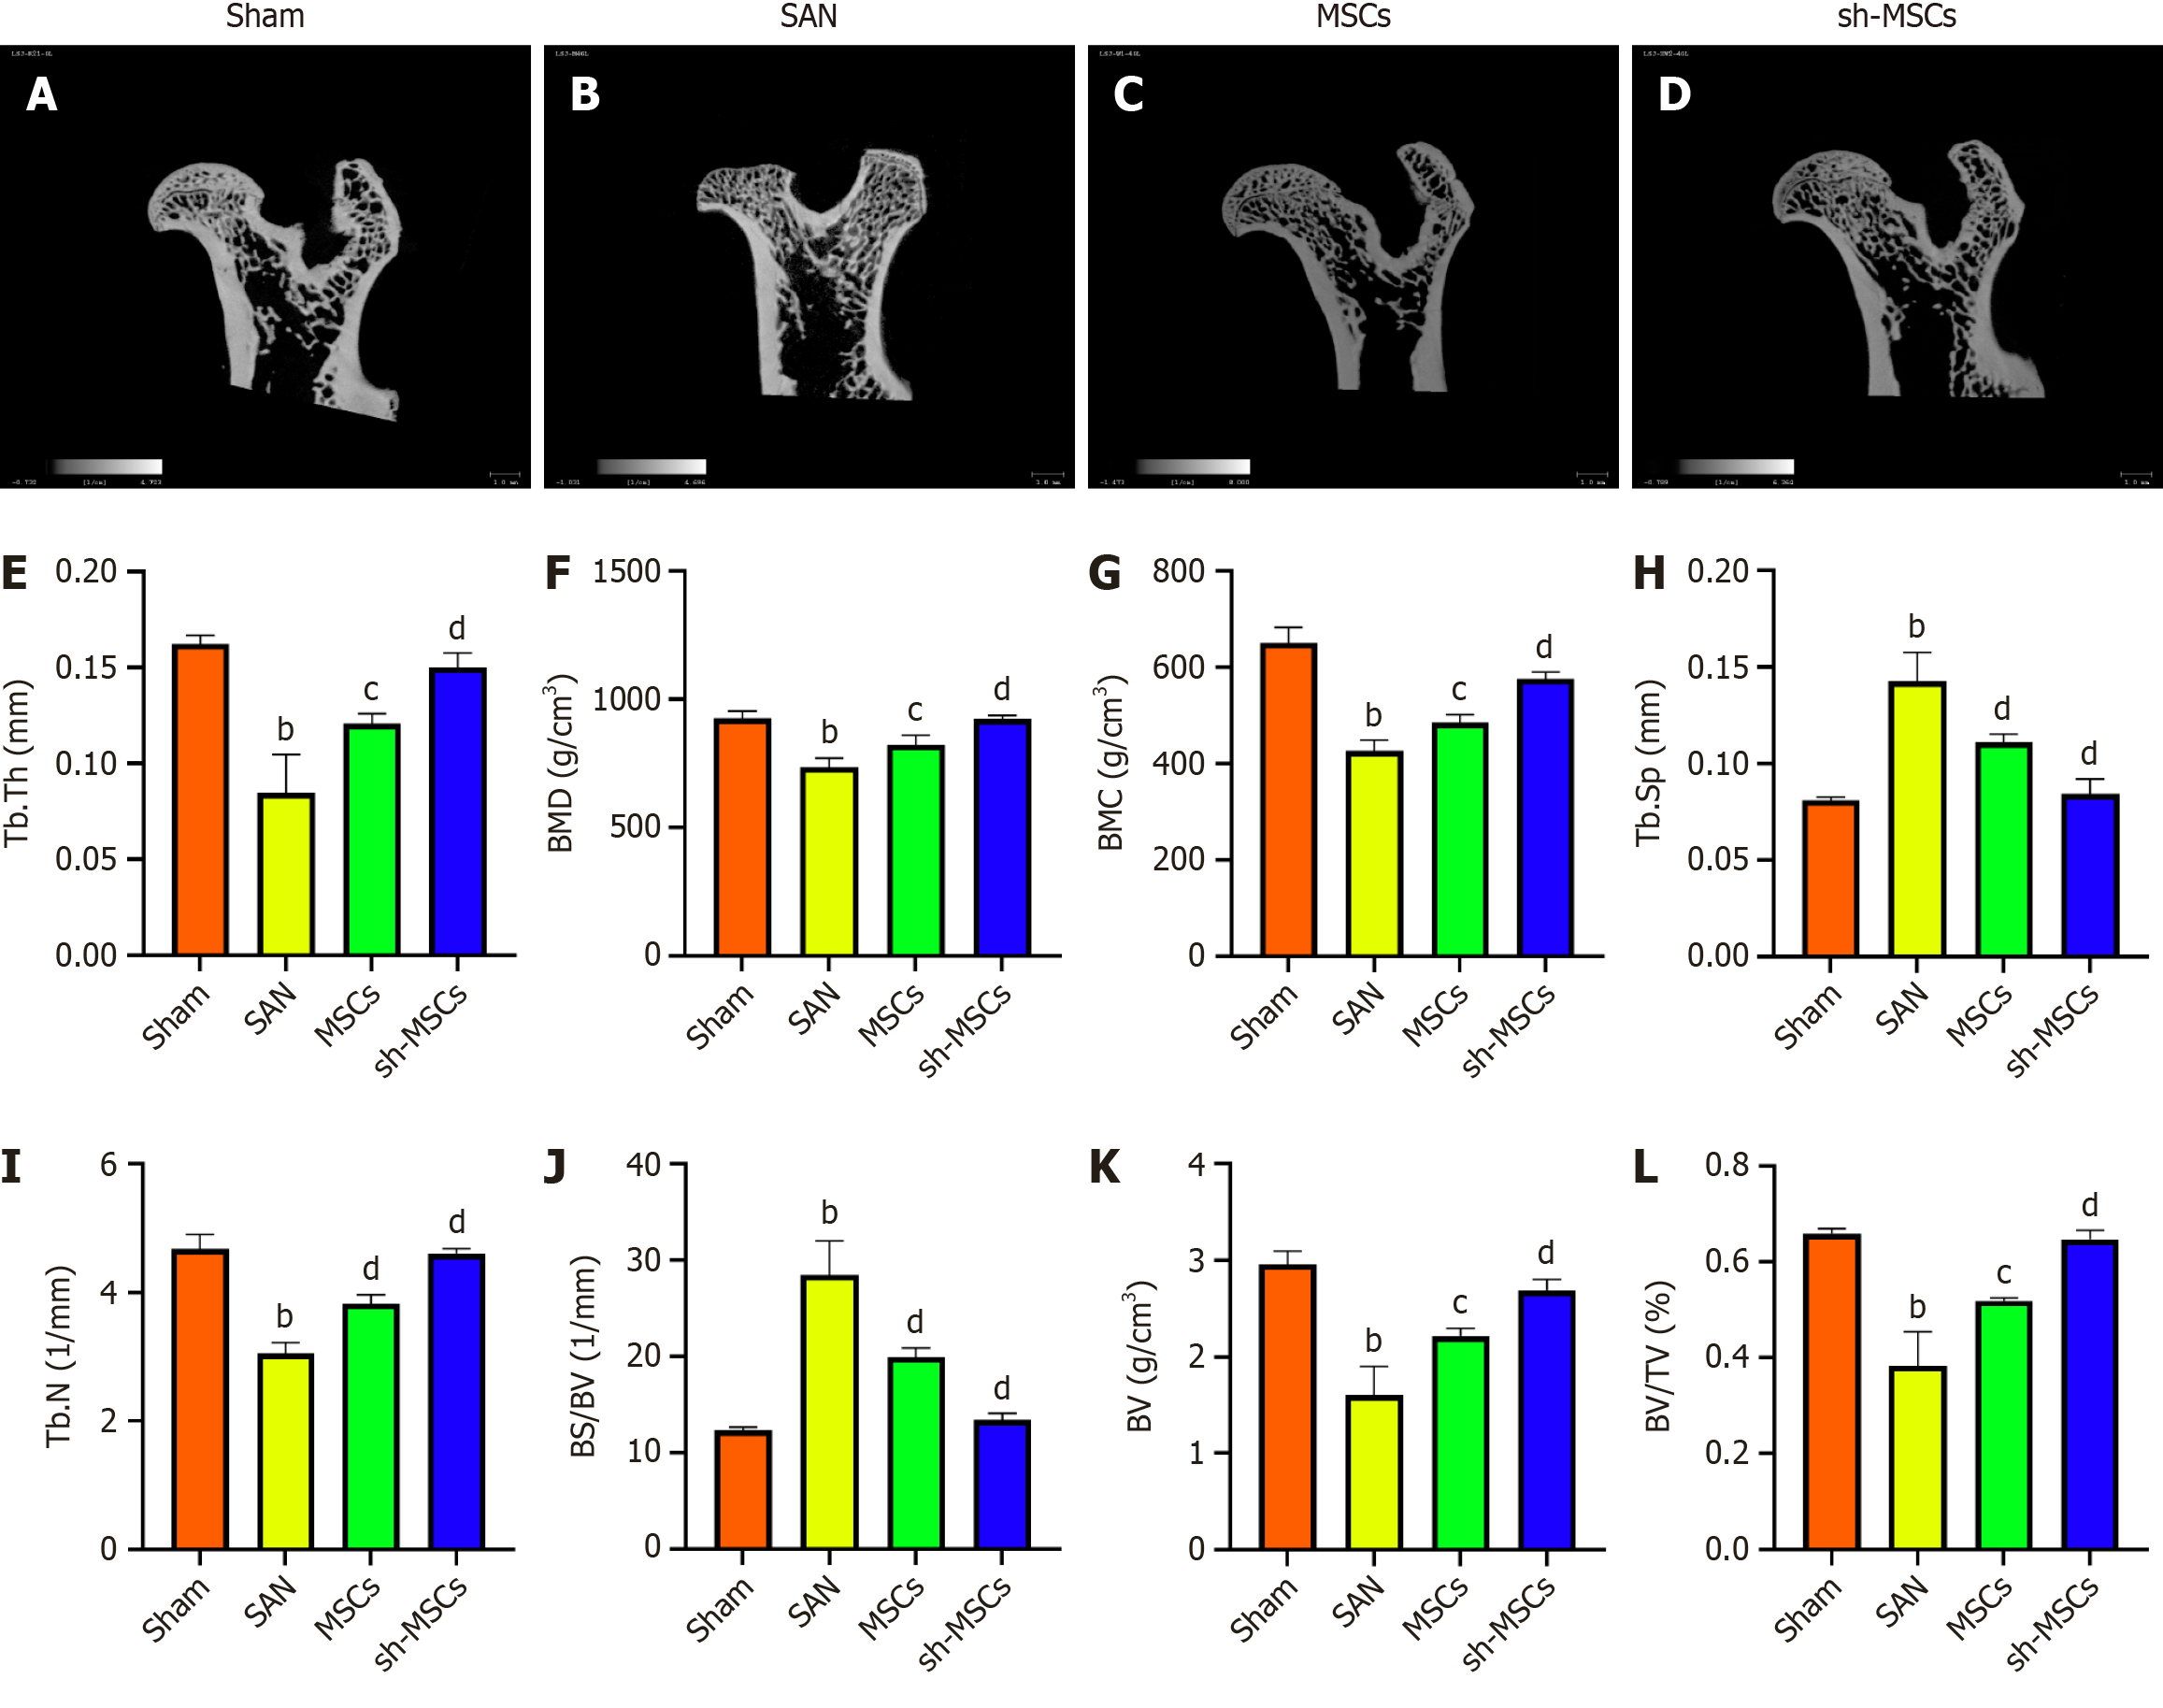
Figure 6 Restoration effect of sclerostin inhibitor-silenced human umbilical cord mesenchymal stem cells on cancellous bone mass and microstructure in mice with steroid-induced avascular necrosis of the femoral head.
A-D: Micro-computed tomography showed that the femoral head in the sham (A) group had intact morphology and dense trabecular structure. The trabecular morphology of the subchondral region of the femoral head in the SAN group (B) was significantly different from that in the sham (A) group. The trabeculae were sparsely arranged, the gaps were enlarged, and cavities appeared under the cartilage of the femoral head. The femoral head morphology, cancellous bone and trabecular structure changes in the MSCs group (C) and the sh-MSCs group (D) were improved compared with the SAN group, and the sh-MSCs group was better than the MSCs group; E-L: Trabecular thickness, bone mineral density, bone mineral content, trabecular number, trabecular spacing, bone surface area to bone volume ratio, bone volume, and bone volume fraction of femoral head of mice in each group determined by micro-computed tomography. Data represent mean ± SEM from three independent experiments. aP < 0.05 vs sham, bP < 0.01 vs sham; cP < 0.05 vs SAN, dP < 0.01 vs SAN. SAN: Steroid-induced avascular necrosis of the femoral head; MSC: Mesenchymal stem cell; Tb.Th: Trabecular thickness; BMD: Bone mineral content; BMC: Bone mineral content; Tb.Sp: Trabecular spacing; Tb.N: Trabecular number; BS/BV: Bone surface area to bone volume ratio; BV: Bone volume; BV/TV: Bone volume fraction.
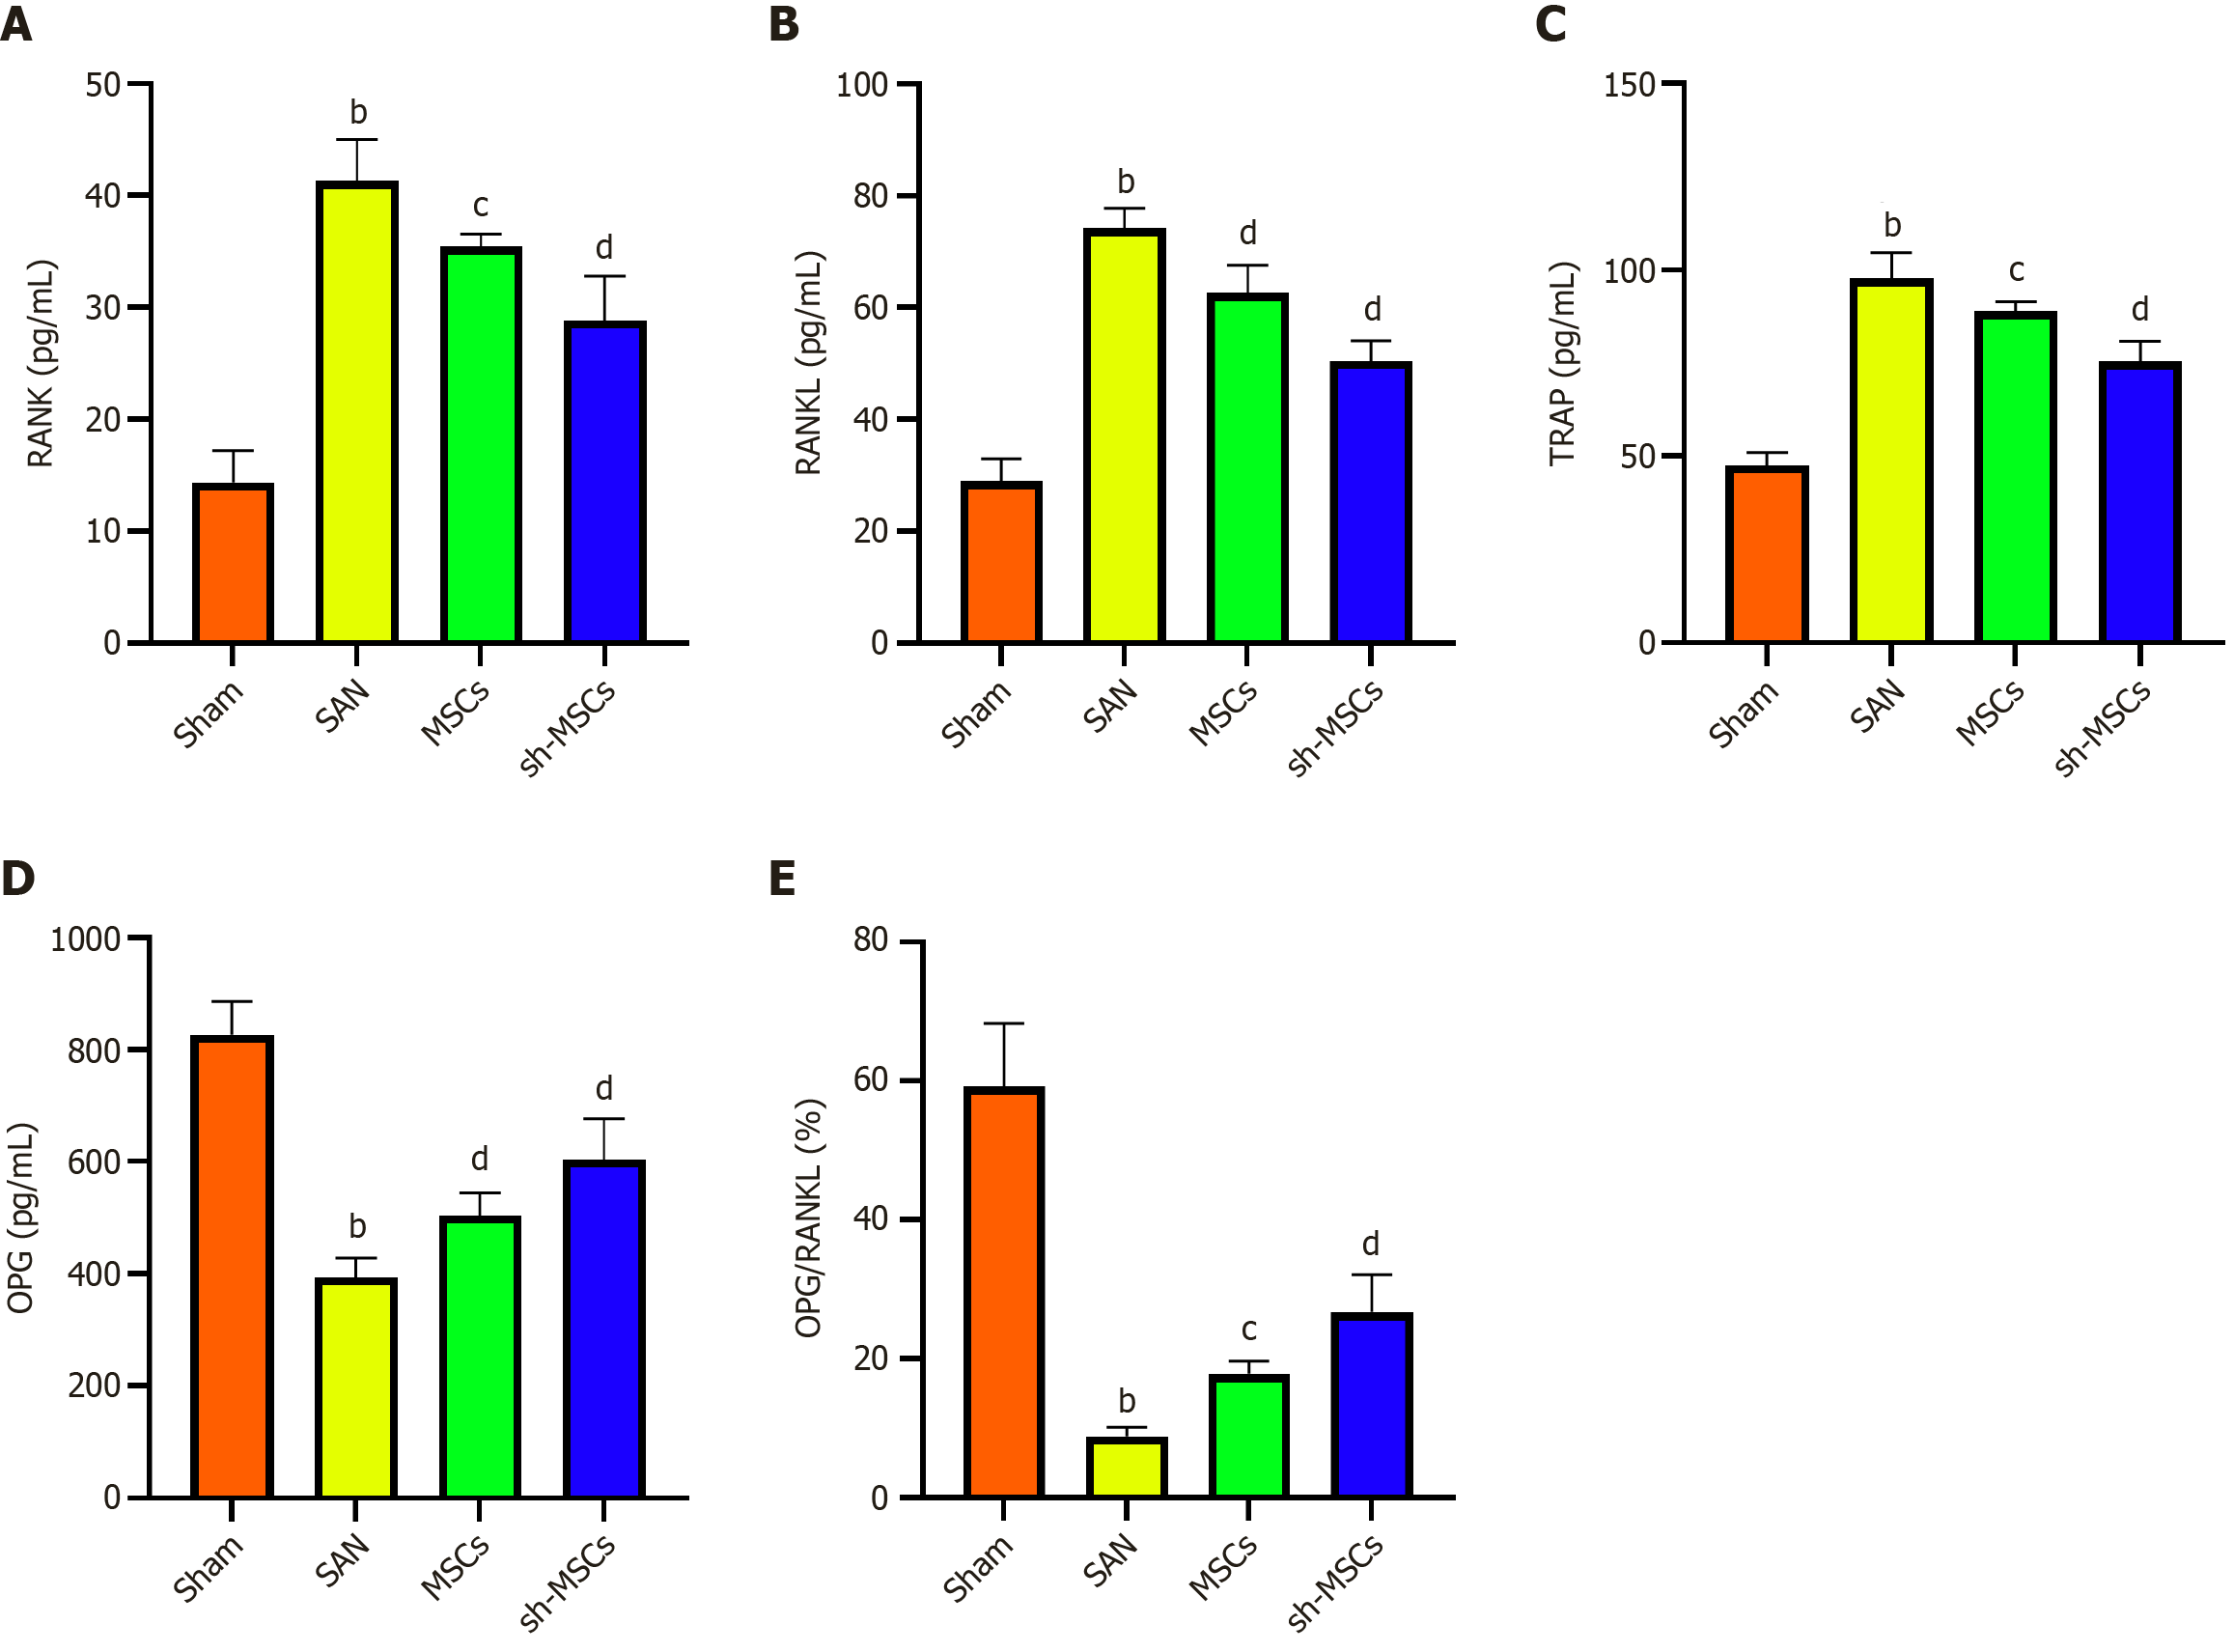
Figure 7 Effect of sclerostin inhibitor-silenced human umbilical cord mesenchymal stem cells on the expression of serum bone metabolism factors in mice with steroid-induced avascular necrosis of the femoral head.
A-E: The serum levels of receptor activator of nuclear factor kappa B (RANK), RANK ligand, tartrate-resistant acid phosphatase, osteoprotegerin, and osteoprotegerin/RANK ligand were determined by enzyme-linked immunosorbent assay in each group of mice. Data represent mean ± SEM from three independent experiments. bP < 0.01 vs sham; cP < 0.05 vs SAN; dP < 0.01. RANK: Receptor activator of nuclear factor kappa B; RANKL: Receptor activator of nuclear factor kappa B ligand; TRAP: Tartrate-resistant acid phosphatase; OPG: Osteoprotegerin; SAN: Steroid-induced avascular necrosis of the femoral head; MSC: Mesenchymal stem cell.
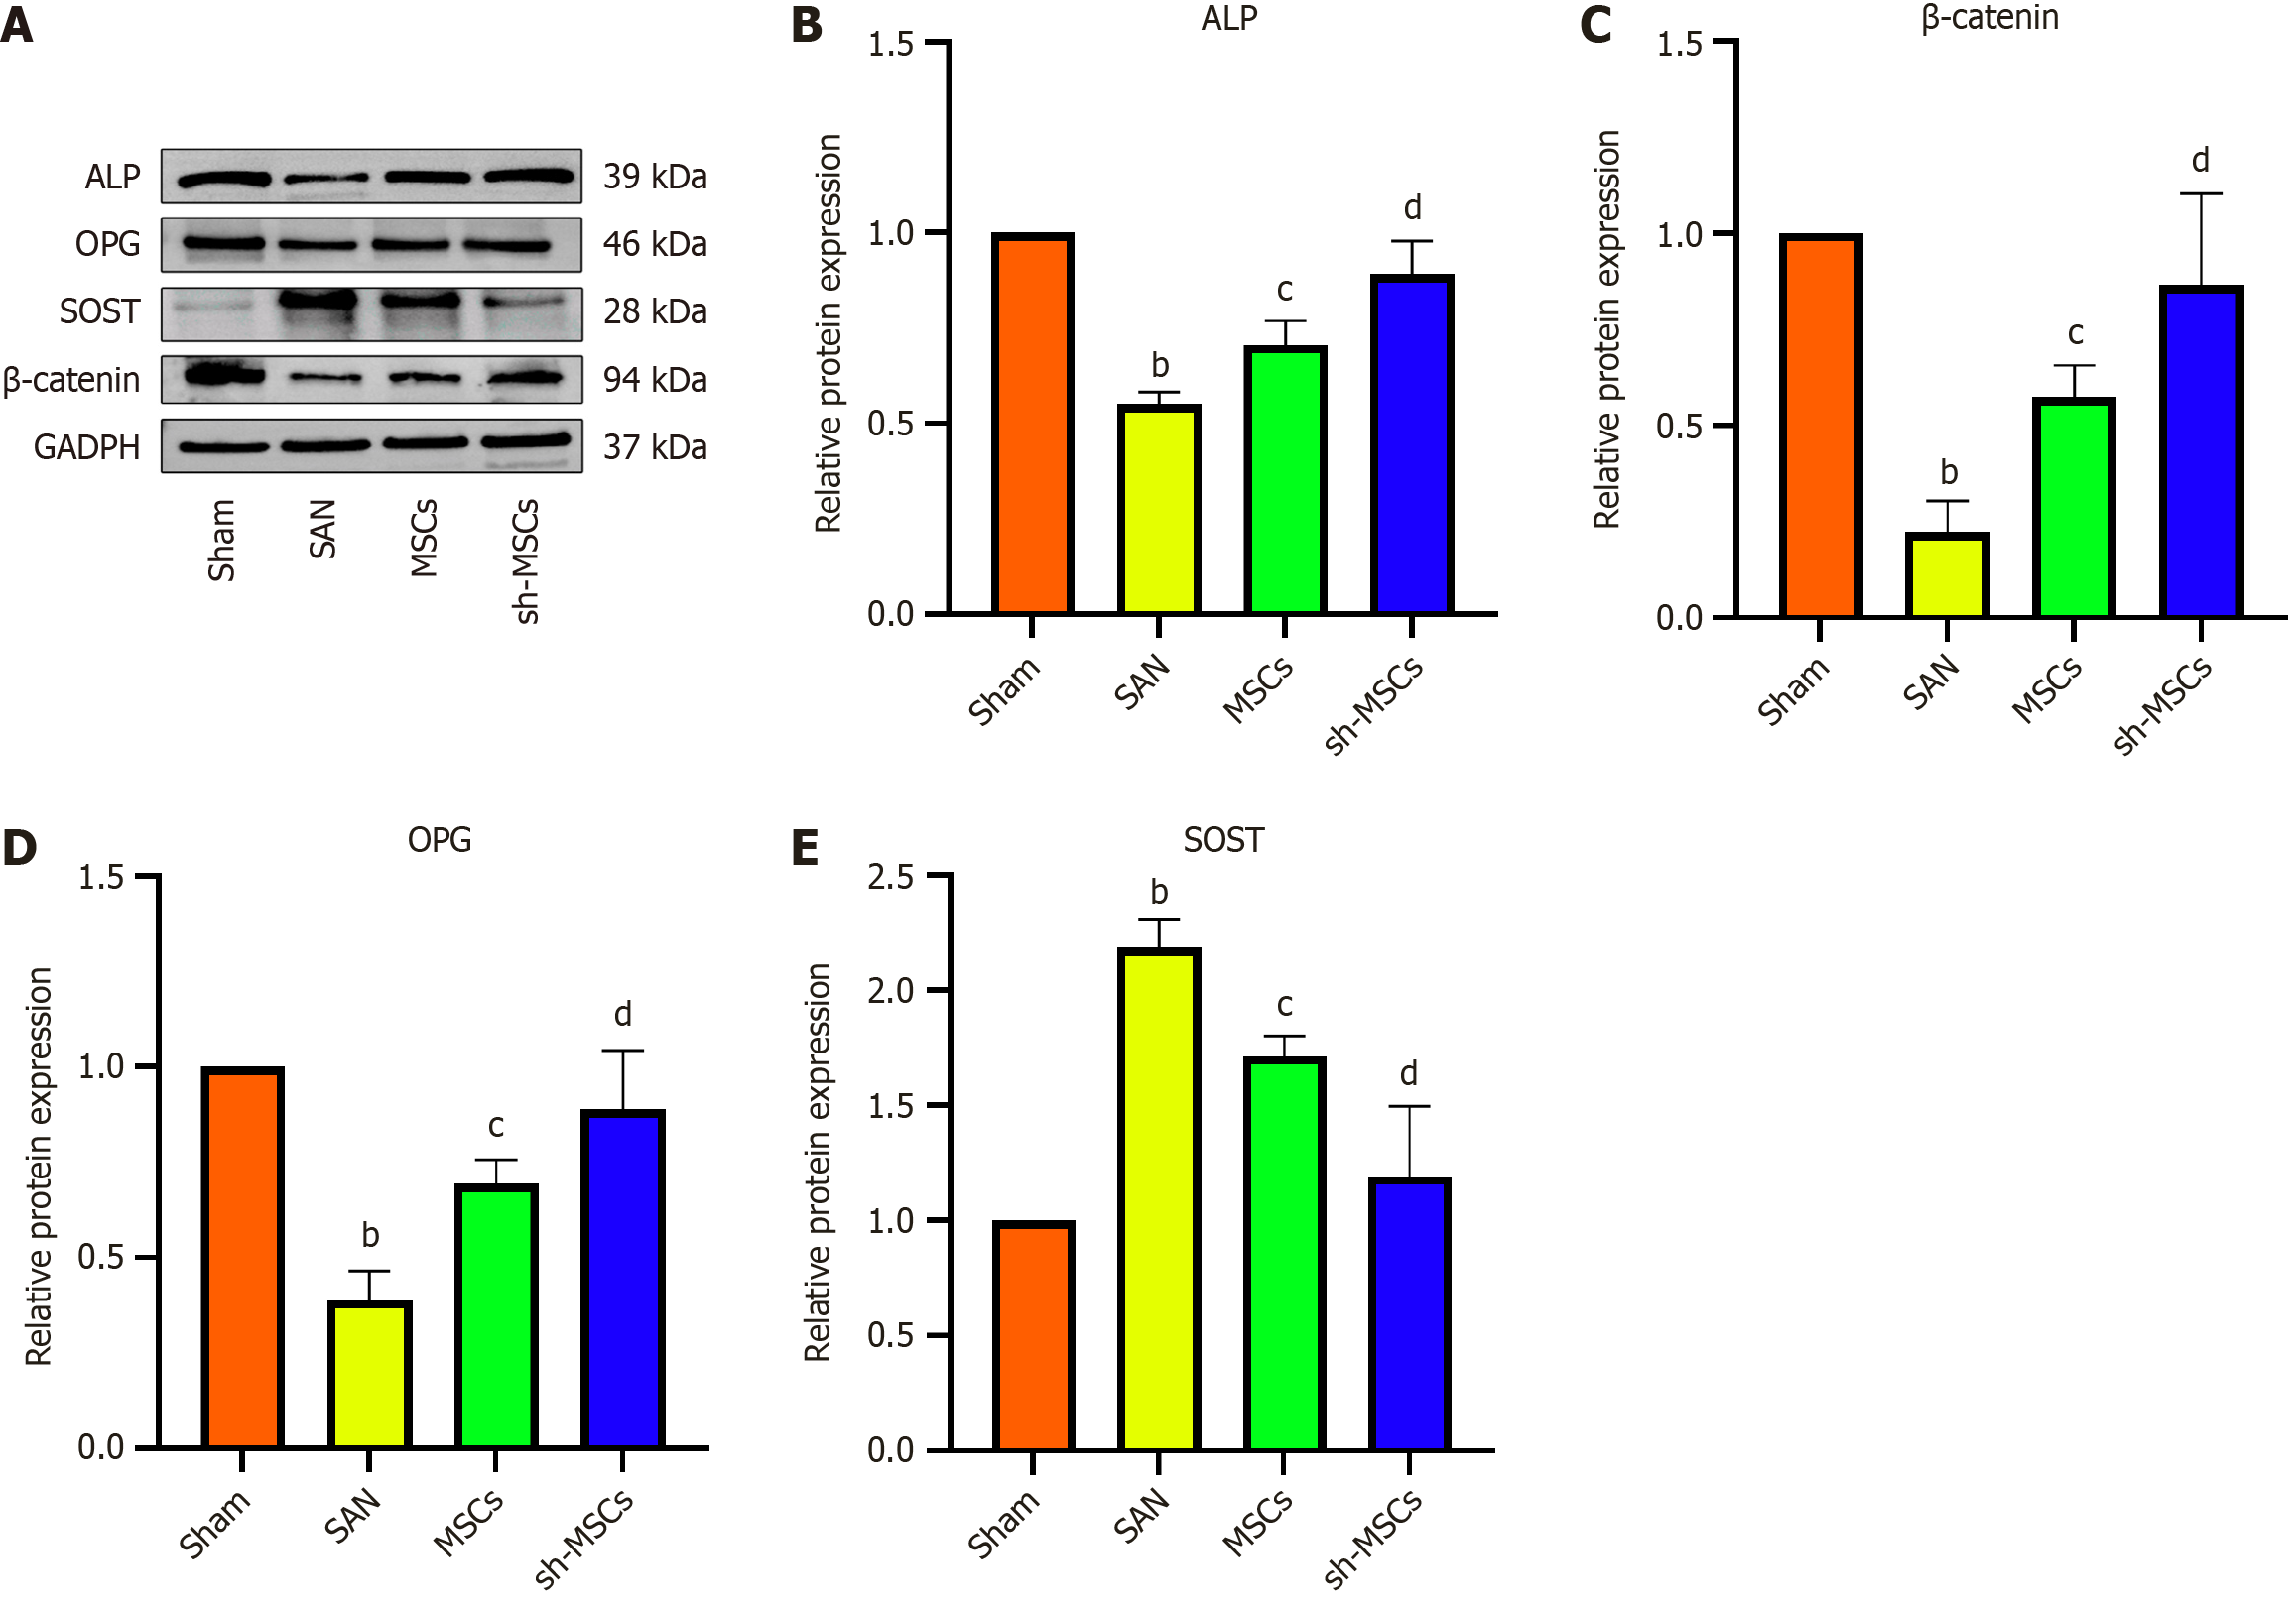
Figure 8 Effect of sclerostin inhibitor-silenced human umbilical cord mesenchymal stem cells on the expression of bone metabolic factors in the bone marrow of mice with steroid-induced avascular necrosis of the femoral head.
A: Western bolt original picture; B-D: The expression level of alkaline phosphatase, β-catenin and osteoprotegerin were the lowest in the SAN group, the highest in the sham group, and the expression level of alkaline phosphatase, β-catenin and osteoprotegerin in the sh-MSCs group was less than that in the MSCs group; E: The expression level of sclerostin was the lowest in the sham group, the highest in the SAN group, and the expression level of sclerostin in the sh-MSCs group was less than that in the MSCs group. Data represent mean ± SEM from three independent experiments. bP < 0.01 vs sham; cP < 0.05 vs SAN; dP < 0.01 vs SAN. ALP: Alkaline phosphatase; OPG: Osteoprotegerin; SOST: Sclerostin; GADPH: Glyceraldehyde-3-phosphate dehydrogenase.
- Citation: Lv H, Zheng CF, Chen XY, Wei JH, Tao YZ, Feng L, Feng Z, Lu SJ. Sclerostin-silenced human umbilical cord mesenchymal stem cells ameliorate bone metabolism in steroid-induced femoral head necrosis. World J Stem Cells 2025; 17(10): 110190
- URL: https://www.wjgnet.com/1948-0210/full/v17/i10/110190.htm
- DOI: https://dx.doi.org/10.4252/wjsc.v17.i10.110190


