Copyright
©The Author(s) 2024.
World J Stem Cells. May 26, 2024; 16(5): 525-537
Published online May 26, 2024. doi: 10.4252/wjsc.v16.i5.525
Published online May 26, 2024. doi: 10.4252/wjsc.v16.i5.525
Figure 1 Experimental schedule.
Experimental timeline illustrating the protocol for inducing acute kidney injury using glycerol, as well as the treatment regimen involving either urine-derived stem cells or bone marrow mesenchymal stem cells. At time 0, glycerol was administered intramuscularly. The arrow on day three indicates the administration of 500000 cells or vehicle alone. The following arrows indicate the designated time points for sacrificing the subjects. USCs: Urine-derived stem cells; BMSCs: Bone marrow mesenchymal stem cells.
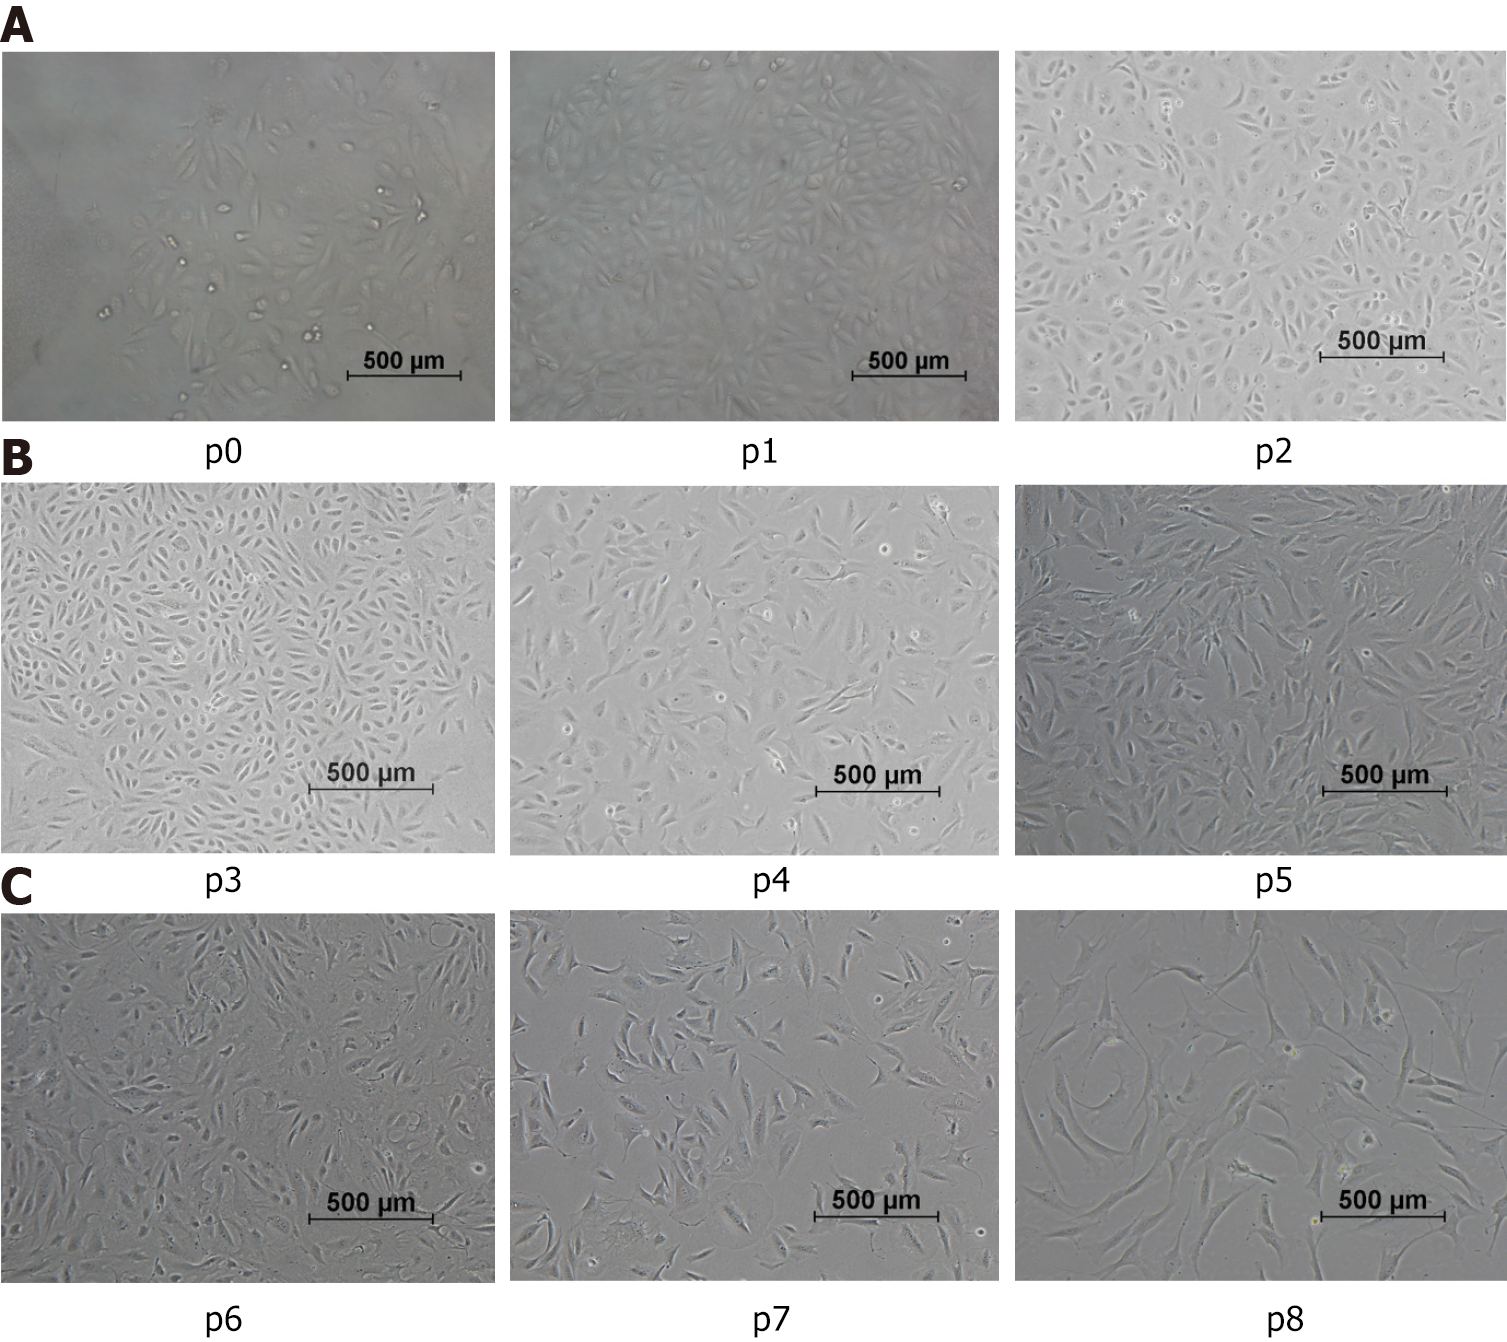
Figure 2 Morphological characteristics of urine-derived stem cells.
P0: Representative characteristics of the urine-derived stem cells (USCs) at primary passage within 48 h: The cells exhibiting individual colonies adhered to the culture plates, and nonadherent or sparsely adherent small round cells were scattered in the culture plates (100 ×). A: p1-p3: Representative characteristics of USCs from passage 1 to passage 3, between day 3 and day 12: The cell morphology gradually changed from the original “rice-like” shape to a “spindle-like” shape (100 ×); B: p4-p6: The morphology of cells displayed changes that suggest a potential for diverse differentiation, as indicated by variations in shape resembling, but not confirmed to be, endothelial and smooth muscle cell morphologies; C: p7-p8: The morphology of cells from passage 7 to 8 remained in a fibrocyte-like form with a long fusiform shape and grew in the same direction (100 ×).
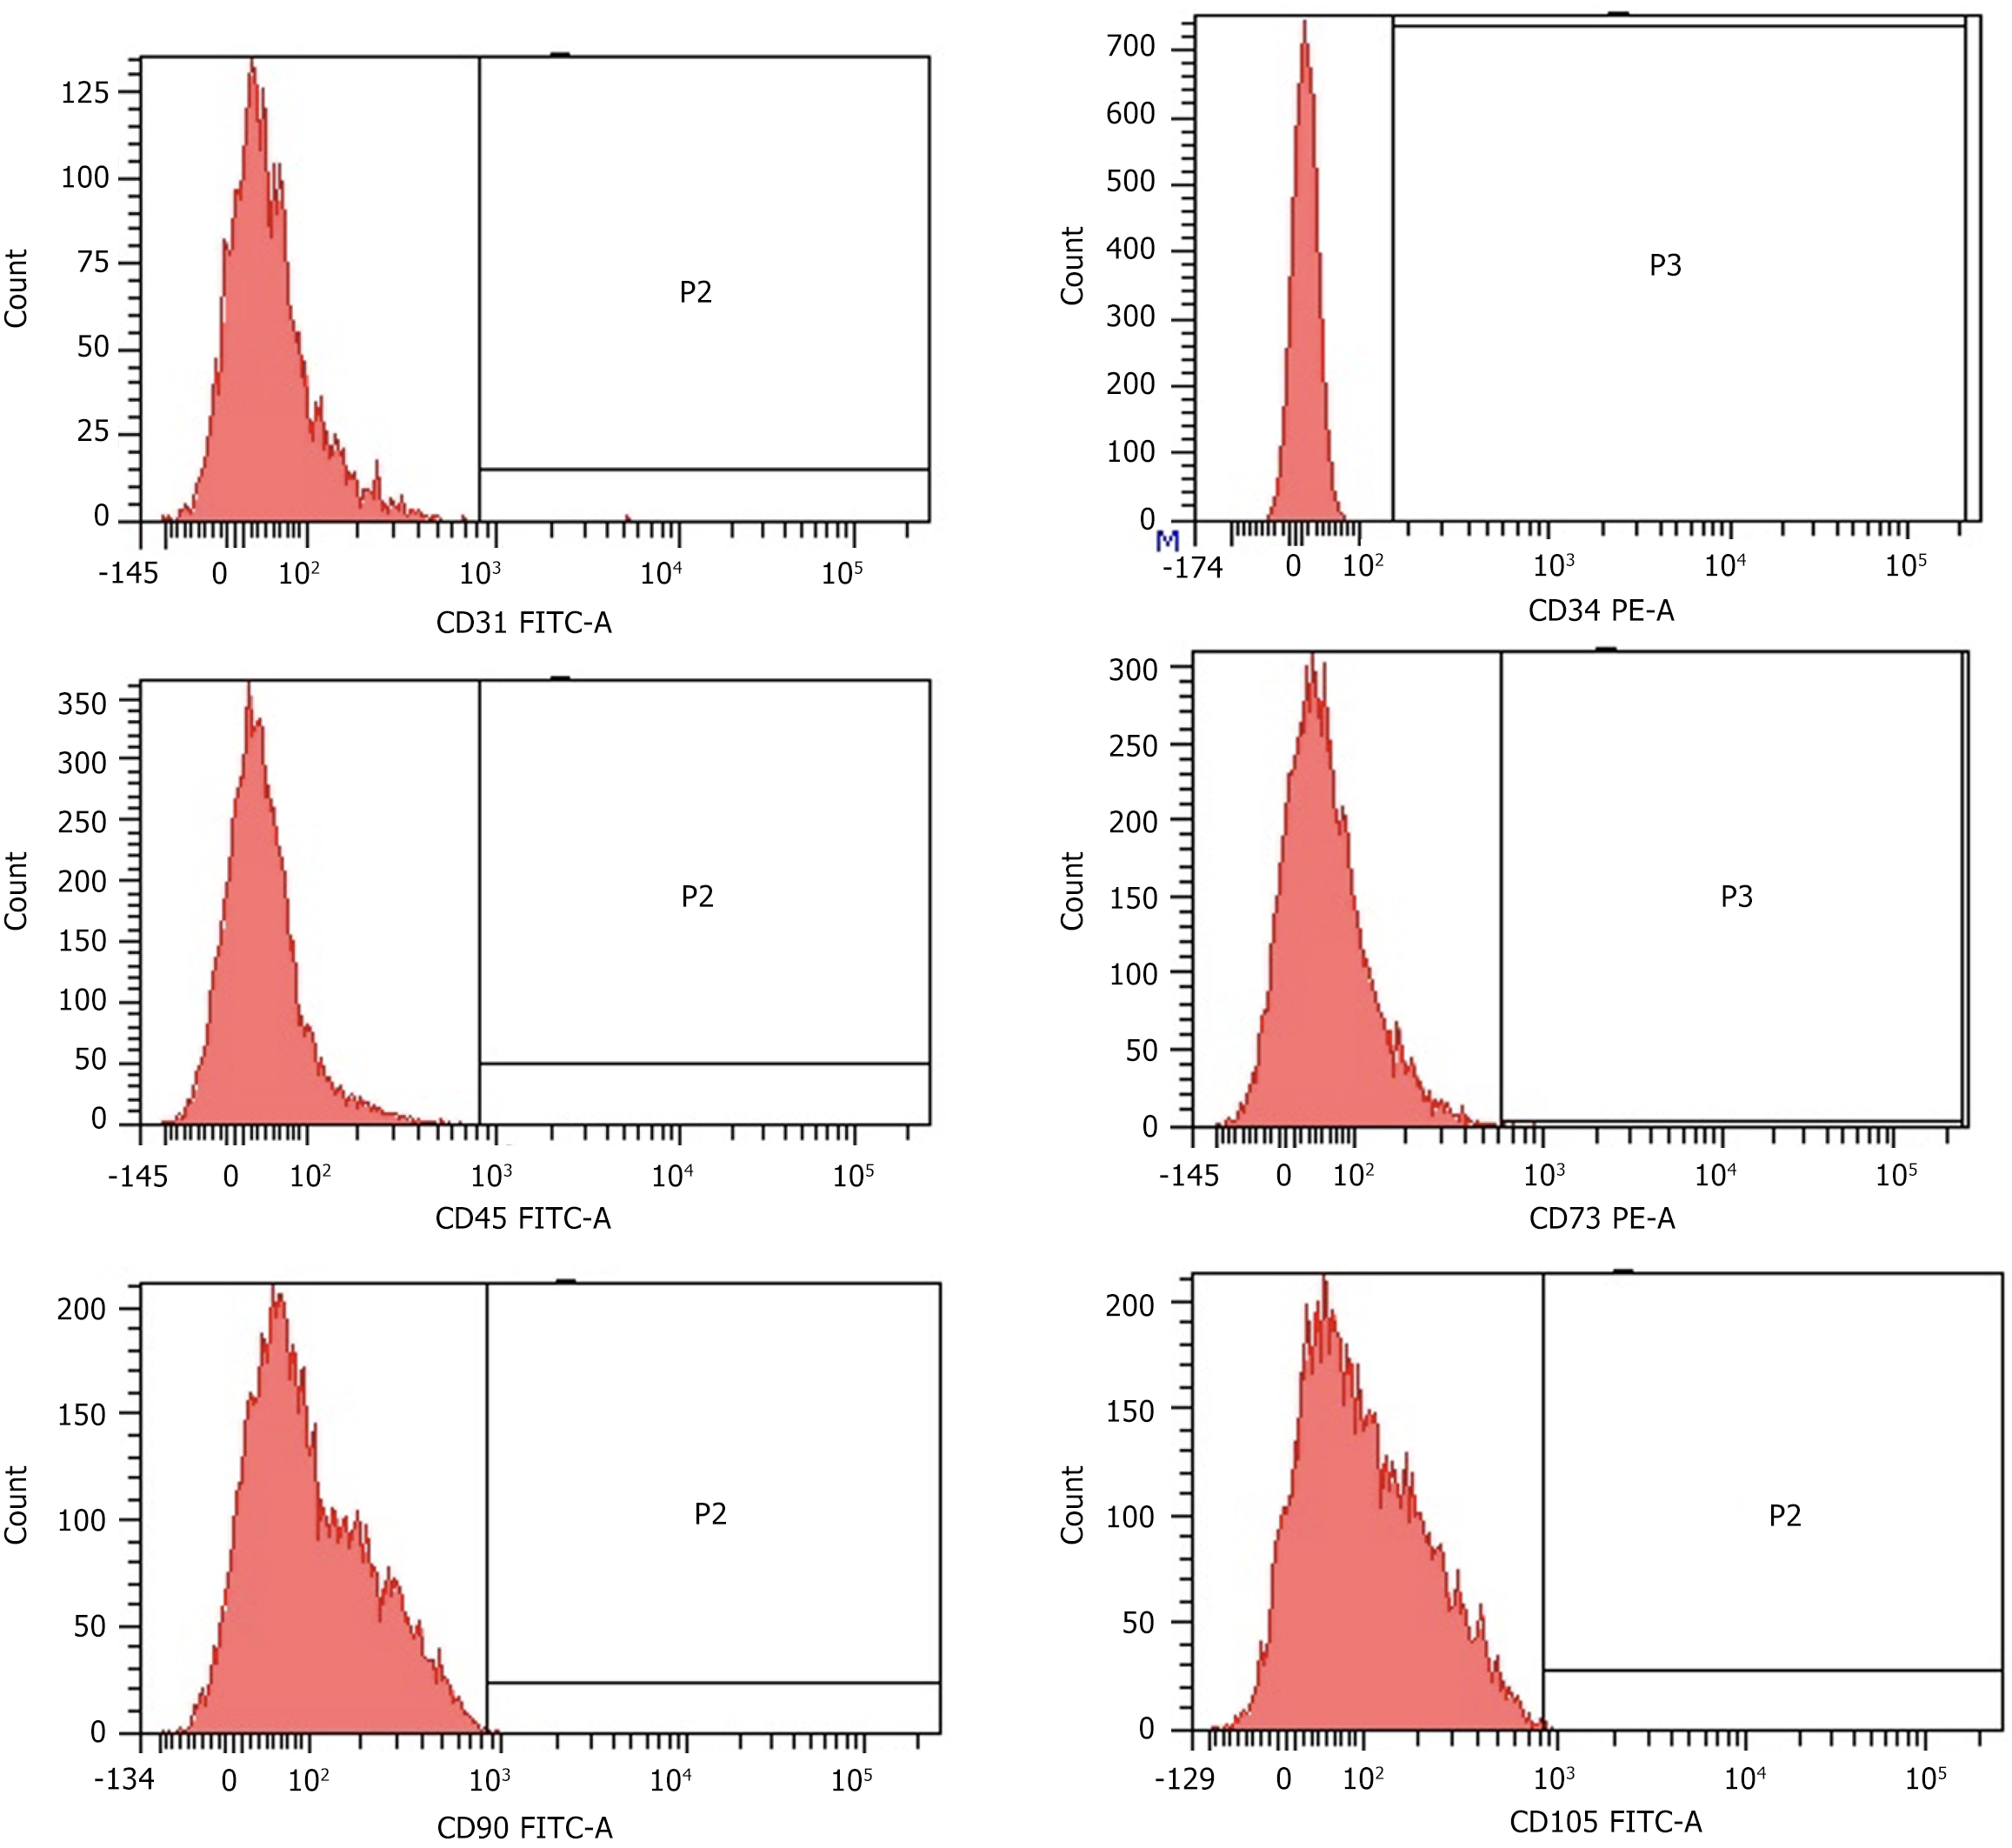
Figure 3 Surface marker expression of CD31, CD34, CD45 CD73, CD90 and CD105 in urine-derived stem cells after the 3rd passage analyzed by flow cytometry.
All analyzed urine-derived stem cells (n = 9) showed similar results in passages 2 to 4. FITC: Fluorescein isothiocyanate; PE: Phycoerythrin.
Figure 4 Differentiation characteristics of the urine-derived stem cells at passage 2.
A: Representative osteogenesis was detected by alkaline phosphatase staining on day 7; B: Representative adipogenic differentiation visualized by Oil Red O staining of the intracellular lipid vesicles on day 21; C: Representative chondrogenic differentiation detected by Alcian blue staining on day 28. The micrographs are representative of 9 experiments.
Figure 5 Assessment of renal function.
A and B: The changes in renal function were assessed by measuring creatinine levels (A) and blood urea nitrogen (BUN) levels (B). After glycerol injection, the creatinine levels increased starting on day three. However, in mice administered urine-derived stem cells or bone marrow mesenchymal stem cells, the creatinine levels decreased to near baseline levels within 48 h post-injection and remained stable for the duration of the experiment (A). A similar trend was observed when measuring BUN levels (B). To determine the statistical significance of these results, an analysis of variance was performed. aP < 0.05, the comparison between stem cell-treated and untreated groups showed statistical significance. BUN: Blood urea nitrogen; USC: Urine-derived stem cell; BMSC: Bone marrow mesenchymal stem cell.
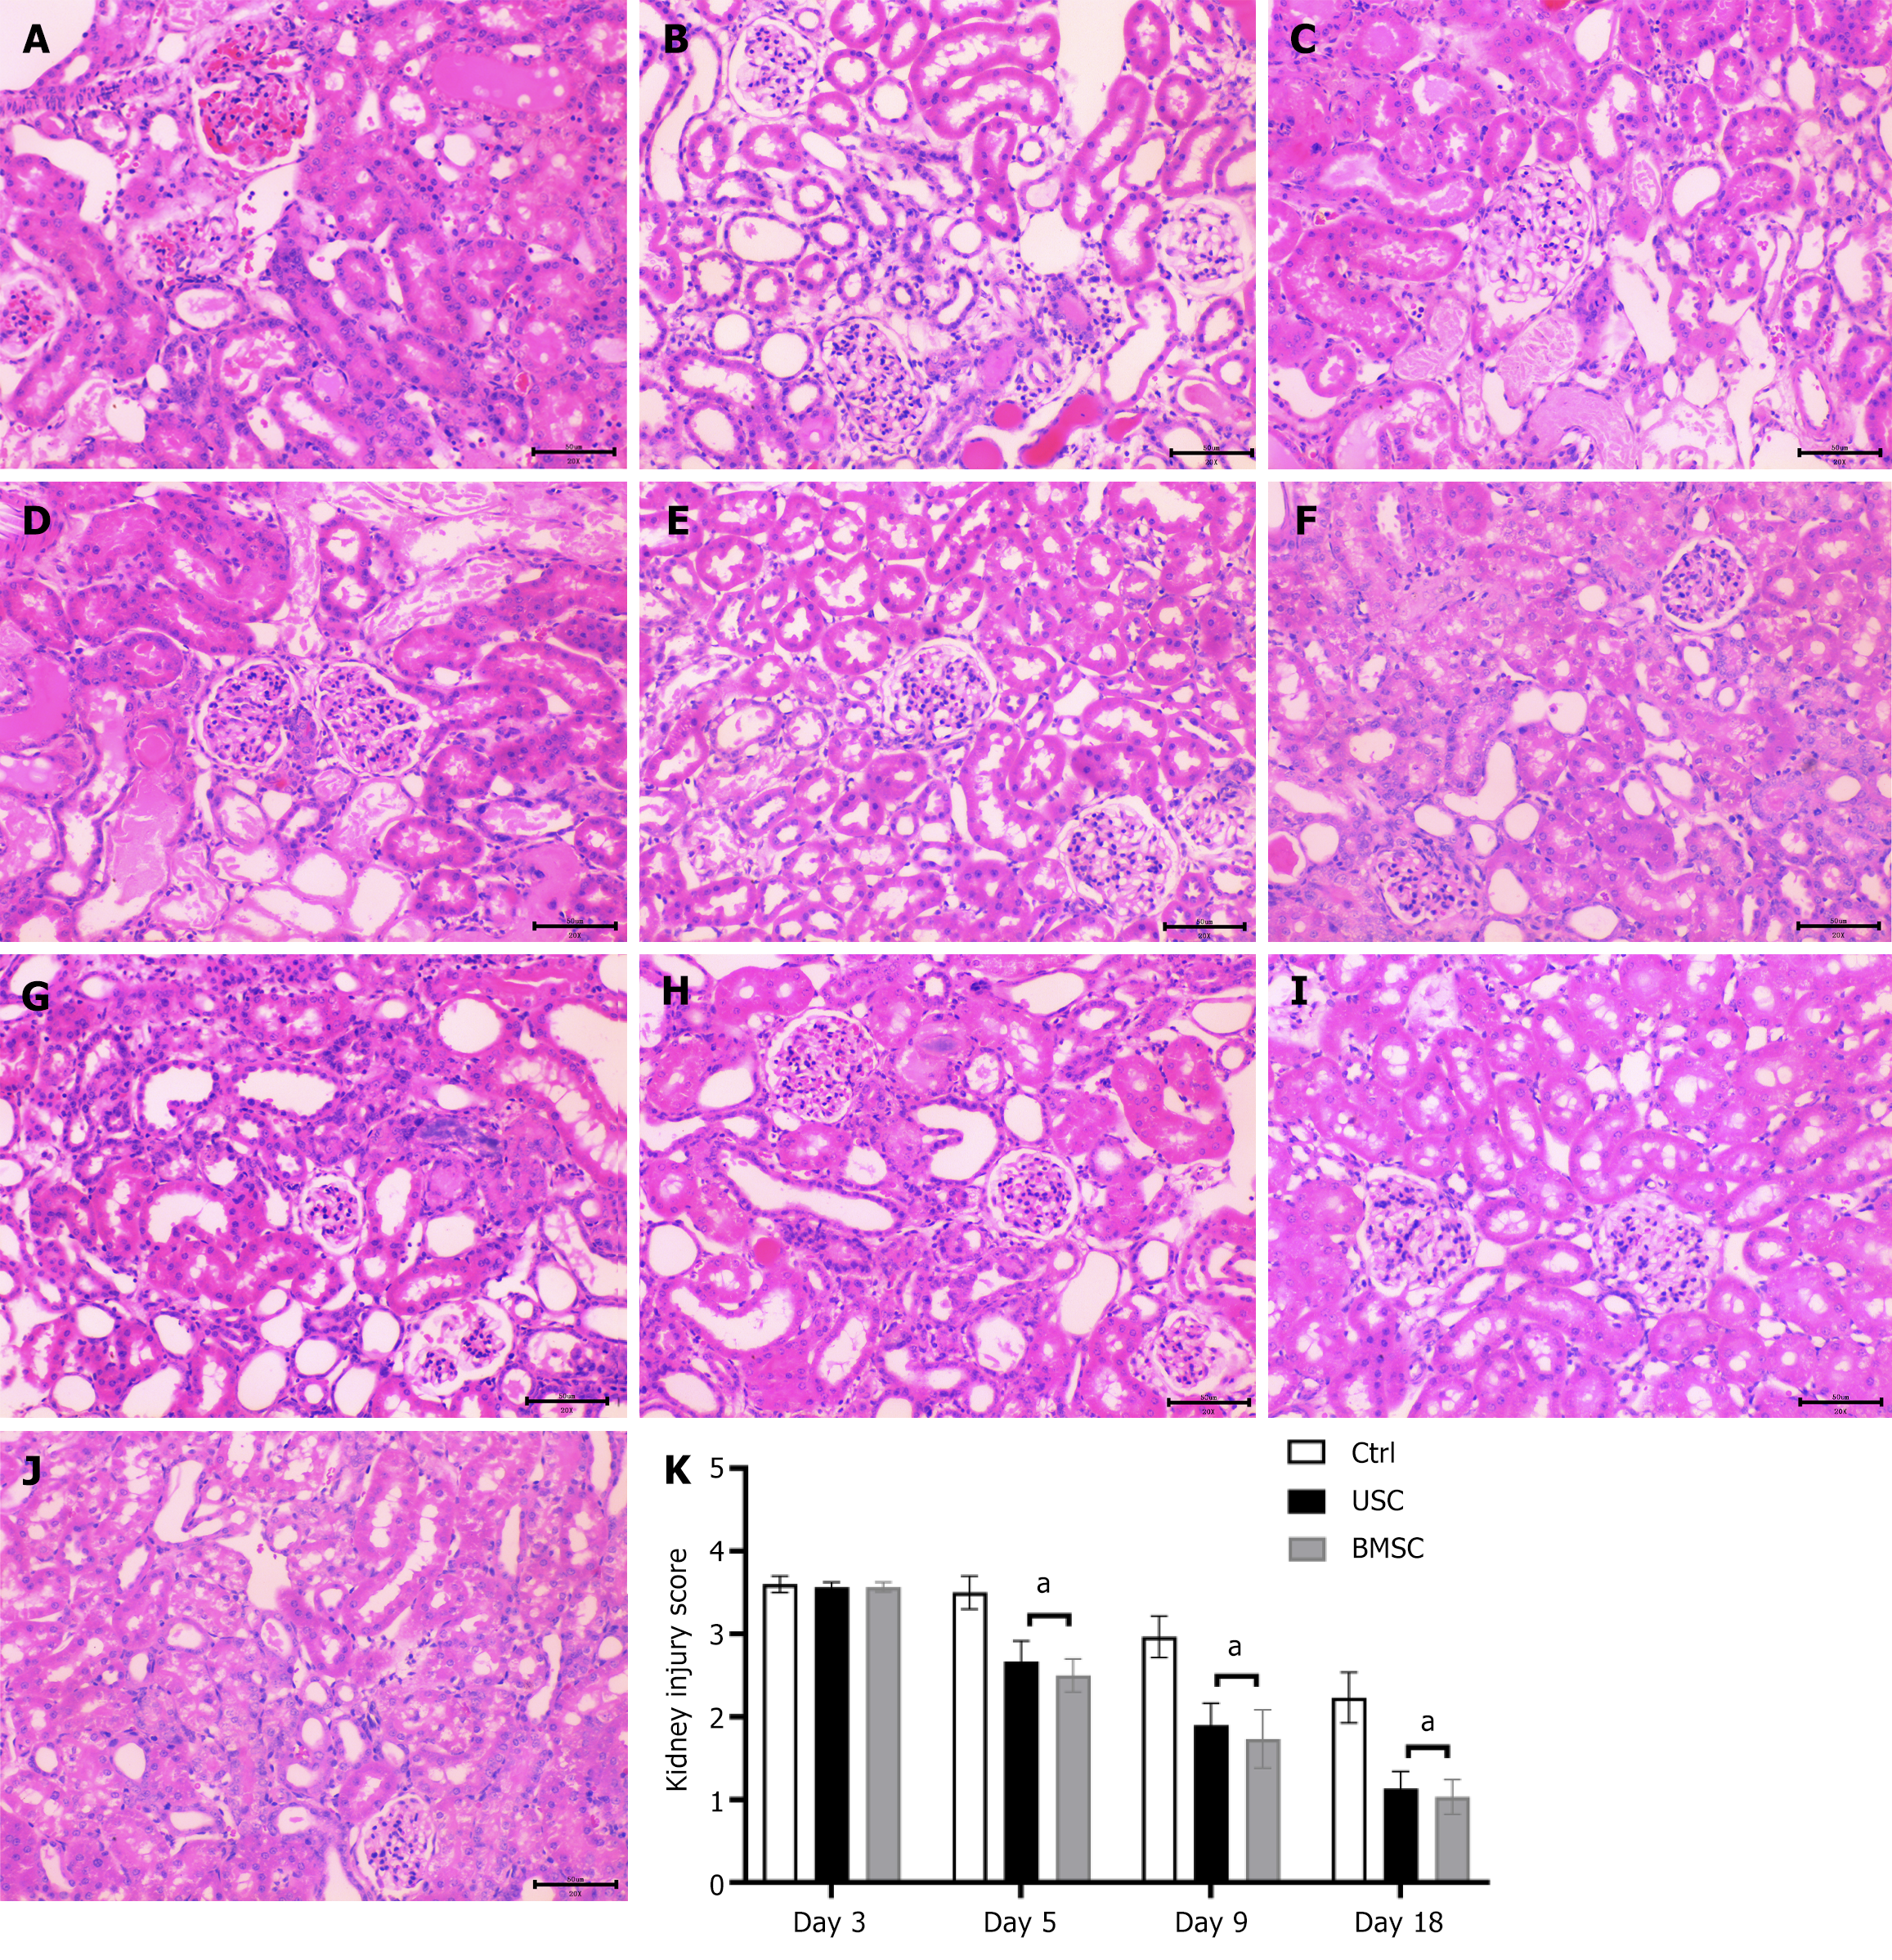
Figure 6 Histological findings of acute kidney injury by hematoxylin and eosin staining (200 ×) in urine-derived stem cell-treated, bone marrow mesenchymal stem cell-treated and control untreated mice.
A-D: Representative micrographs of renal tissue from mice on day 3 (A) and day 5 (D) after the glycerol injection procedure, demonstrating tubular dilatation (red asterisk), tubular necrosis (green arrows), tubular protein cast formation (black asterisk), dilatation of Bowman’s capsule (blue arrows) and loss of the brush border in renal tubules (yellow arrows). Representative micrographs of renal tissue from mice on day 5 post-glycerol injection treated with urine-derived stem cells (USCs) (B) and bone marrow mesenchymal stem cells (BMSCs) (C), showing signs of tissue injury recovery; E-G: Representative micrographs of renal tissue from mice on day 9 post-glycerol injection, exhibiting the persistence of renal injury in untreated mice (G) and signs of recovery in USC-treated (E) or BMSC-treated (F) mice; H-J: Representative micrographs of renal tissue from mice on day 18 showing the normal morphology of tissue in mice untreated (H) or treated with USCs (I) and BMSCs (J). Scale bars in the lower right corner represent 50 μm; K: Graphs illustrating the quantification of kidney injury scores at days 3, 5, 9, and 18 in acute kidney injury mice treated with USCs or BMSCs or injected with saline as a control. Statistical significance was calculated using analysis of variance with the Newman-Keuls multiple comparison test: aP < 0.05, stem cells in acute kidney injury-treated versus untreated mice. USC: Urine-derived stem cell; BMSC: Bone marrow mesenchymal stem cell.
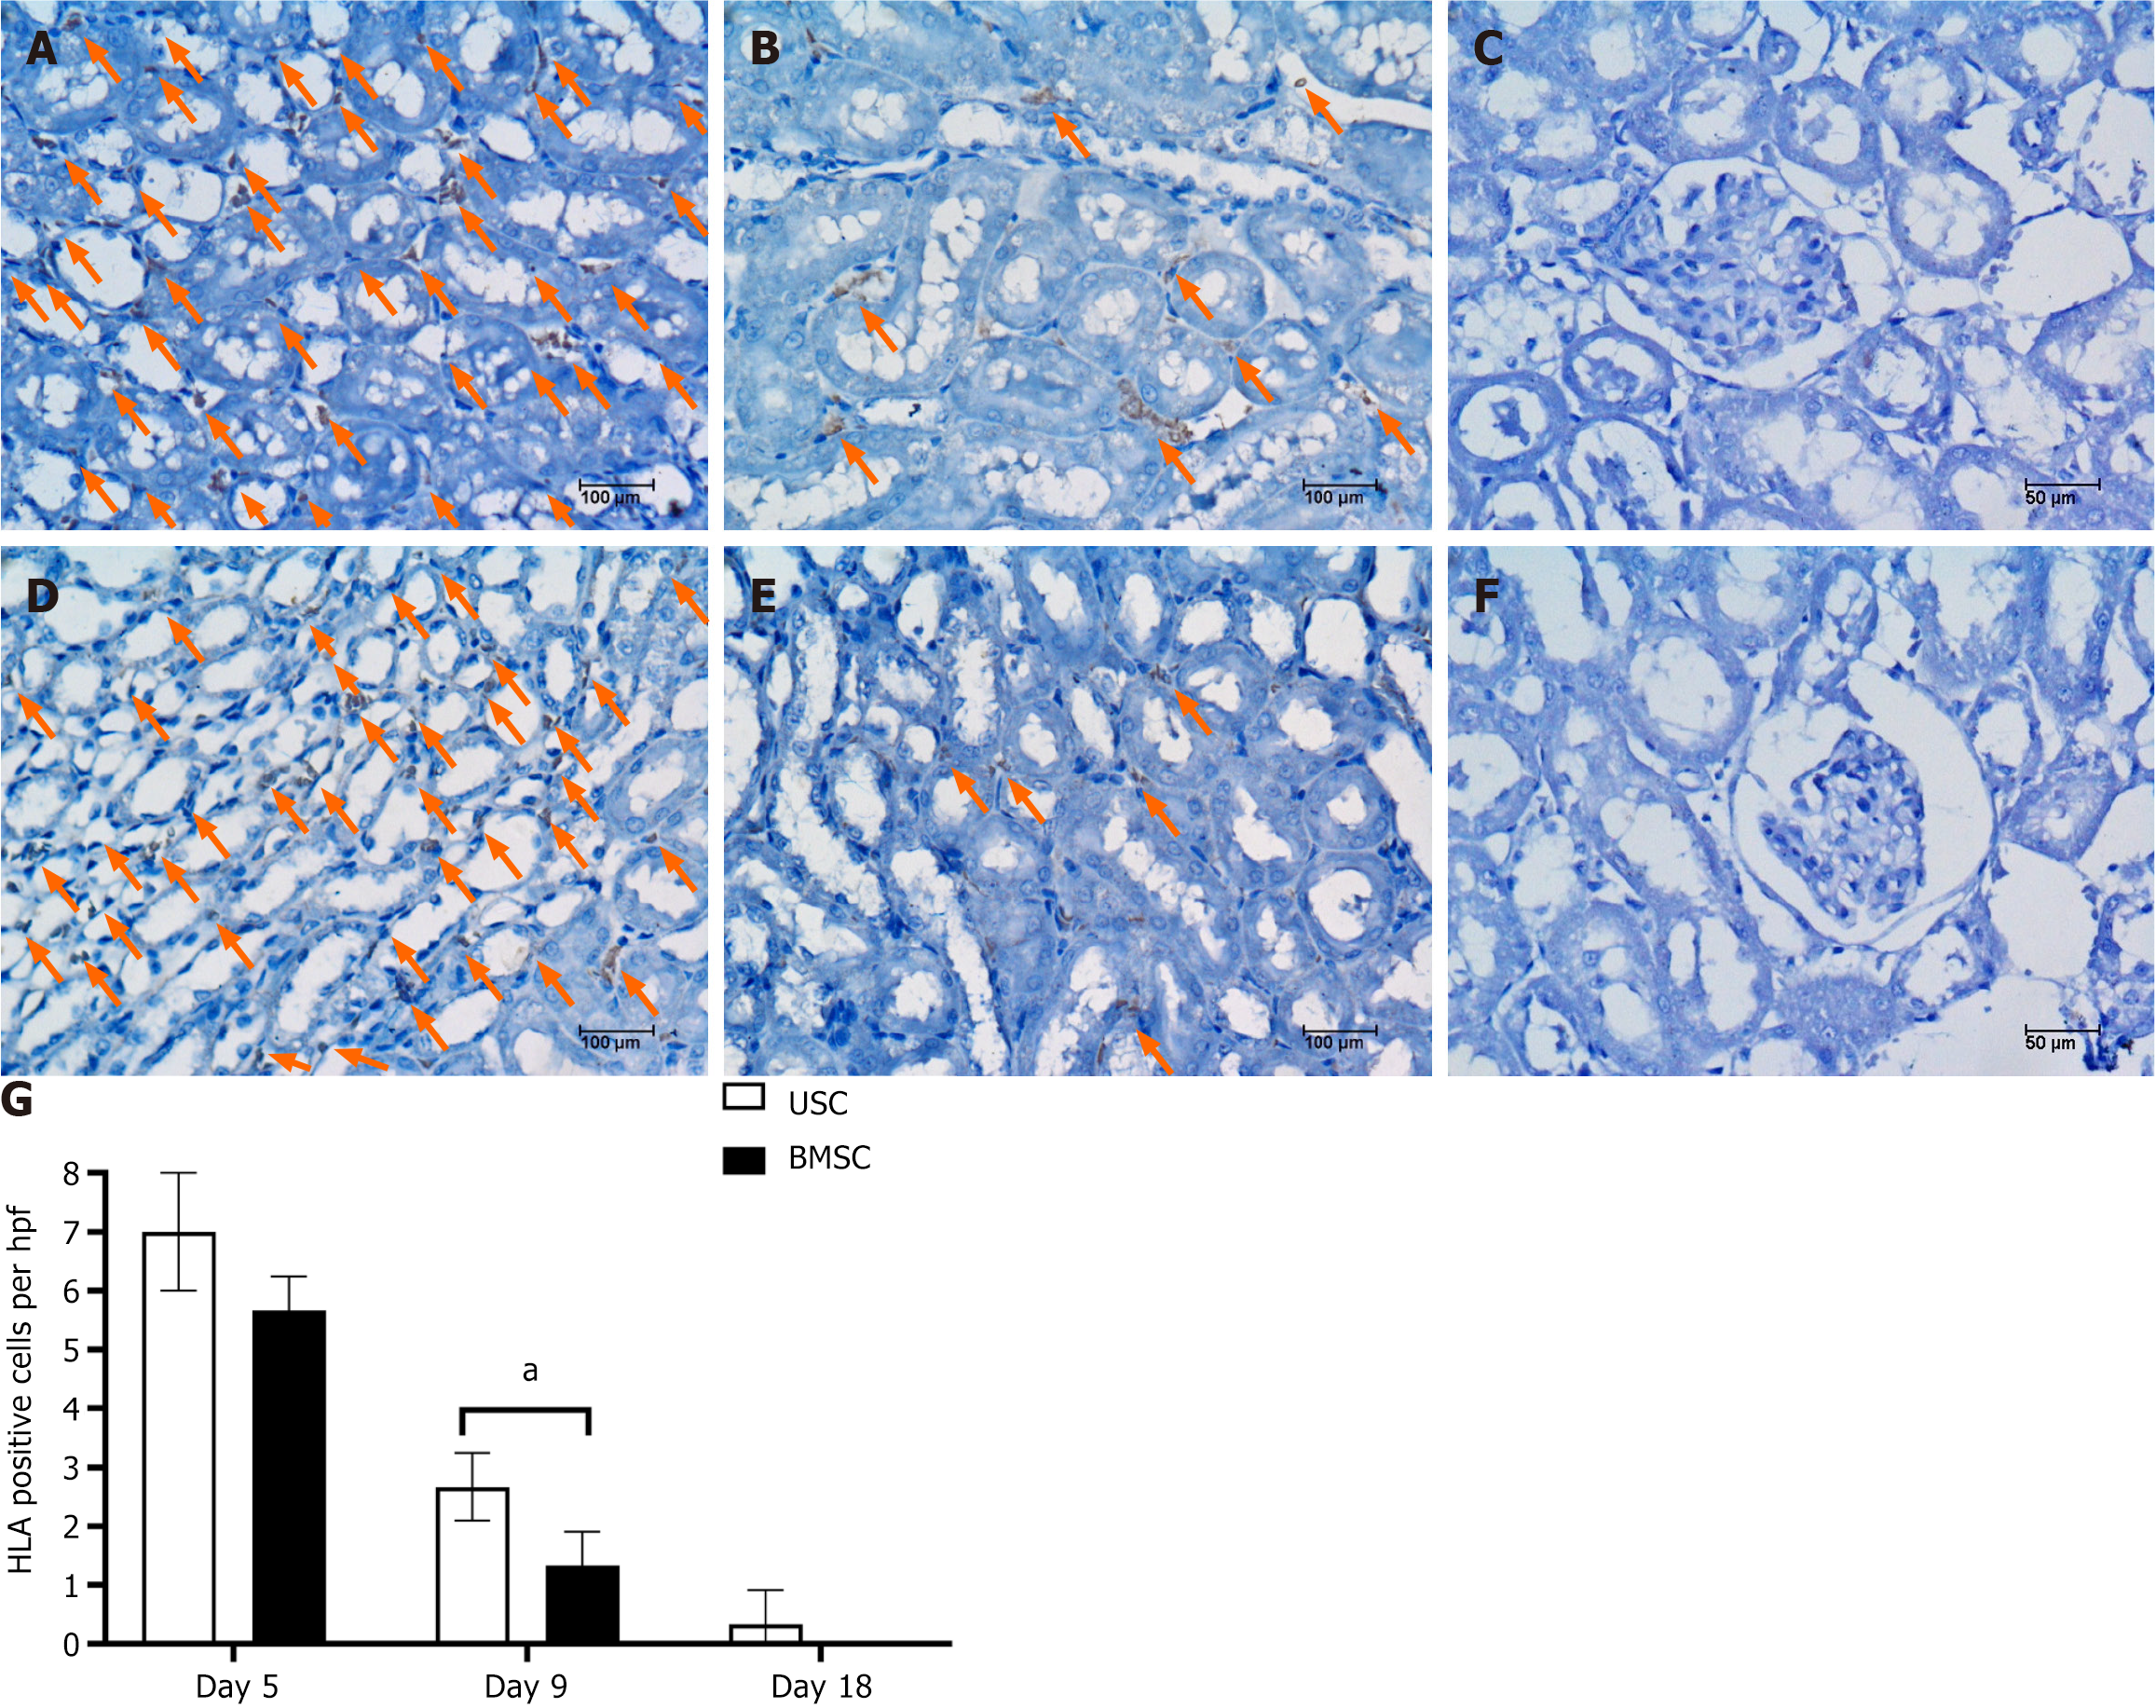
Figure 7 Detection of urine-derived stem cells or bone marrow mesenchymal stem cells within the kidneys of acute kidney injury mice by human leucocyte antigen immunostaining.
A-C: Representative micrographs showing human leucocyte antigen (HLA)-positive cells in kidney tissue from acute kidney injury (AKI) mice injected with urine-derived stem cells at days 5, 9 and 18; D-F: Representative micrographs showing HLA-positive cells in kidney tissue from AKI mice injected with bone marrow mesenchymal stem cells on days 5, 9 and 18; G: Graphs illustrating the quantification of HLA-positive cells. Student’s t test was performed between urine-derived stem cell-treated and bone marrow mesenchymal stem cell-treated AKI mice at each time point. aP < 0.01. USC: Urine-derived stem cell; BMSC: Bone marrow mesenchymal stem cell; HLA: Human leucocyte antigen.
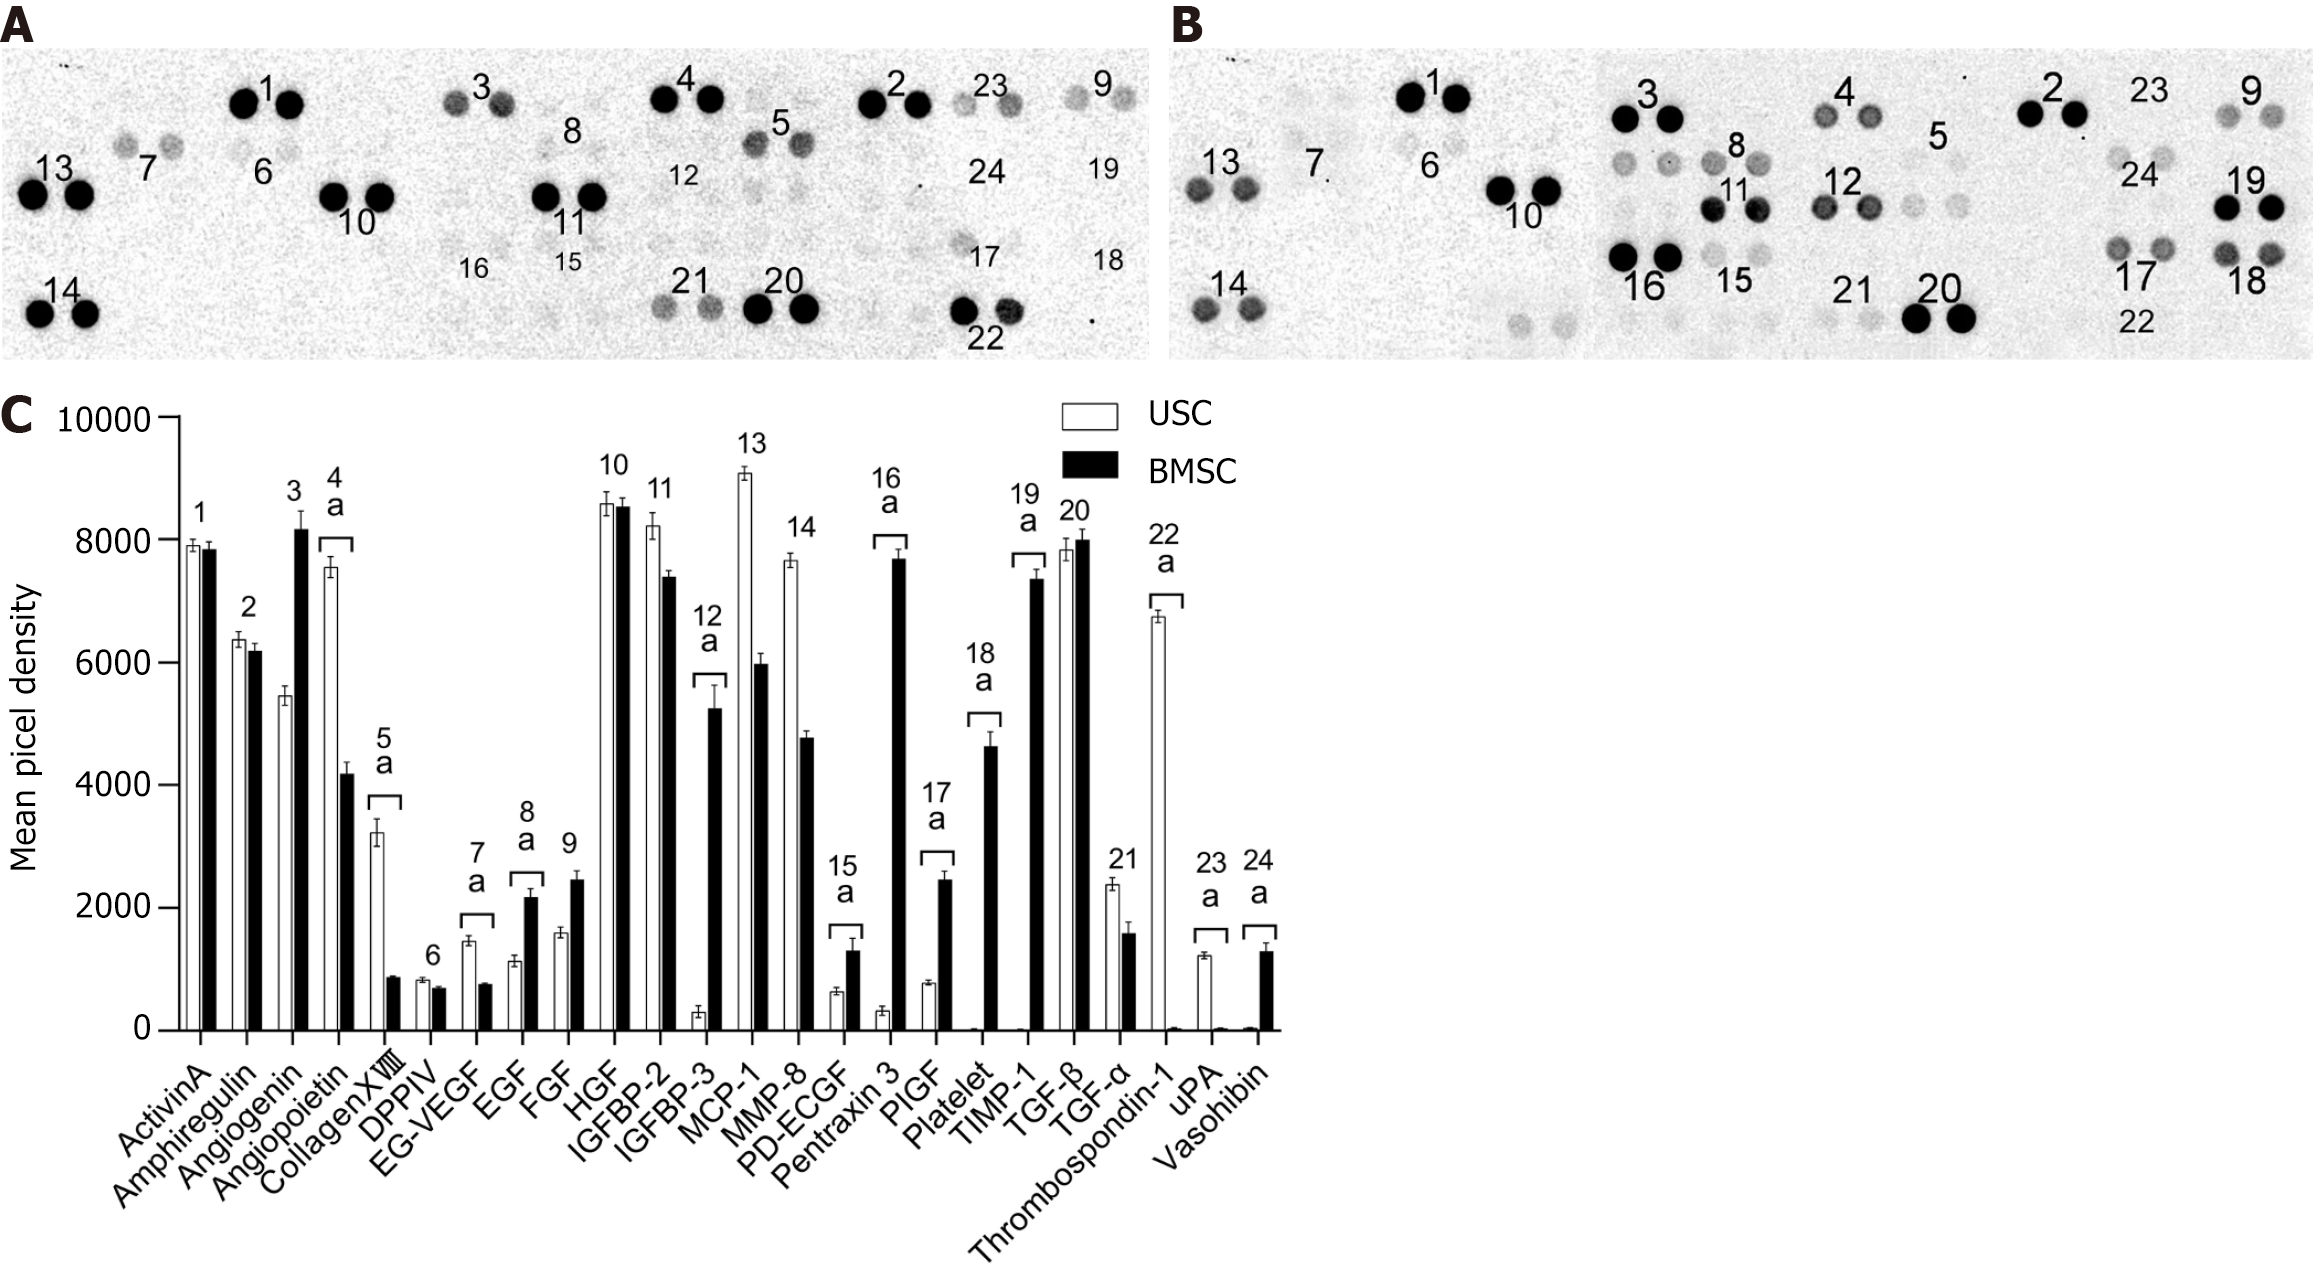
Figure 8 Angiogenesis-related protein growth factor secretion by urine-derived stem cells and bone marrow mesenchymal stem cells.
A: Results of angiogenesis growth factor secretion by urine-derived stem cells (USCs); B: Results of angiogenesis growth factor secretion by bone marrow mesenchymal stem cells (BMSCs); C: Statistical analysis of the levels of secretion by USCs and BMSCs by using Student’s t test: aP < 0. 05, urine-derived stem cell vs bone marrow mesenchymal stem cell. USC: Urine-derived stem cell; BMSC: Bone marrow mesenchymal stem cell; EG-VEGF: Endocrine gland-derived vascular endothelial growth factor; EGF: Epidermal growth factor; FGF: Fibroblast growth factor; HGF: Hepatocyte growth factor; IGFBP: Insulin-like growth factor binding protein; MCP: Monocyte chemoattractant protein; MMP: Matrix metalloproteinase; PD-ECGF: Platelet-derived endothelial cell growth factor; PIGF: Placental growth factor; TIMP: Tissue inhibitor of metalloproteinases; TGF: Transforming growth factor; uPA: Urokinase plasminogen activator.
- Citation: Li F, Zhao B, Zhang L, Chen GQ, Zhu L, Feng XL, Gong MJ, Hu CC, Zhang YY, Li M, Liu YQ. Therapeutic potential of urine-derived stem cells in renal regeneration following acute kidney injury: A comparative analysis with mesenchymal stem cells. World J Stem Cells 2024; 16(5): 525-537
- URL: https://www.wjgnet.com/1948-0210/full/v16/i5/525.htm
- DOI: https://dx.doi.org/10.4252/wjsc.v16.i5.525


