©The Author(s) 2024.
World J Stem Cells. Apr 26, 2024; 16(4): 410-433
Published online Apr 26, 2024. doi: 10.4252/wjsc.v16.i4.410
Published online Apr 26, 2024. doi: 10.4252/wjsc.v16.i4.410
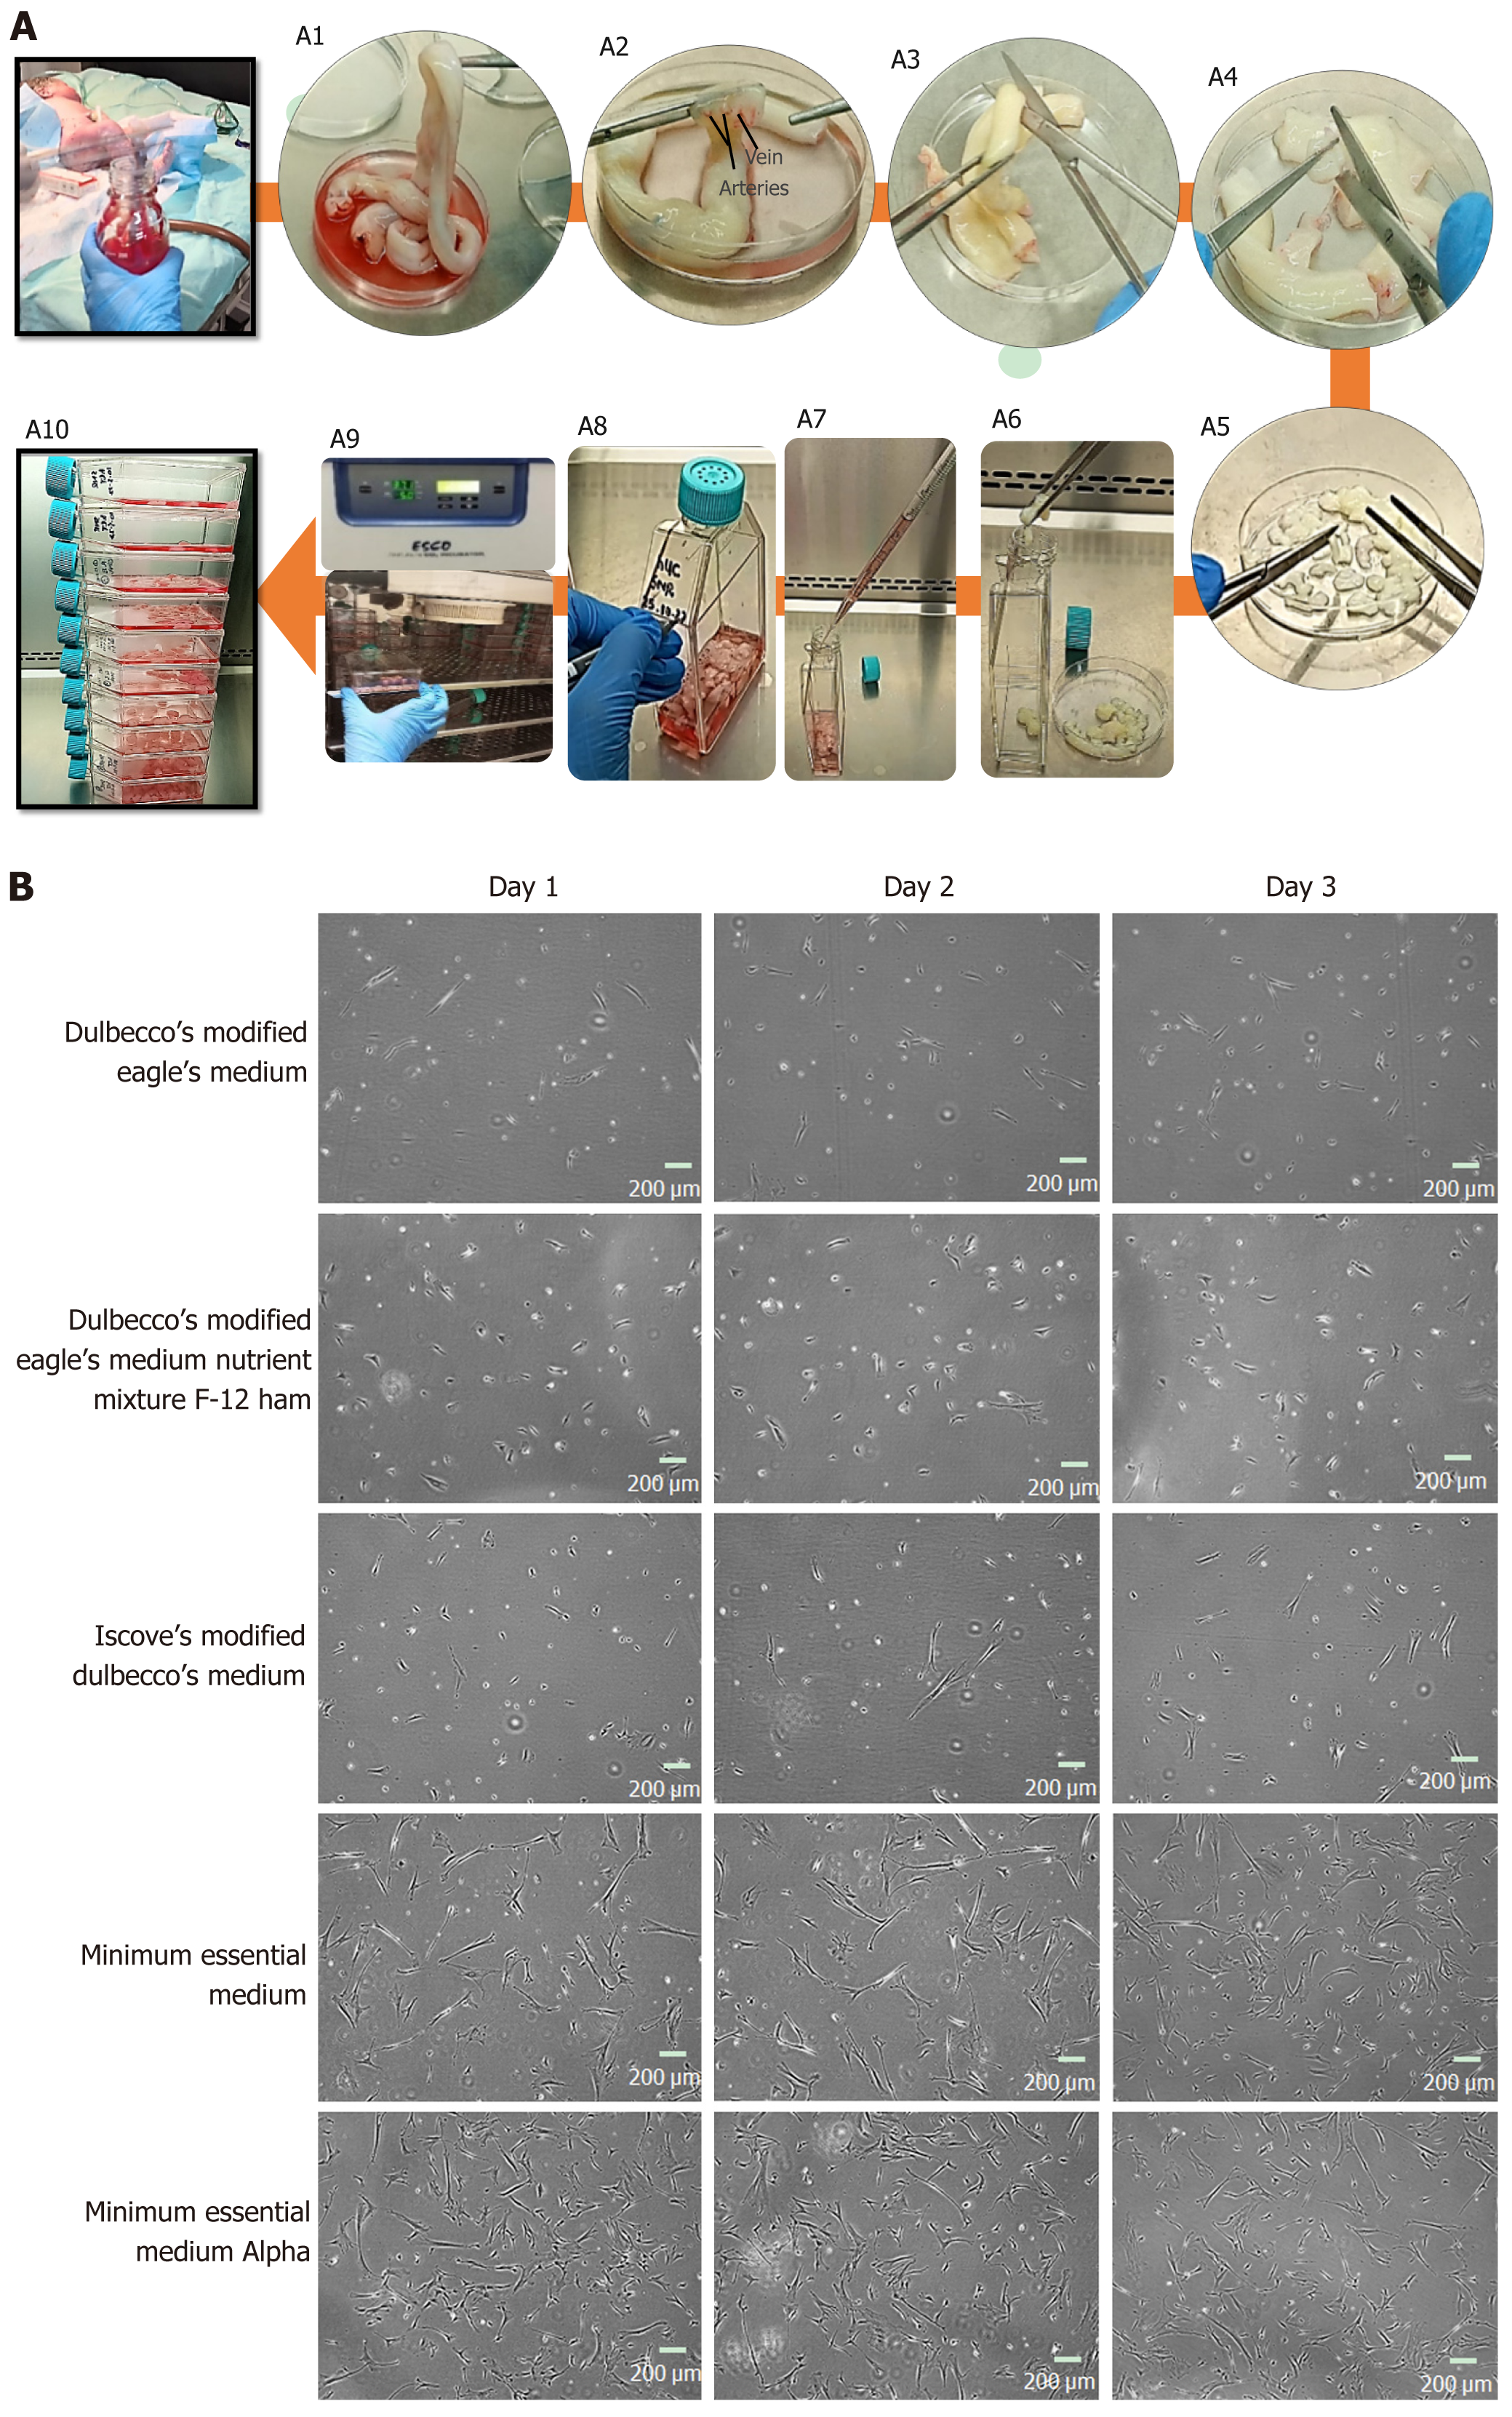
Figure 1 Human umbilical cord processing.
A: Representative images of human umbilical cord (hUC) collection, and culture. A1: The hUC manually collected and processed aseptically; A2: The collected cord samples were washed 5 to 6 times in 1× phosphate buffered saline, the embedded connective tissue of hUC consists of one vein and two arteries; A3: The cord samples were cut horizontally into roughly 5 cm sections; A4: An incision was made vertically to expose arteries and vein of hUC; A5: Cord sample were diced approximately into 3 mm × 3 mm pieces; A6: Cord pieces were transferred into T-75 flasks; A7: Complete minimal essential medium alpha (MEM α) was added 8-10 mL; A8: Flask was marked with respective hUC donor number; A9: The flasks were incubated undisturbed for up to 7 d at 37 °C supplied with 5% CO2; A10: Fresh medium was supplied without disturbing attached explant; B: Representative images of mesenchymal stem cells (MSCs) cultured in different mediums; sub-culture MSCs on different cultural mediums for 3 d, morphologically observed showed rapid adherent growth, and proliferation in MEM α.
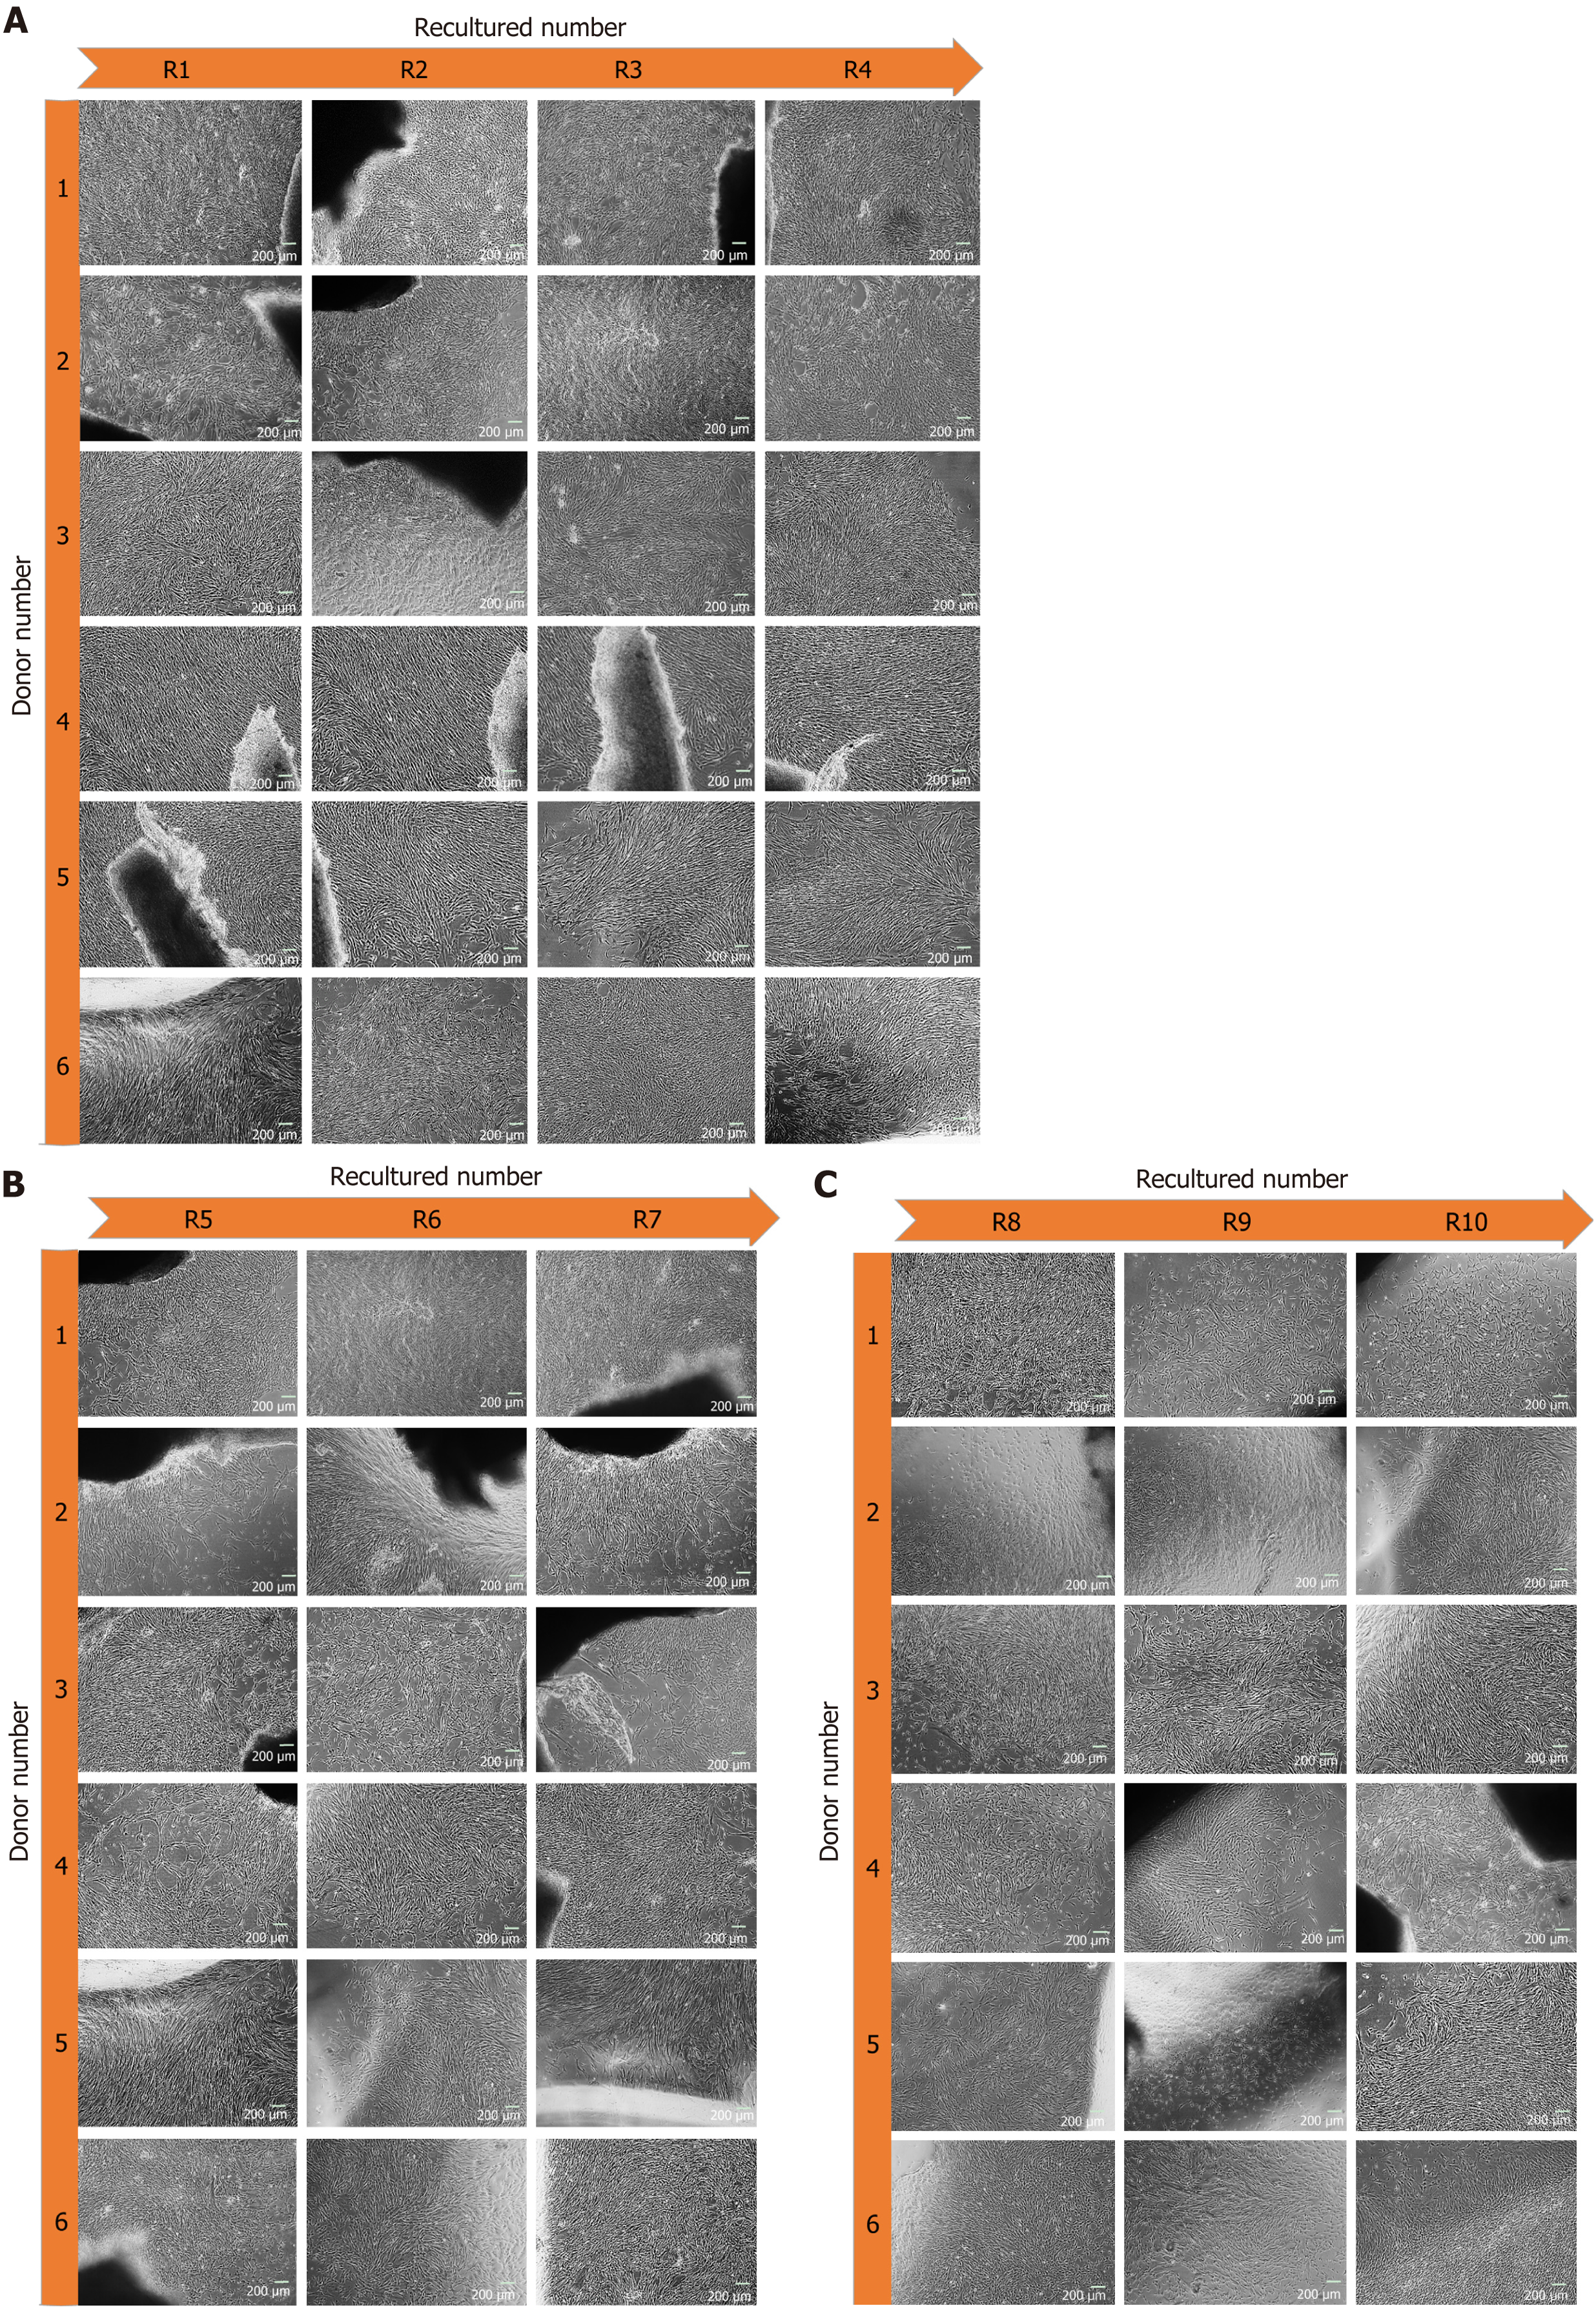
Figure 2 Morphology of human umbilical cord-mesenchymal stem cell at recultured 1-10 from respective donors.
A: Homogeneous population of human umbilical cord (hUC)-mesenchymal stem cells (MSCs) at recultured (R) number 1, 2, 3 and 4 migrating from explant at day 19, 9, 8 and 7 respectively; B: Expanded homogeneous population of hUC-MSCs at recultured (R) numbers 5, 6, and 7 at day 8, 7 and 9 respectively; C: Scaled population of hUC-MSCs migrated successively from hUC recultured (R) numbers 8, 9, and 10 at 4, 5 and 8 d respectively. Microphotographs were captured at 80%-90% confluency.
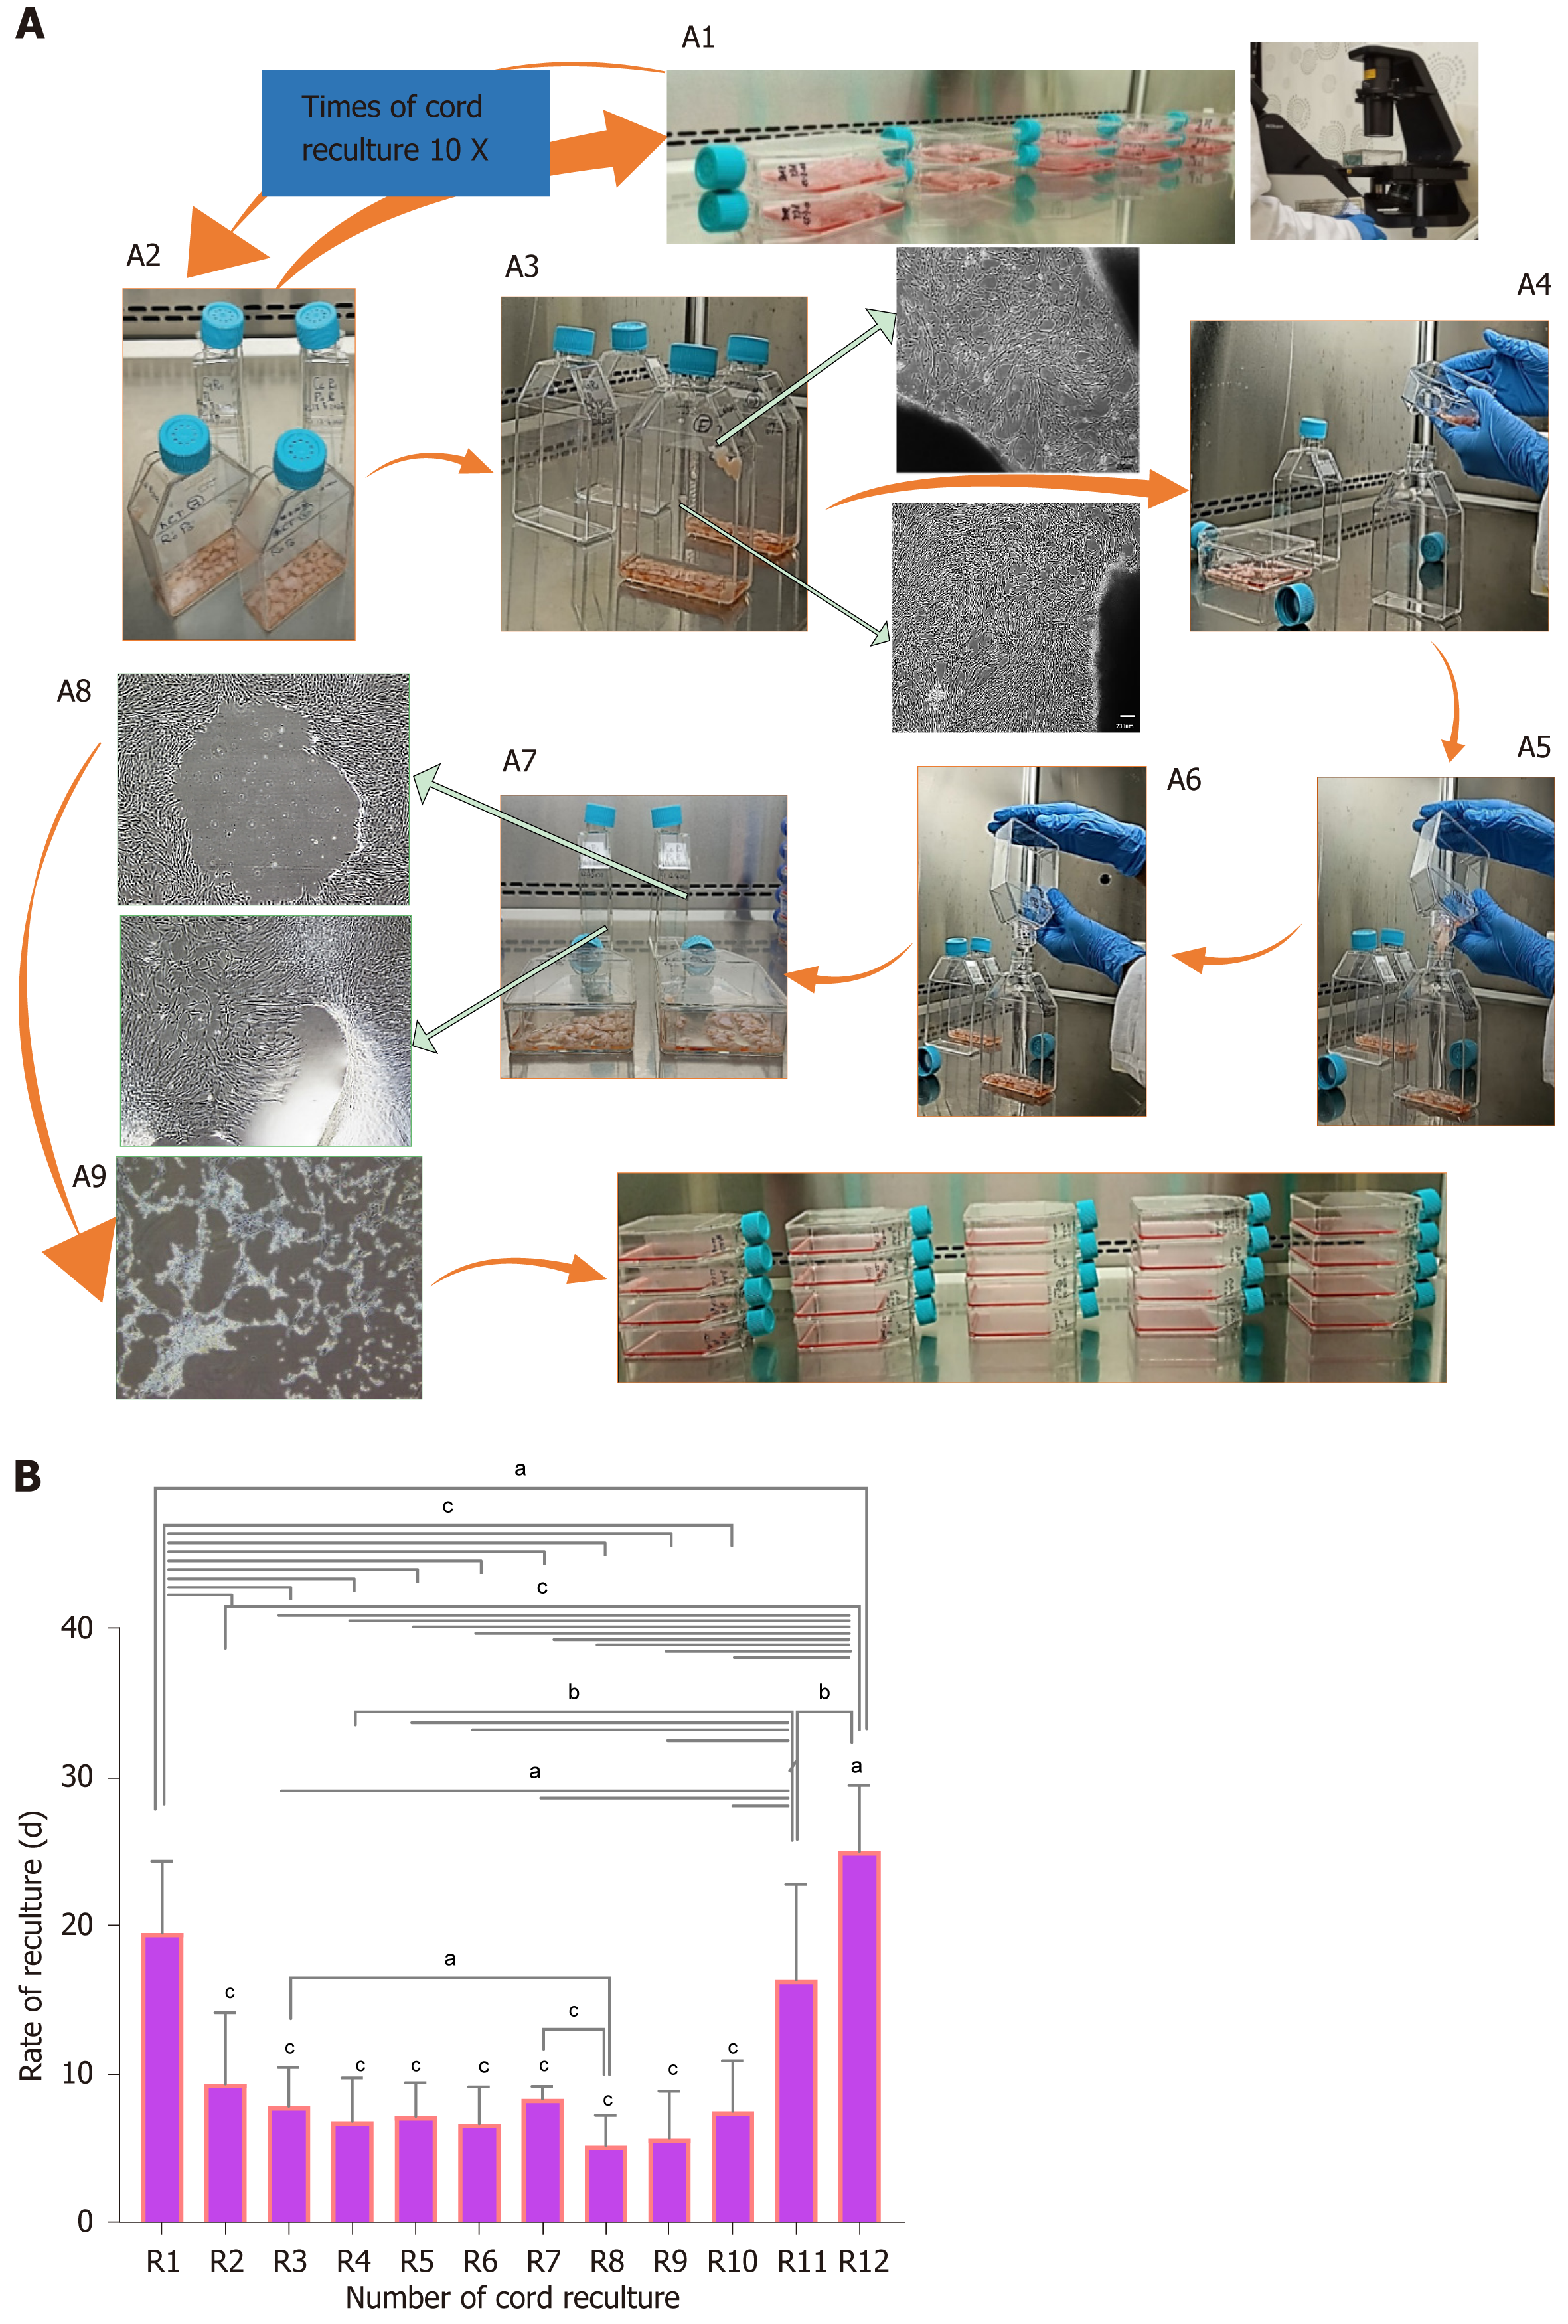
Figure 3 Effect of reculturing human umbilical cord for mesenchymal stem cell expansion and reculturing rate.
A: Novel design of recultured human umbilical cord (hUC)-mesenchymal stem cells scaling method; A1: Microscopic observation of explant containing flask at respective recultured days mentioned in Figure 2; A2: Selection of flasks that occupied maximal 80%-90 % confluent colonies of mesenchymal stem cells (MSCs) releasing from the explant; A3: Microscopic observation of explant releasing MSCs; A4: Maintaining sterile culture conditions marking new flasks as subsequent recultured number and gently tap the explant-containing flask to propel all surface sticky cord pieces towards the canted neck of the flask; A5: Inclined explant containing MSC confluent flask at an angular position of 45-90 degree over the new flask with marked successive recultured number aseptically; A6: Transfer all the explant pieces into the new flask; A7 and A8: Microscopic representation of confluent hUC-MSCs after removing the explant; A9: Sub-culturing of explant removed adherent MSCs showing cellular detachment by trypsinization; A10: Scaled MSCs for experimentation; B: The graphical representation of recultured hUC-MSC: The two-way ANOVA with multiple comparisons of recultured hUC between R1-R12 times. The recultured numbers 1-10 showed a significant decrease in time to recultured hUC, hence increased MSC expansion. At R11 and R12 a significant increase in time was observed to get MSCs. aP < 0.05, bP < 0.01, and cP < 0.001.
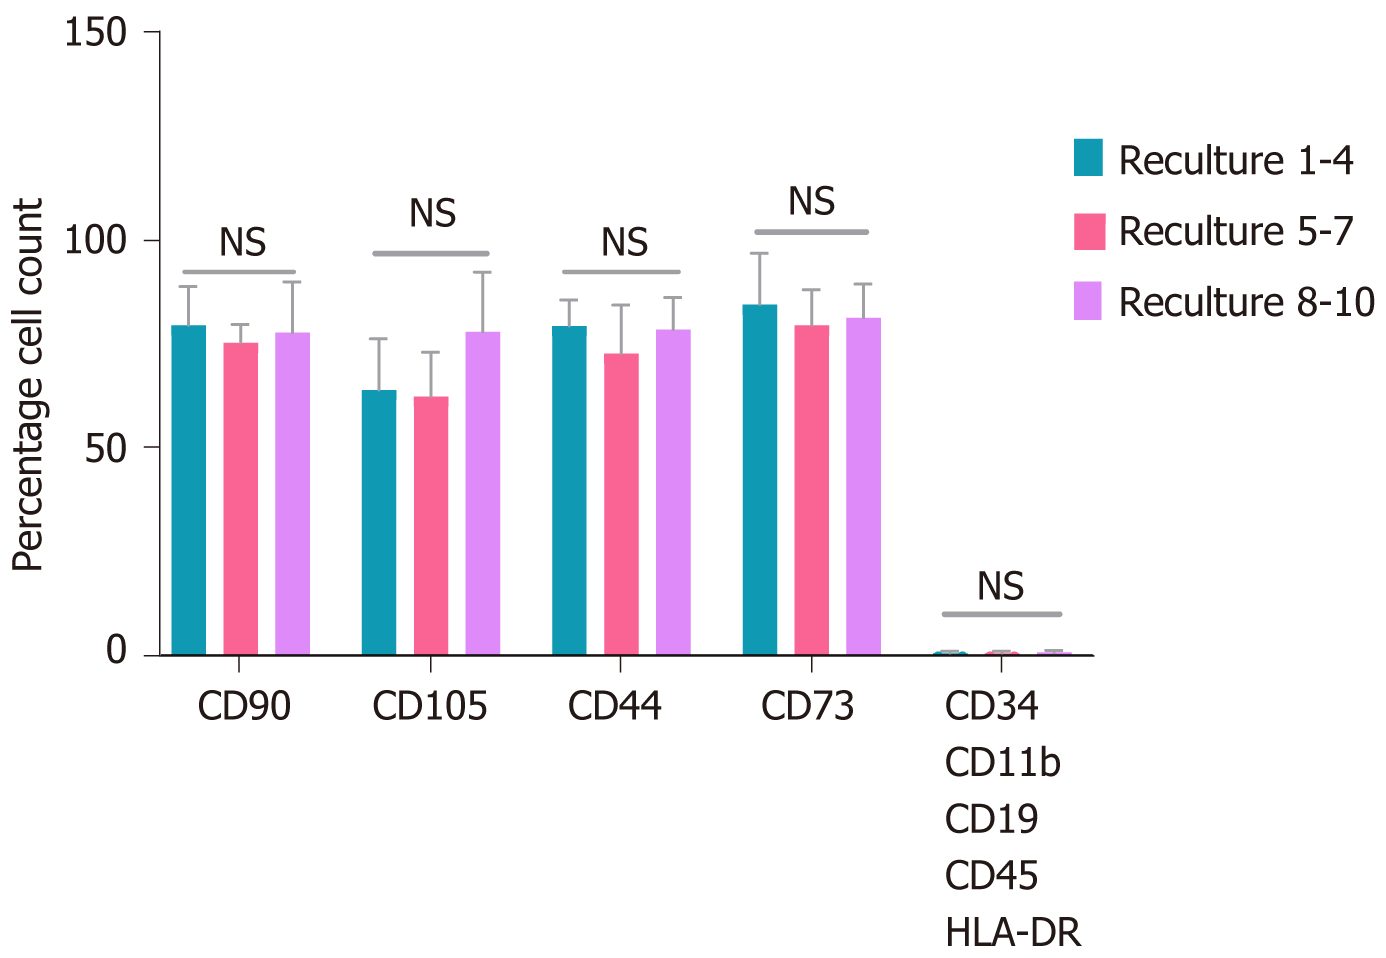
Figure 4 Flowcytometry for quantified immunophenotypic expressions of recultured human umbilical cord-mesenchymal stem cells.
Statistical analysis represented no variations in the expression of mesenchymal stem cell (MSC) positive and negative markers at each recultured human umbilical cord-MSCs at passage 6. The data showed from three independent experiments ± SD. NS: No significance.
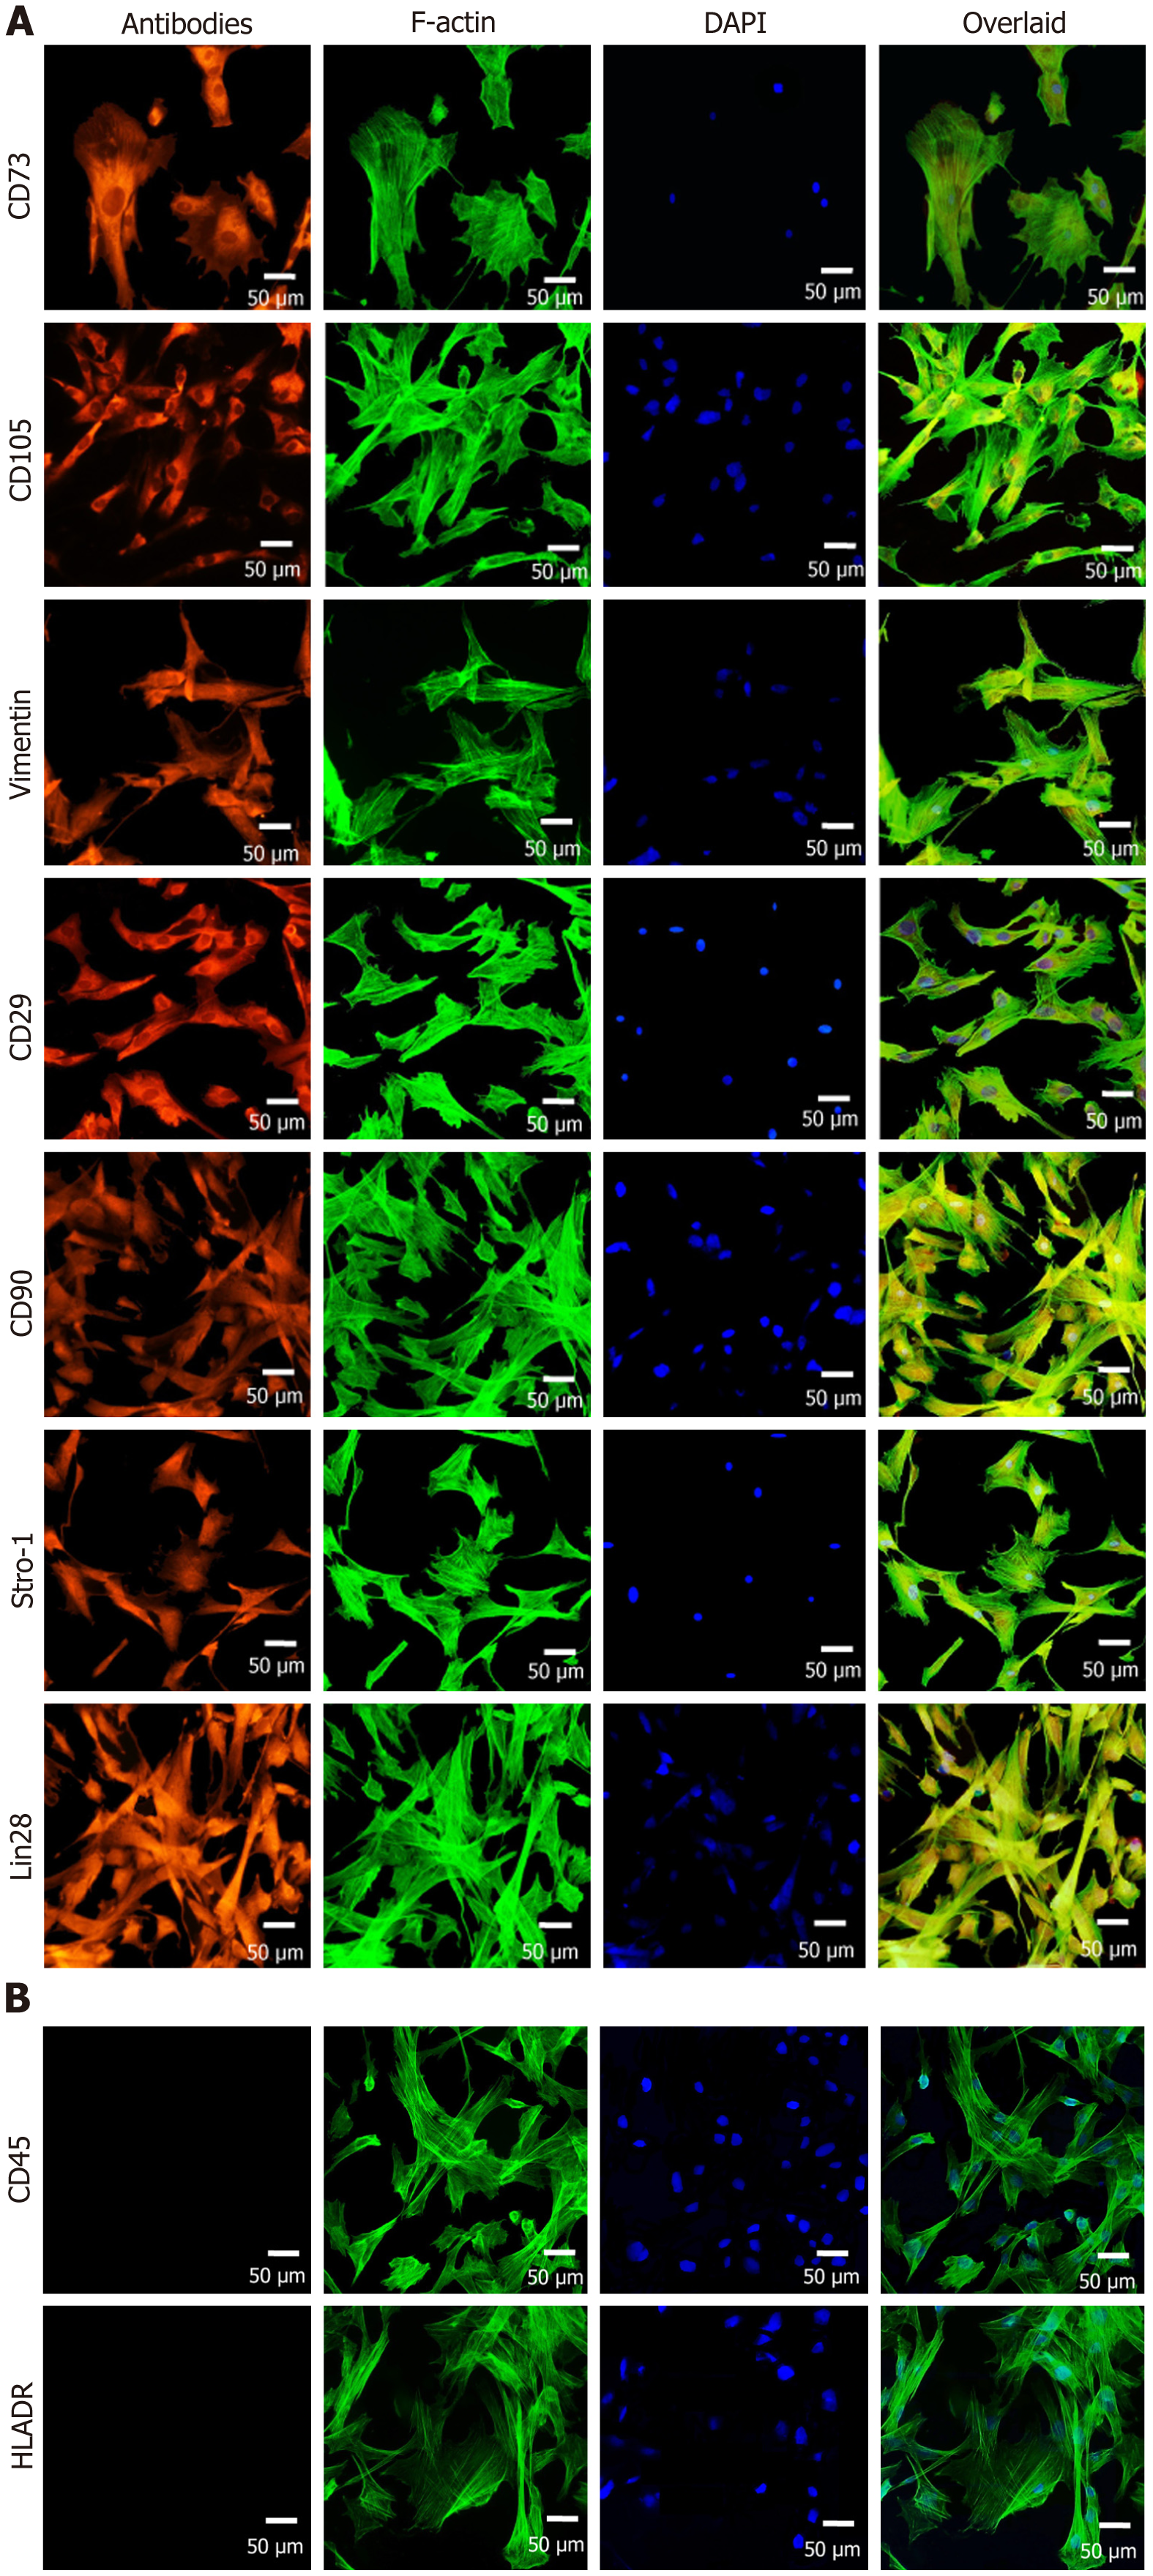
Figure 5 Immuno-cytochemical profiling of recultured human umbilical cord-mesenchymal stem cells.
A: The recultured human umbilical cord (hUC)-mesenchymal stem cells (MSCs) were positive for CD73, CD105, vimentin, CD29, CD90, Stro-1, and Lin28. The cells were stained with specific antibodies against MSCs markers. Nuclei were stained with DAPI. The cells were visualized for F-actin by staining with phalloidin labeled with Alexa Flour 488; B: The hUC-MSCs were negative for CD45 and HLA-DR MSCs negative markers by immunocytochemical staining.
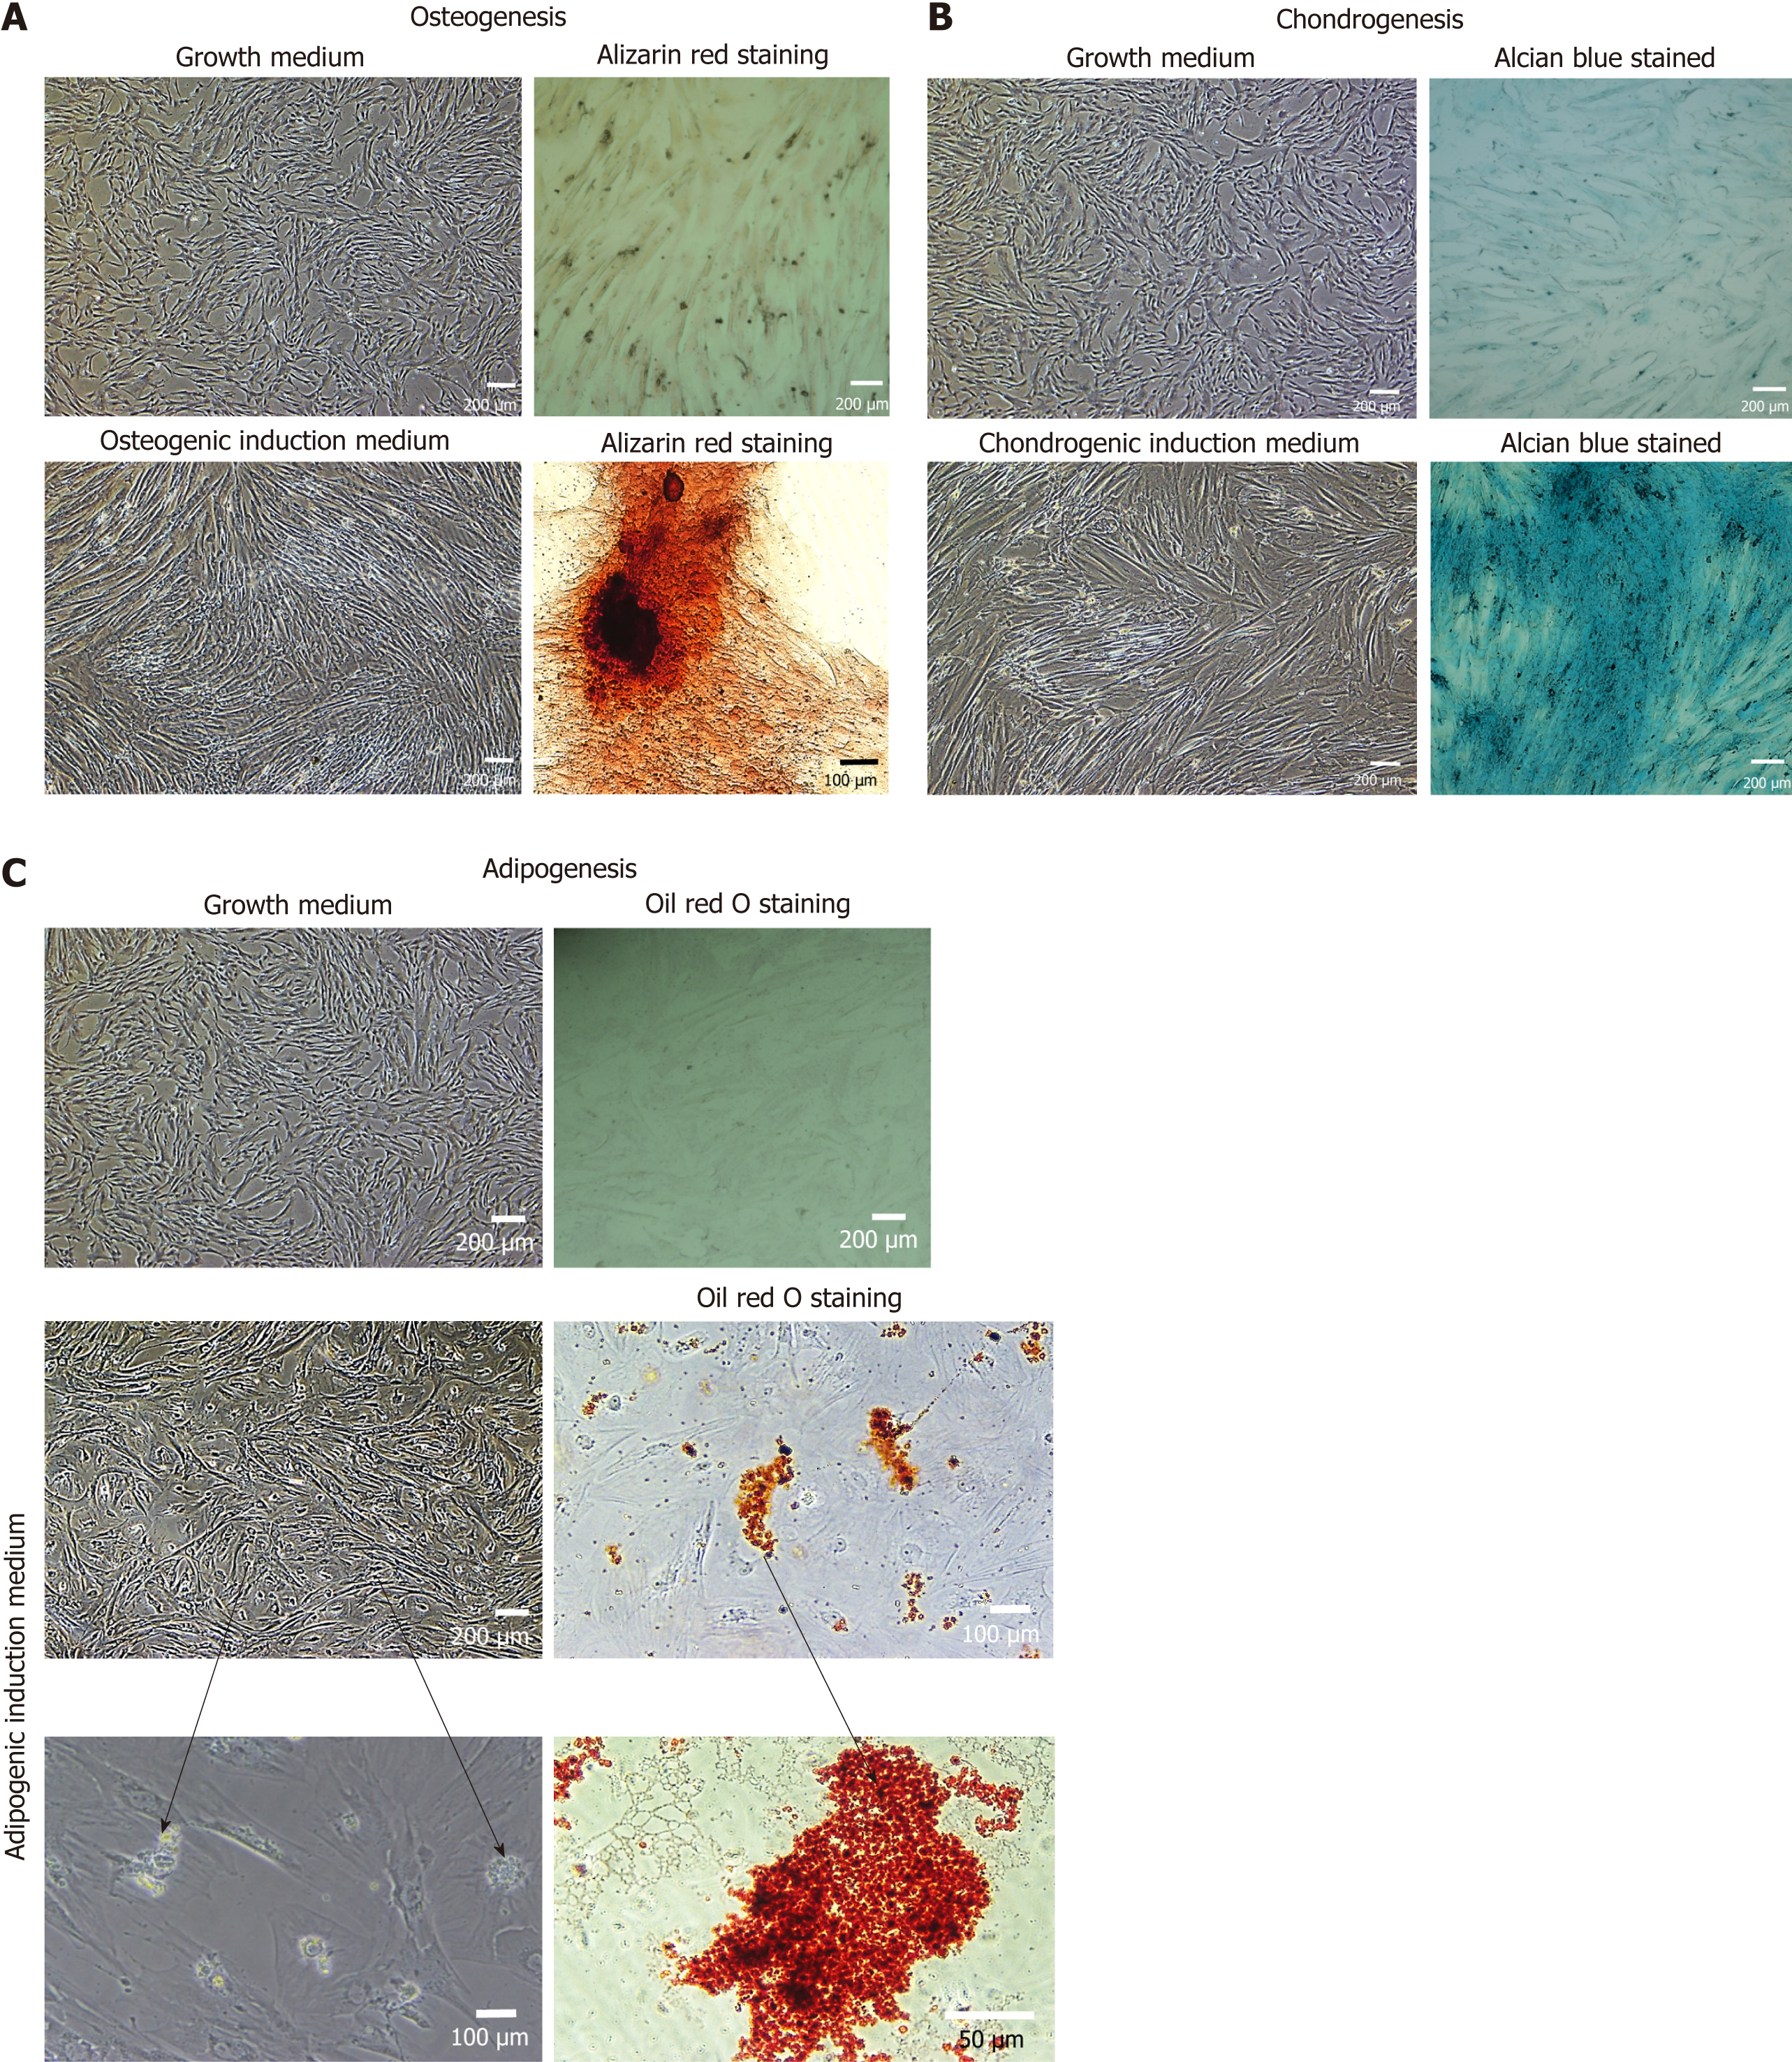
Figure 6 Trilineage differentiation of mesenchymal stem cells.
A: The differentiation of recultured human umbilical cord-mesenchymal stem cells (hUC-MSCs) towards osteocytes, the stained cells showed the presence of calcium and minerals deposits by Alizarin red staining as compared to the control cells; B: The chondrogenic differentiation of recultured hUC-MSCs, was confirmed by Alcian blue stained cells showed showing the presence of glycosaminoglycan and proteoglycan in comparison to the control cells; C: The hUC-MSCs differentiated into adipocytes were confirmed by staining the cells with Oil red O, the accumulated lipid droplets indicated the differentiation of recultured hUC-MSCs towards adipogenic lineage, compared to the control cells.
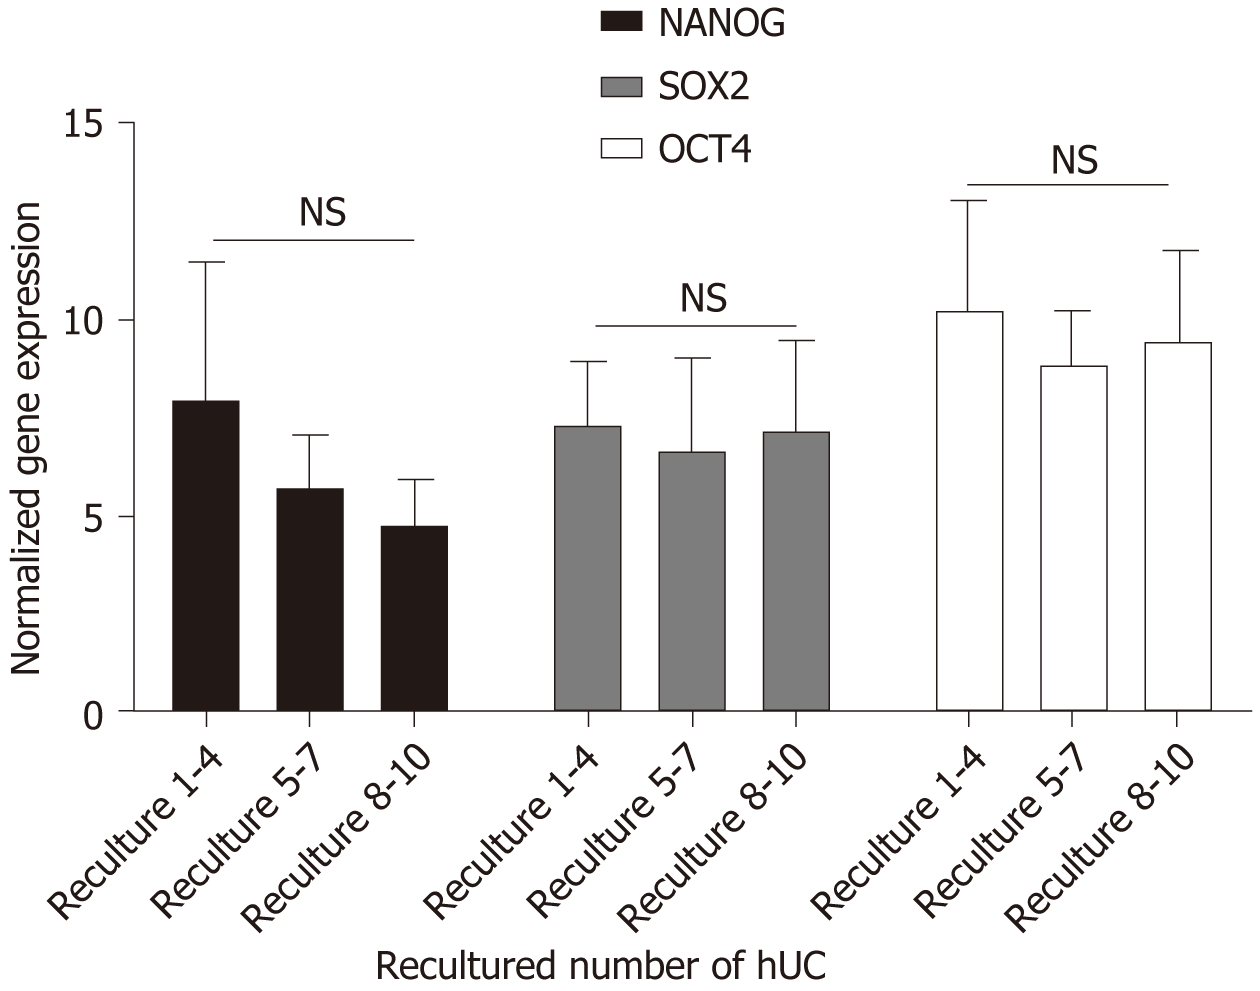
Figure 7 Pluripotency gene expression of recultured human umbilical cord-mesenchymal stem cells.
The recultured human umbilical cord-mesenchymal stem cells (hUC-MSCs) results showed that all the hUC recultured MSCs express the mesenchymal pluripotency markers octamer-binding transcription factor, sex-determining region Y-box 2, and Nanog. Statistical analysis showed non-significant changes in the expression levels of these markers. The data is collected from three independent experiments ± SD. NS: No significance; Sox-2: Sex-determining region Y-box 2; Oct-4: Octamer-binding transcription factor.
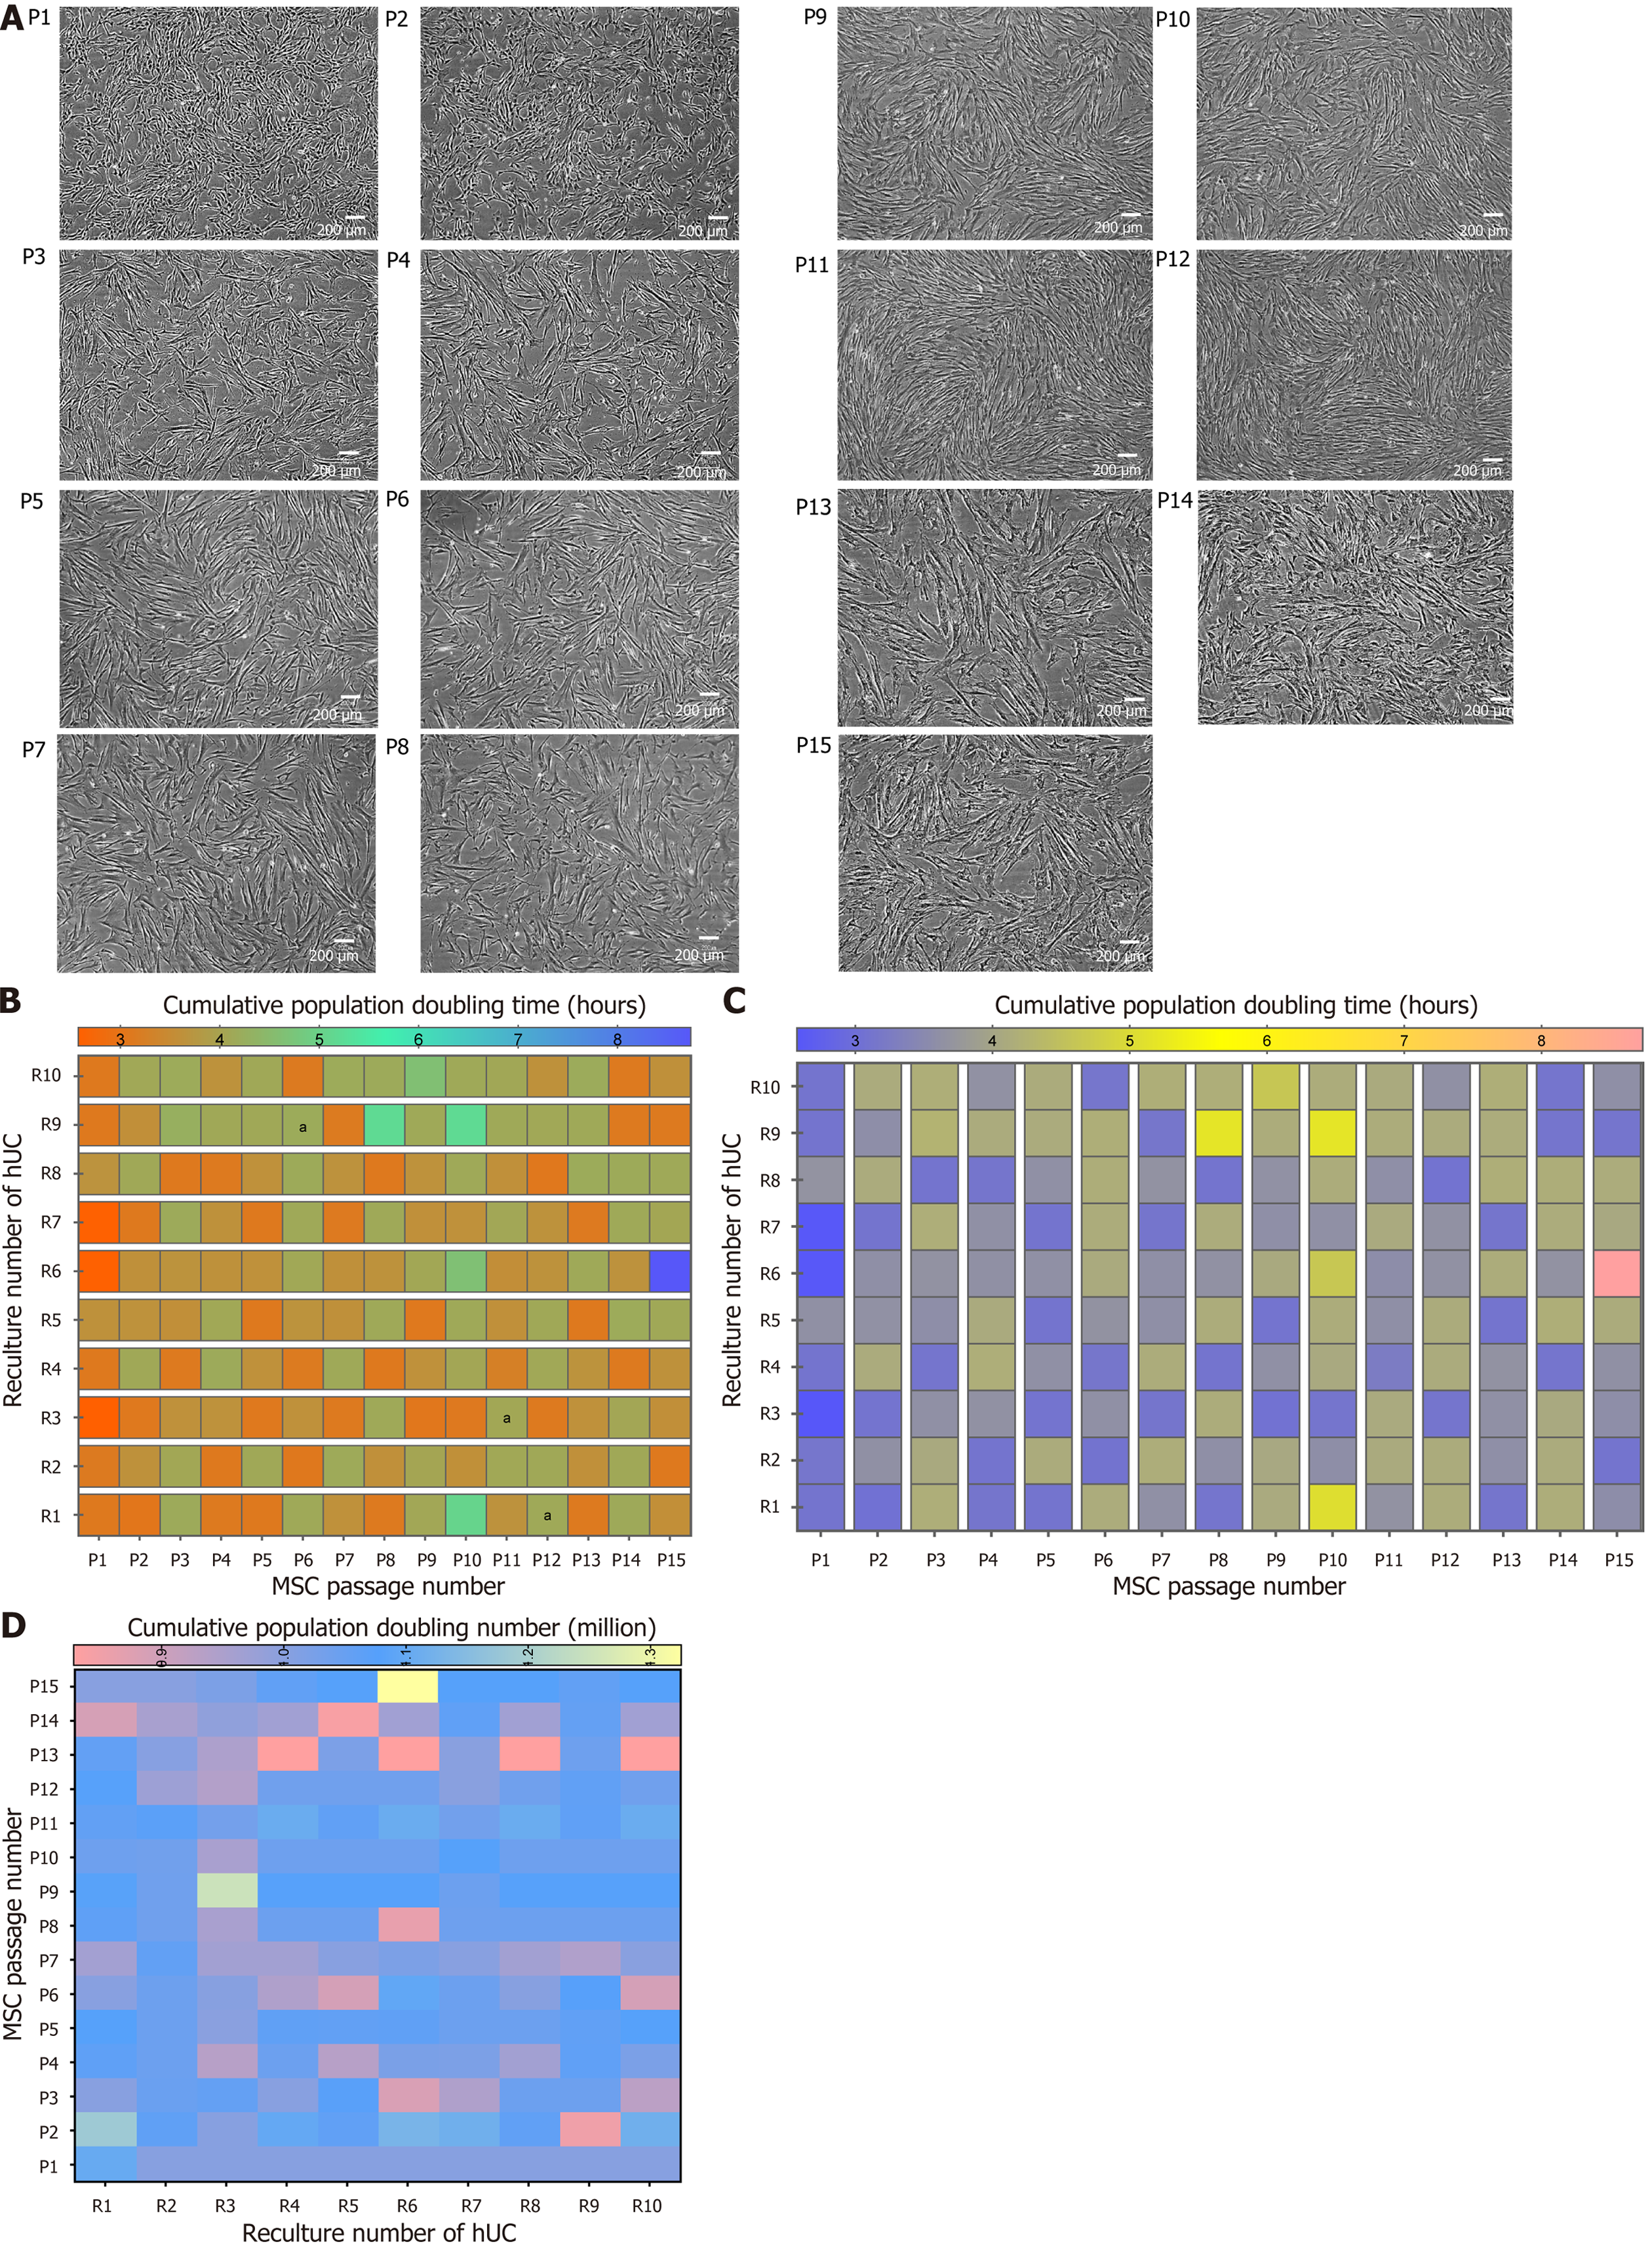
Figure 8 Passaging and population doubling analysis of recultured human umbilical cord-mesenchymal stem cells.
A: Microscopic morphology of recultured human umbilical cord-mesenchymal stem cells (hUC-MSCs) at passage 1-15: The hUC-MSCs cultured in minimal essential medium alpha at a seeding density of 1000 cells/cm2. The representative images were captured at 80%-90% confluency. Experiments were performed in duplicates; B: The comparative effect of population doubling time with passage at every reculture number of hUC-MSC. The data of six independent experiments shows mean ± SD with significant P-values. aP < 0.05; C: The comparative population doubling time on recultured hUC number on respective passage number. The heat map for multiple comparisons between recultured hUC for each MSC passage number showed no significant effect on population doubling time; D: The effect of recultured hUC and MSCs passaging on population doubling number. hUC: Human umbilical cord; MSC: Mesenchymal stem cell.
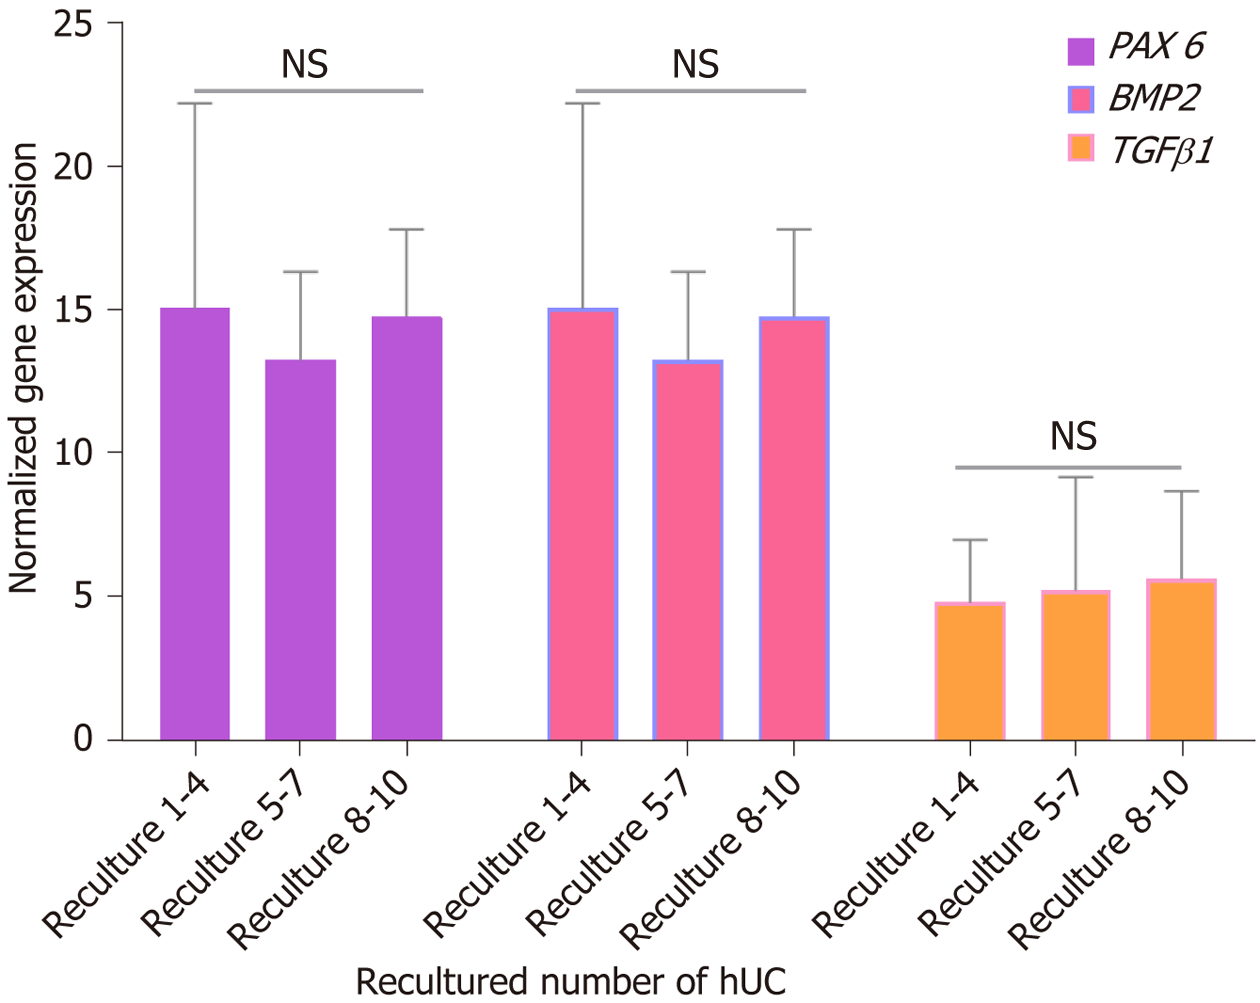
Figure 9 The proliferation gene expression analysis of recultured human umbilical cord-mesenchymal stem cells.
The three different ranges of recultured human umbilical cord derived mesenchymal stem cells (MSCs) were analyzed to evaluate gene expression of proliferation markers of MSCs. The normalized mRNA expression of paired-box 6, bone morphogenetic protein 2, and transforming growth factor β1 showed no significant difference at recultured 1-4, 5-7, and 8-10. GAPDH was used as a housekeeping gene to normalize the gene expression. NS: No significance. BMP2: Bone morphogenetic proteins; PAX6: Paired-box 6; TGFβ1: Transforming growth factor beta1; hUC: Human umbilical cord.
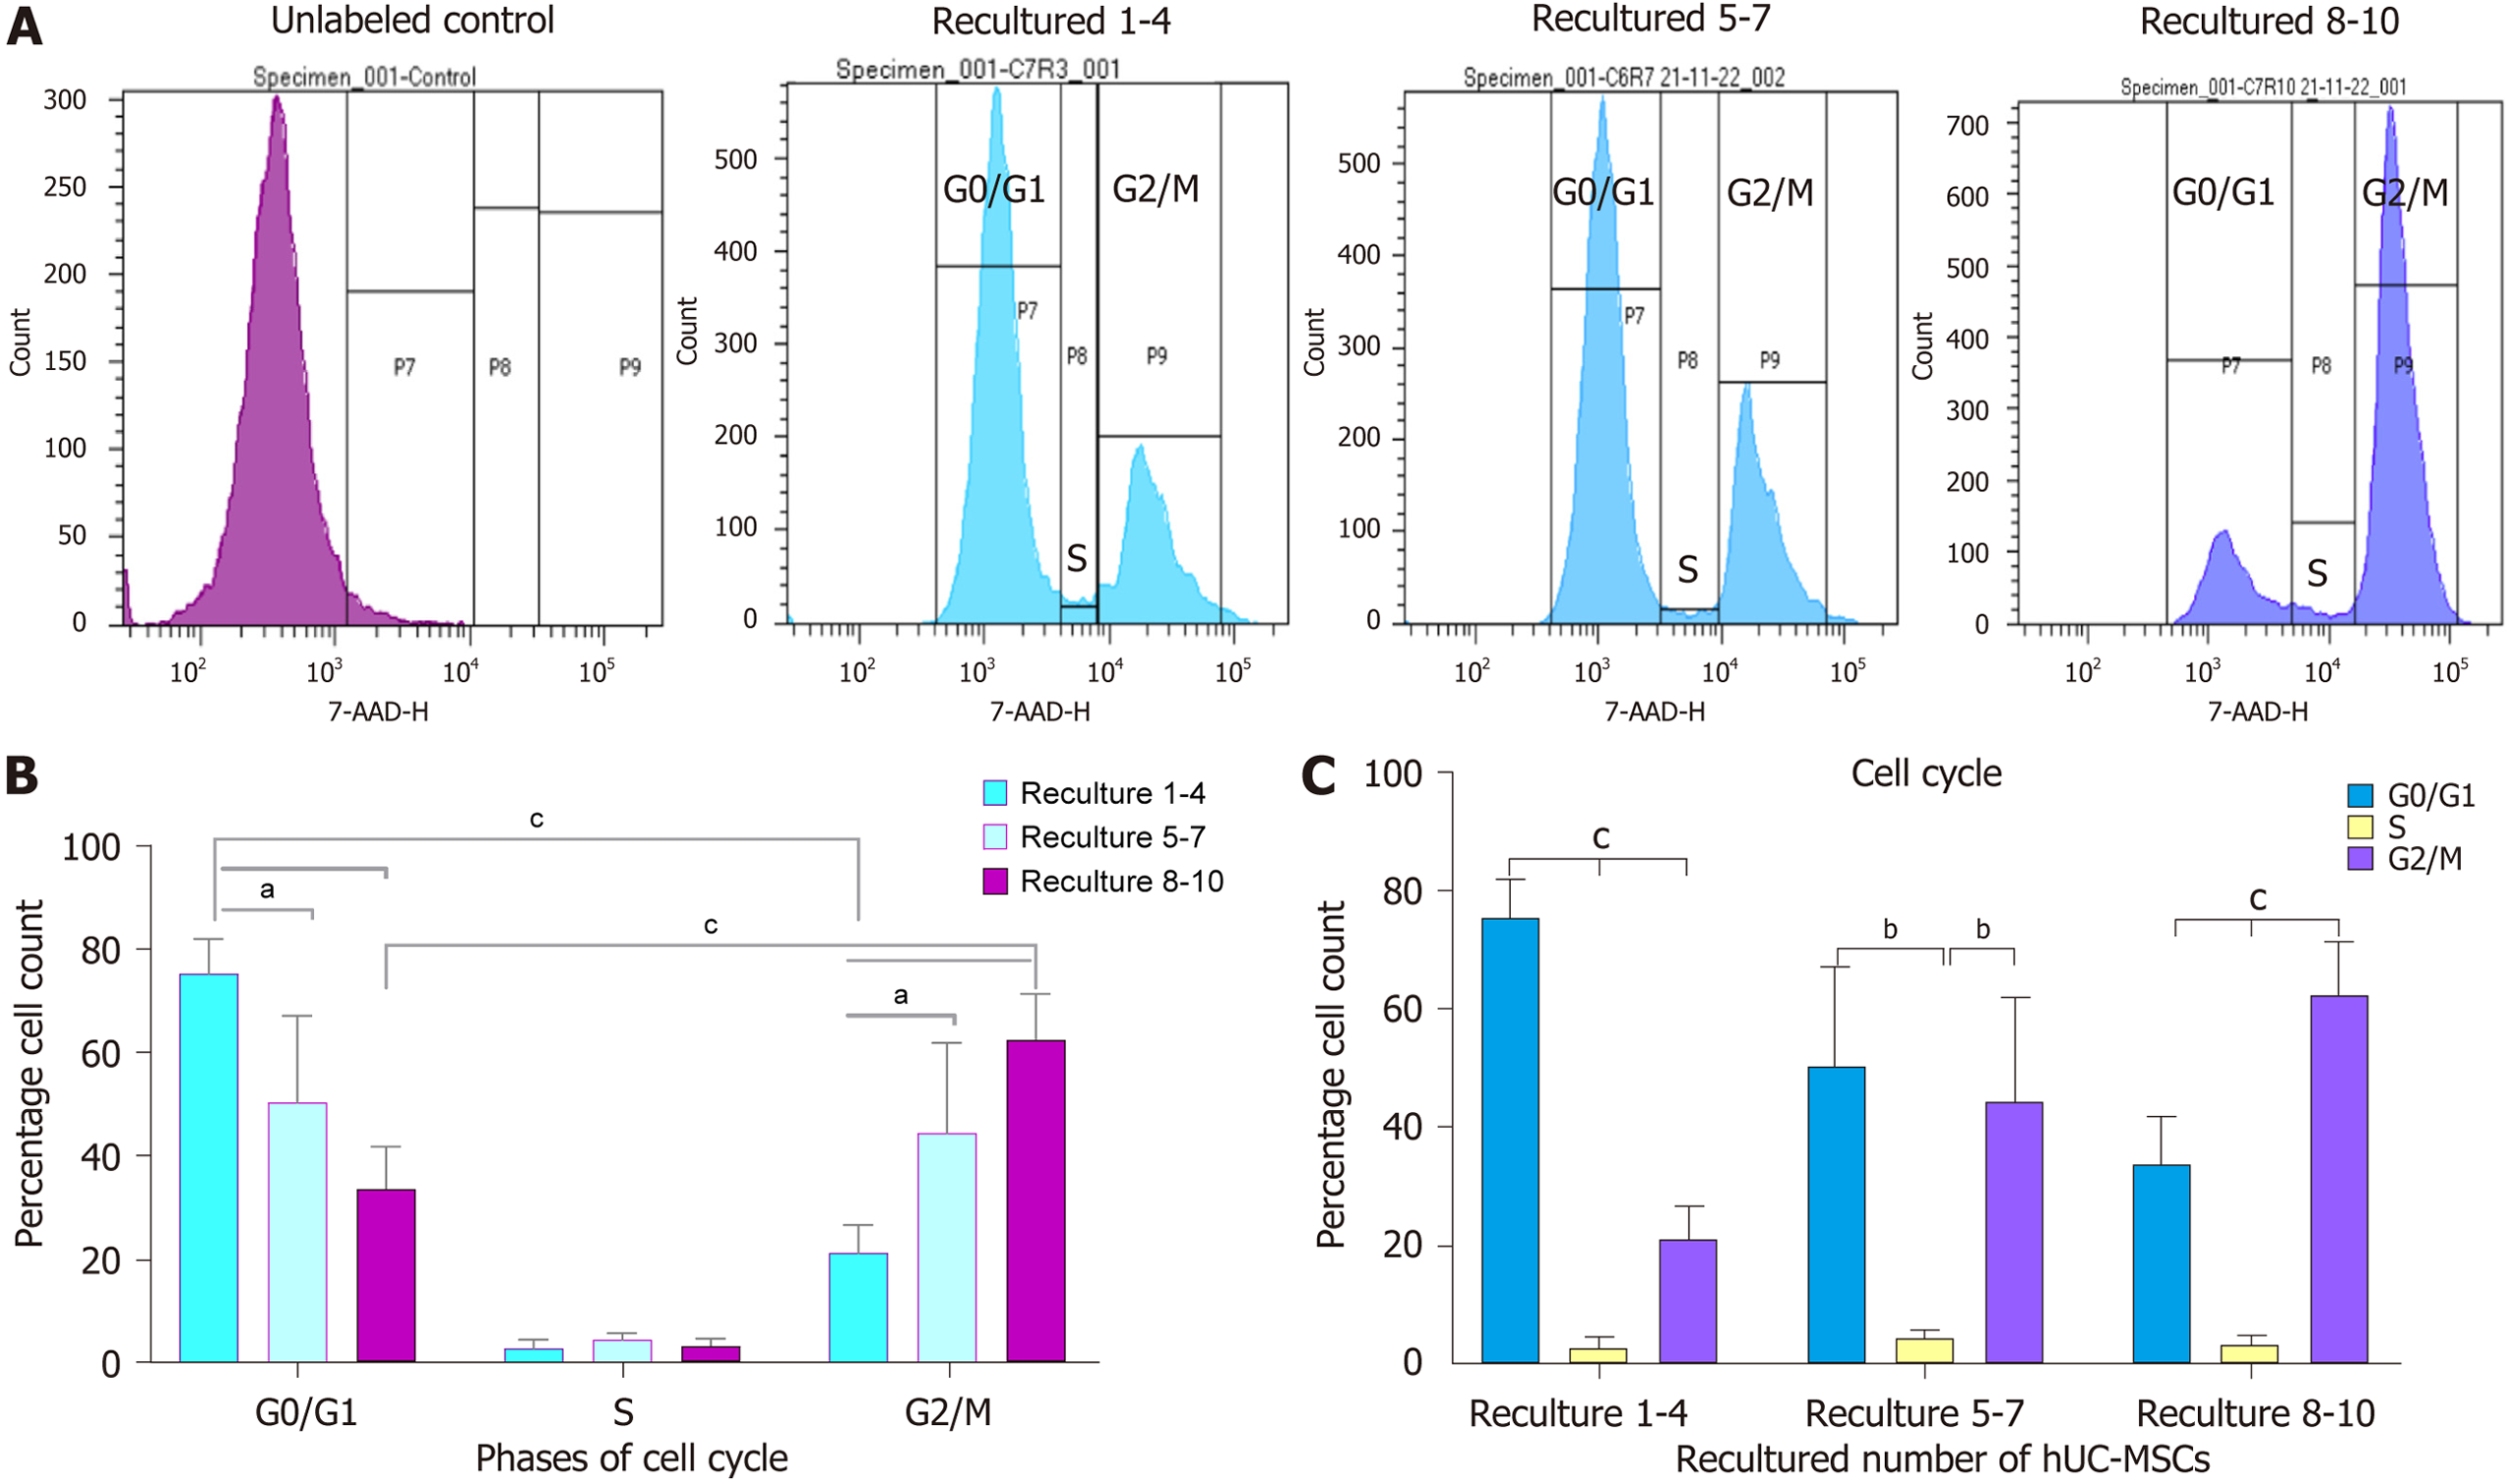
Figure 10 Cell cycle analysis of recultured human umbilical cord-mesenchymal stem cells.
A: The effect of recultured human umbilical cord-mesenchymal stem cells (hUC-MSCs) on cell cycle progression: The cell cycle progression was analyzed by flow cytometry. The histogram showed decrease in G0/G1 phase of the cell cycle between recultured groups 1-4, 5-7, and 8-10. In contrast, no difference was observed in S phase of cell cycle among all three recultured hUC groups. However, the gradual increase in the percentages of hUC-MSCs present in G2/M phase among all three recultured groups (1-4, 5-7, and 8-10) was observed; B: The effects of recultured hUC-MSCs on cell cycle phases: The quantification of cellular percentages in the G0/G1, S and G2/M phases of cell cycle between each recultured groups was evaluated by flow cytometry. The result showed significant decrease in G0/G1 phase of cell cycle at recultured numbers 1-4, 5-7, and 8-10. Conversely, significant increase in G2/M phase at recultured 1-4, 5-7, and 8-10 numbers of hUC-MSCs was observed. The cells percentage showed no significant difference in S phase of the cell cycle at all recultured groups; C: The effects of recultured hUC-MSCs on cell cycle progression: The effects of recultured hUC-MSC showed significantly increased G2/M phase of cell cycle at recultured 5-7 and 8-10. At the same time, results showed significantly decreased G0/G1 phase at recultured numbers 8-10 of hUC-MSCs. The data from six independent experiments is shown as mean ± SD with significant P-values. aP < 0.05, bP < 0.01, and cP < 0.001. The graphical representation shows cumulative data from six representative hUC samples analyzed. hUC: Human umbilical cord; MSC: Mesenchymal stem cell.
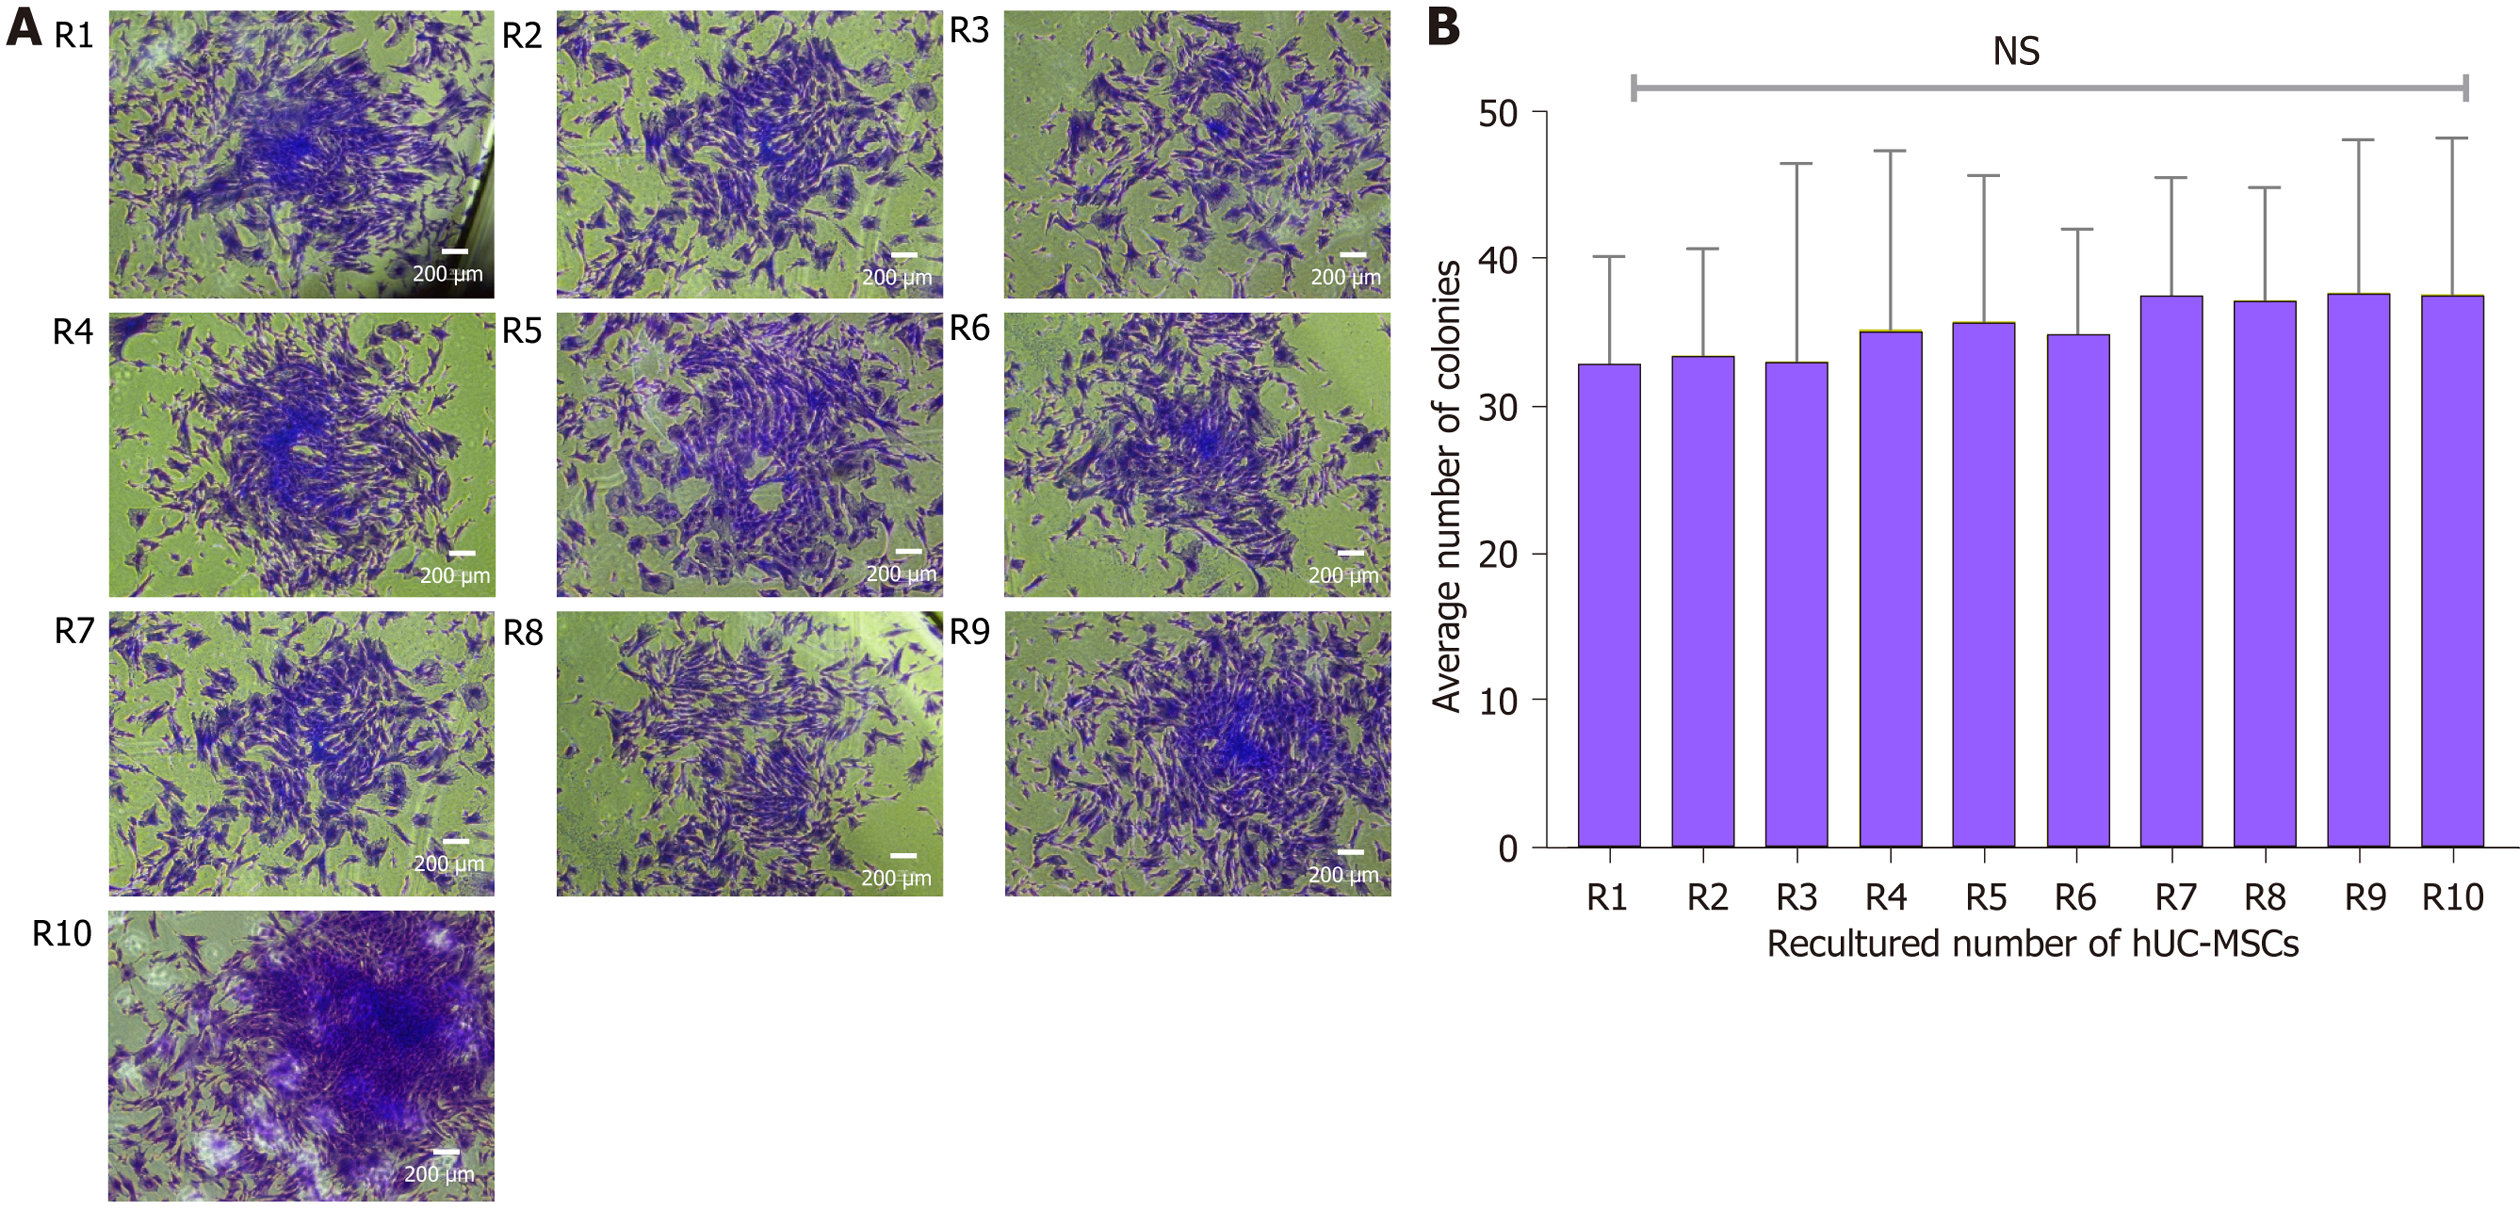
Figure 11 Colony forming unit assay.
A: Formation of colonies at recultured human umbilical cord-mesenchymal stem cells (hUC-MSCs) number: Representation of phase contrast microscopy of spindle-shaped rapidly proliferated colonies of recultured hUC-MSCs at each recultured number (R1-R10); B: Analysis of recultured hUC-MSCs by colony forming unit (CFU): Statistical analysis showed no significant difference in CFU at each recultured hUC-MSCs; all the recultured population of MSCs showed self-replicated spindle-shaped cells that possess the proficiency to form discrete colonies. The experiments were performed in triplicates. NS: No significance. hUC: Human umbilical cord; MSC: Mesenchymal stem cell.
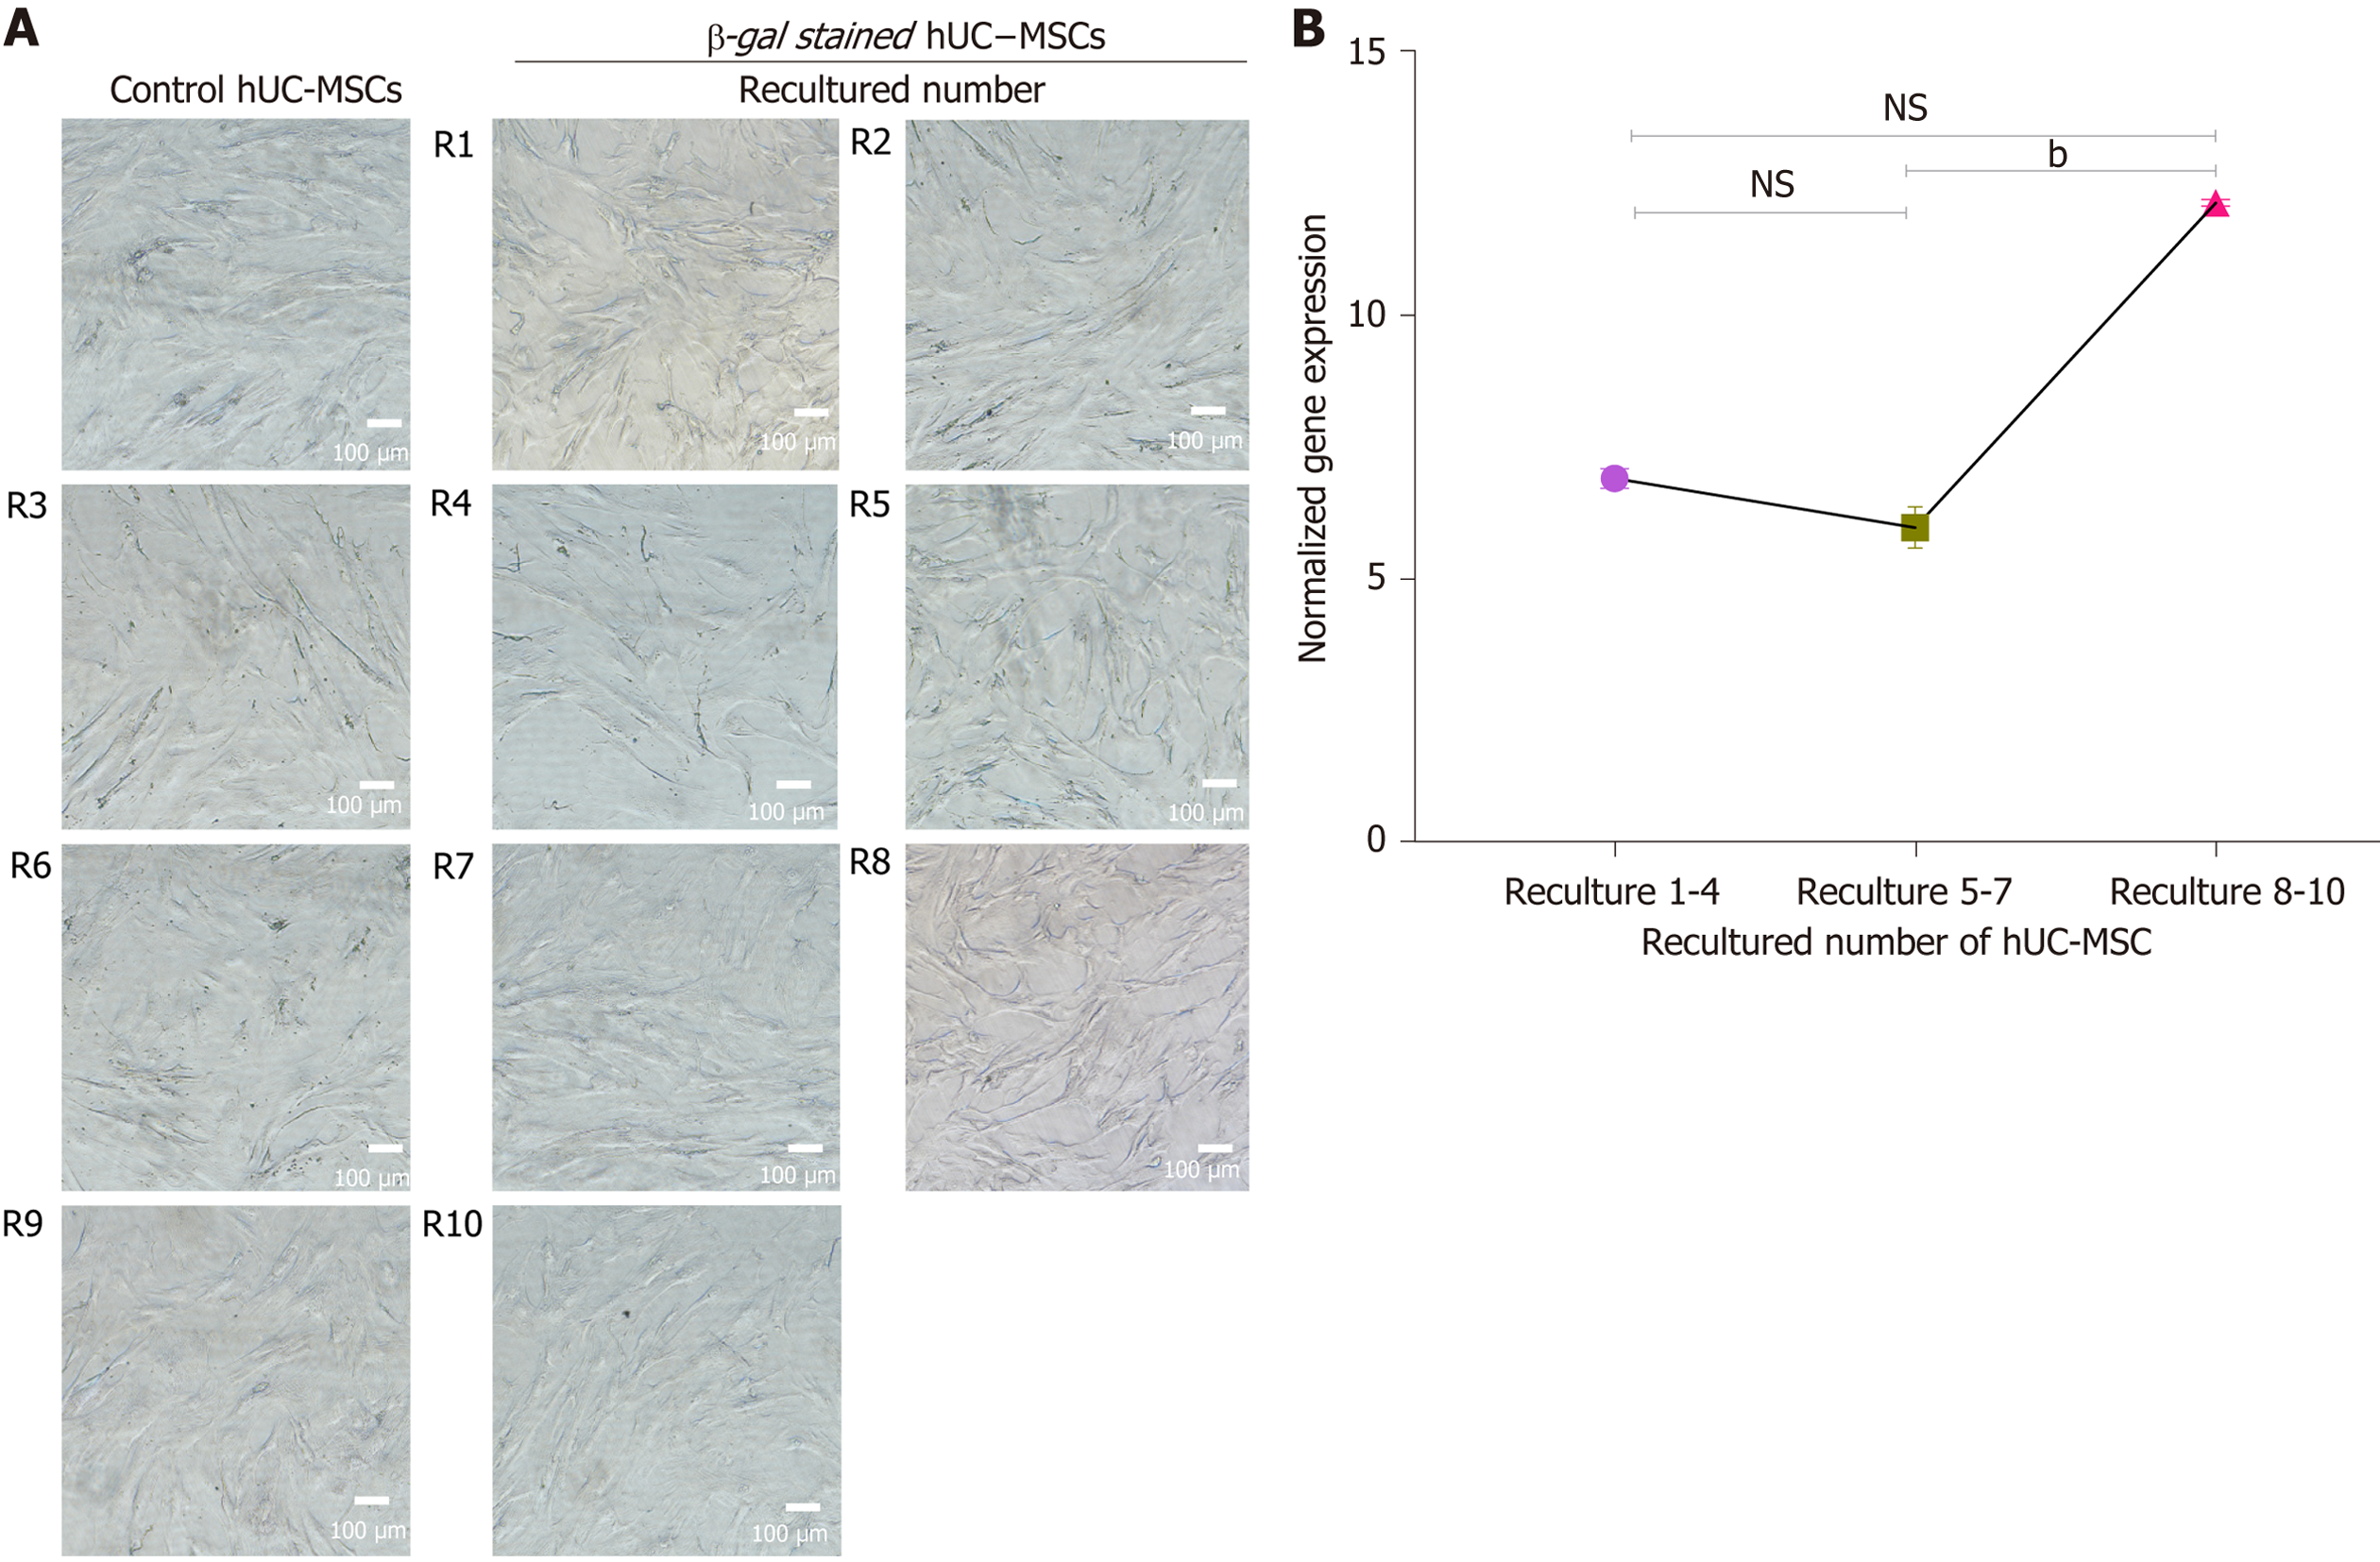
Figure 12 Cell senescence analysis.
A: The effect of recultured human umbilical cord-mesenchymal stem cells (hUC-MSCs) on cellular senescence: The β-galactosidase senescence staining was observed under bright field microscope. The results showed that none of the cells were stained blue, at primary isolated recultured hUC-MSCs isolated (R1-R10), indicating no signal of senescence; B: The graphical representation of human telomerase reverse transcriptase (hTERT) expression in recultured hUC-MSCs: To evaluate the normalized telomerase activity quantitative real-time polymerase chain reaction was performed in triplicate at passages 1-6. The X-axis represents the MSCs derived from recultured hUC at three recultured range and Y-axis represents hTERT expression normalized to housekeeping gene hydroxymethyl-bilane synthase. The hTERT expression at recultured 1-4 and 5-7 showed no significant difference. However, a significant increase in hTERT activity at recultured 8-10 was observed. Values are presented as mean ± SD from three independent experiments. NS: No significance, bP < 0.01. hUC: Human umbilical cord; MSC: Mesenchymal stem cell.
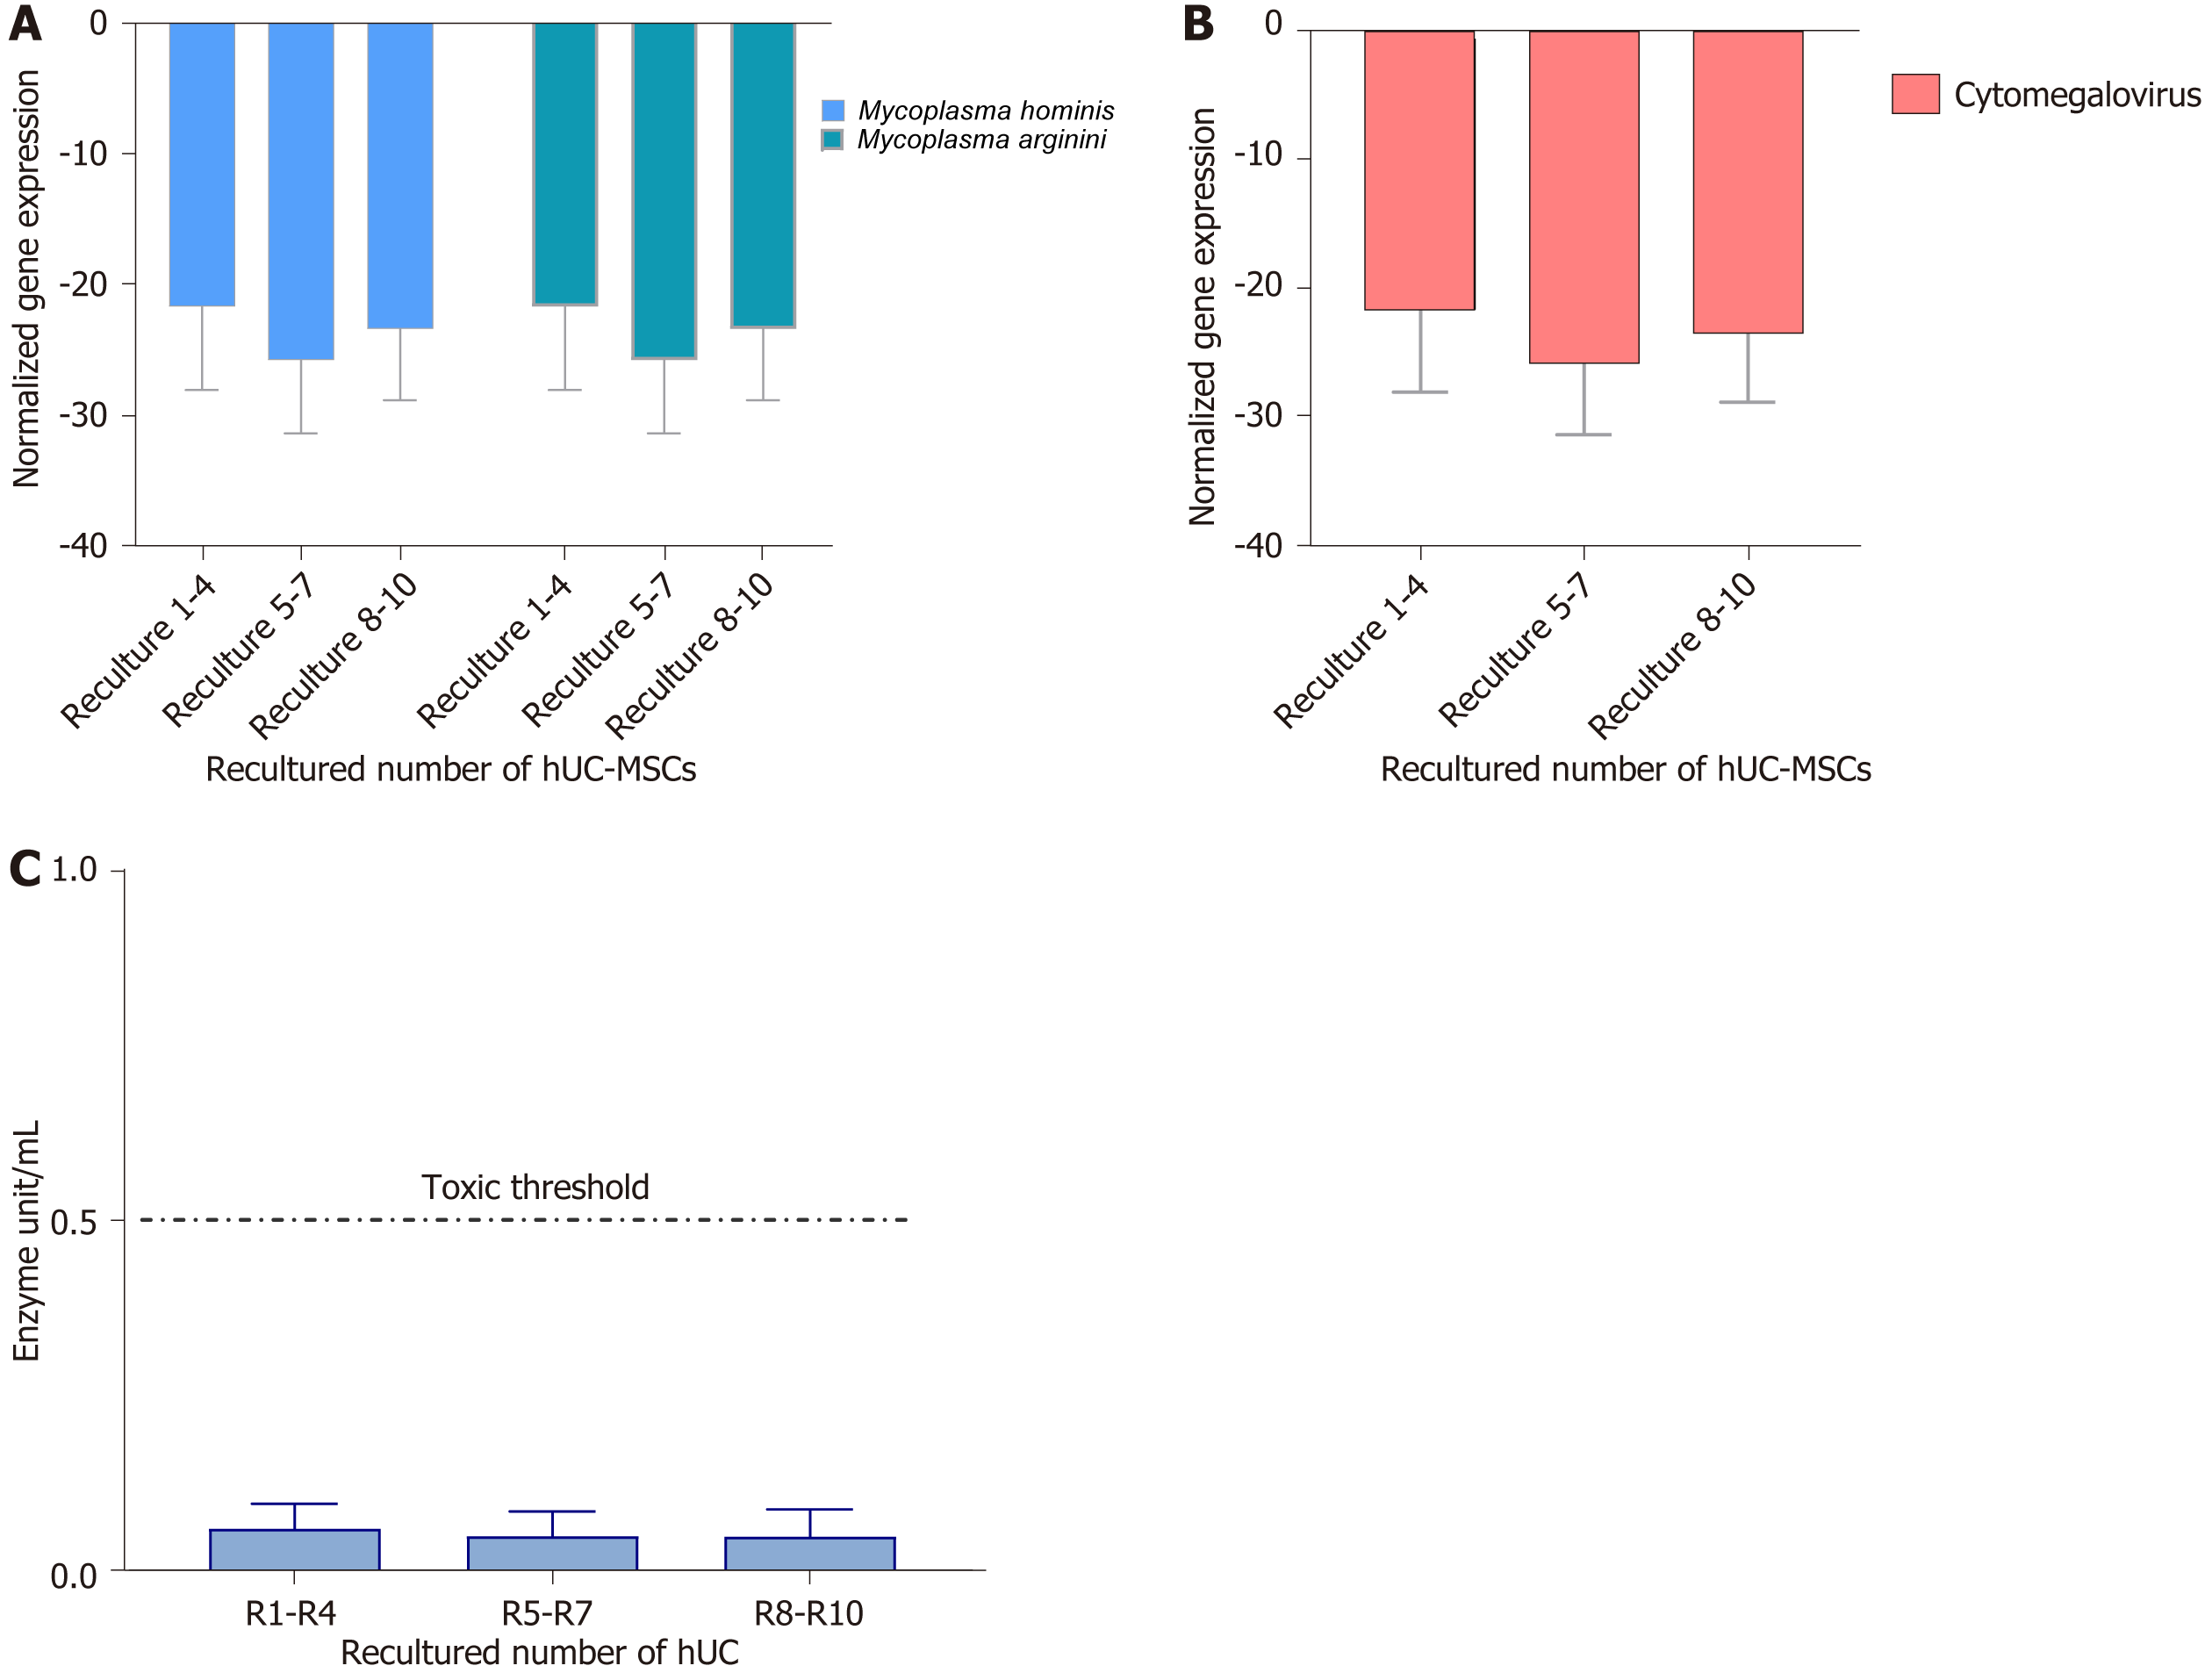
Figure 13 Mycoplasma, cytomegalovirus, and endotoxin analysis.
A and B: The normalized gene expression of mycoplasma and cytomegalovirus in recultured human umbilical cord-mesenchymal stem cells (hUC-MSCs): To evaluate the normalized gene expression of Mycoplasma hominis (M. hominis) and M. arginini and cytomegalovirus, quantification was performed by real-time polymerase chain reaction in triplicate at passages 1-6. The X-axis represents the MSCs derived from recultured hUC at three recultured ranges and the Y-axis represents M. hominis and M. arginini and cytomegalovirus expression normalized to housekeeping gene hydroxymethyl-bilane synthase. The expression at each recultured group showed negative expression of both strains of Mycoplasma. Values are presented as mean ± SD from six independent experiments. Statistically non-significant normalized expression was obtained; C: Recultured hUC-MSCs endotoxin analysis: The level of endotoxin in recultured hUC-MSC was measured by using the Pierce LAL Chromogenic Endotoxin Quantification Kit. The concentration of endotoxin is below 0.5 EU/mL. hUC: Human umbilical cord; MSC: Mesenchymal stem cell.
- Citation: Rajput SN, Naeem BK, Ali A, Salim A, Khan I. Expansion of human umbilical cord derived mesenchymal stem cells in regenerative medicine. World J Stem Cells 2024; 16(4): 410-433
- URL: https://www.wjgnet.com/1948-0210/full/v16/i4/410.htm
- DOI: https://dx.doi.org/10.4252/wjsc.v16.i4.410


