©The Author(s) 2024.
World J Stem Cells. Apr 26, 2024; 16(4): 389-409
Published online Apr 26, 2024. doi: 10.4252/wjsc.v16.i4.389
Published online Apr 26, 2024. doi: 10.4252/wjsc.v16.i4.389
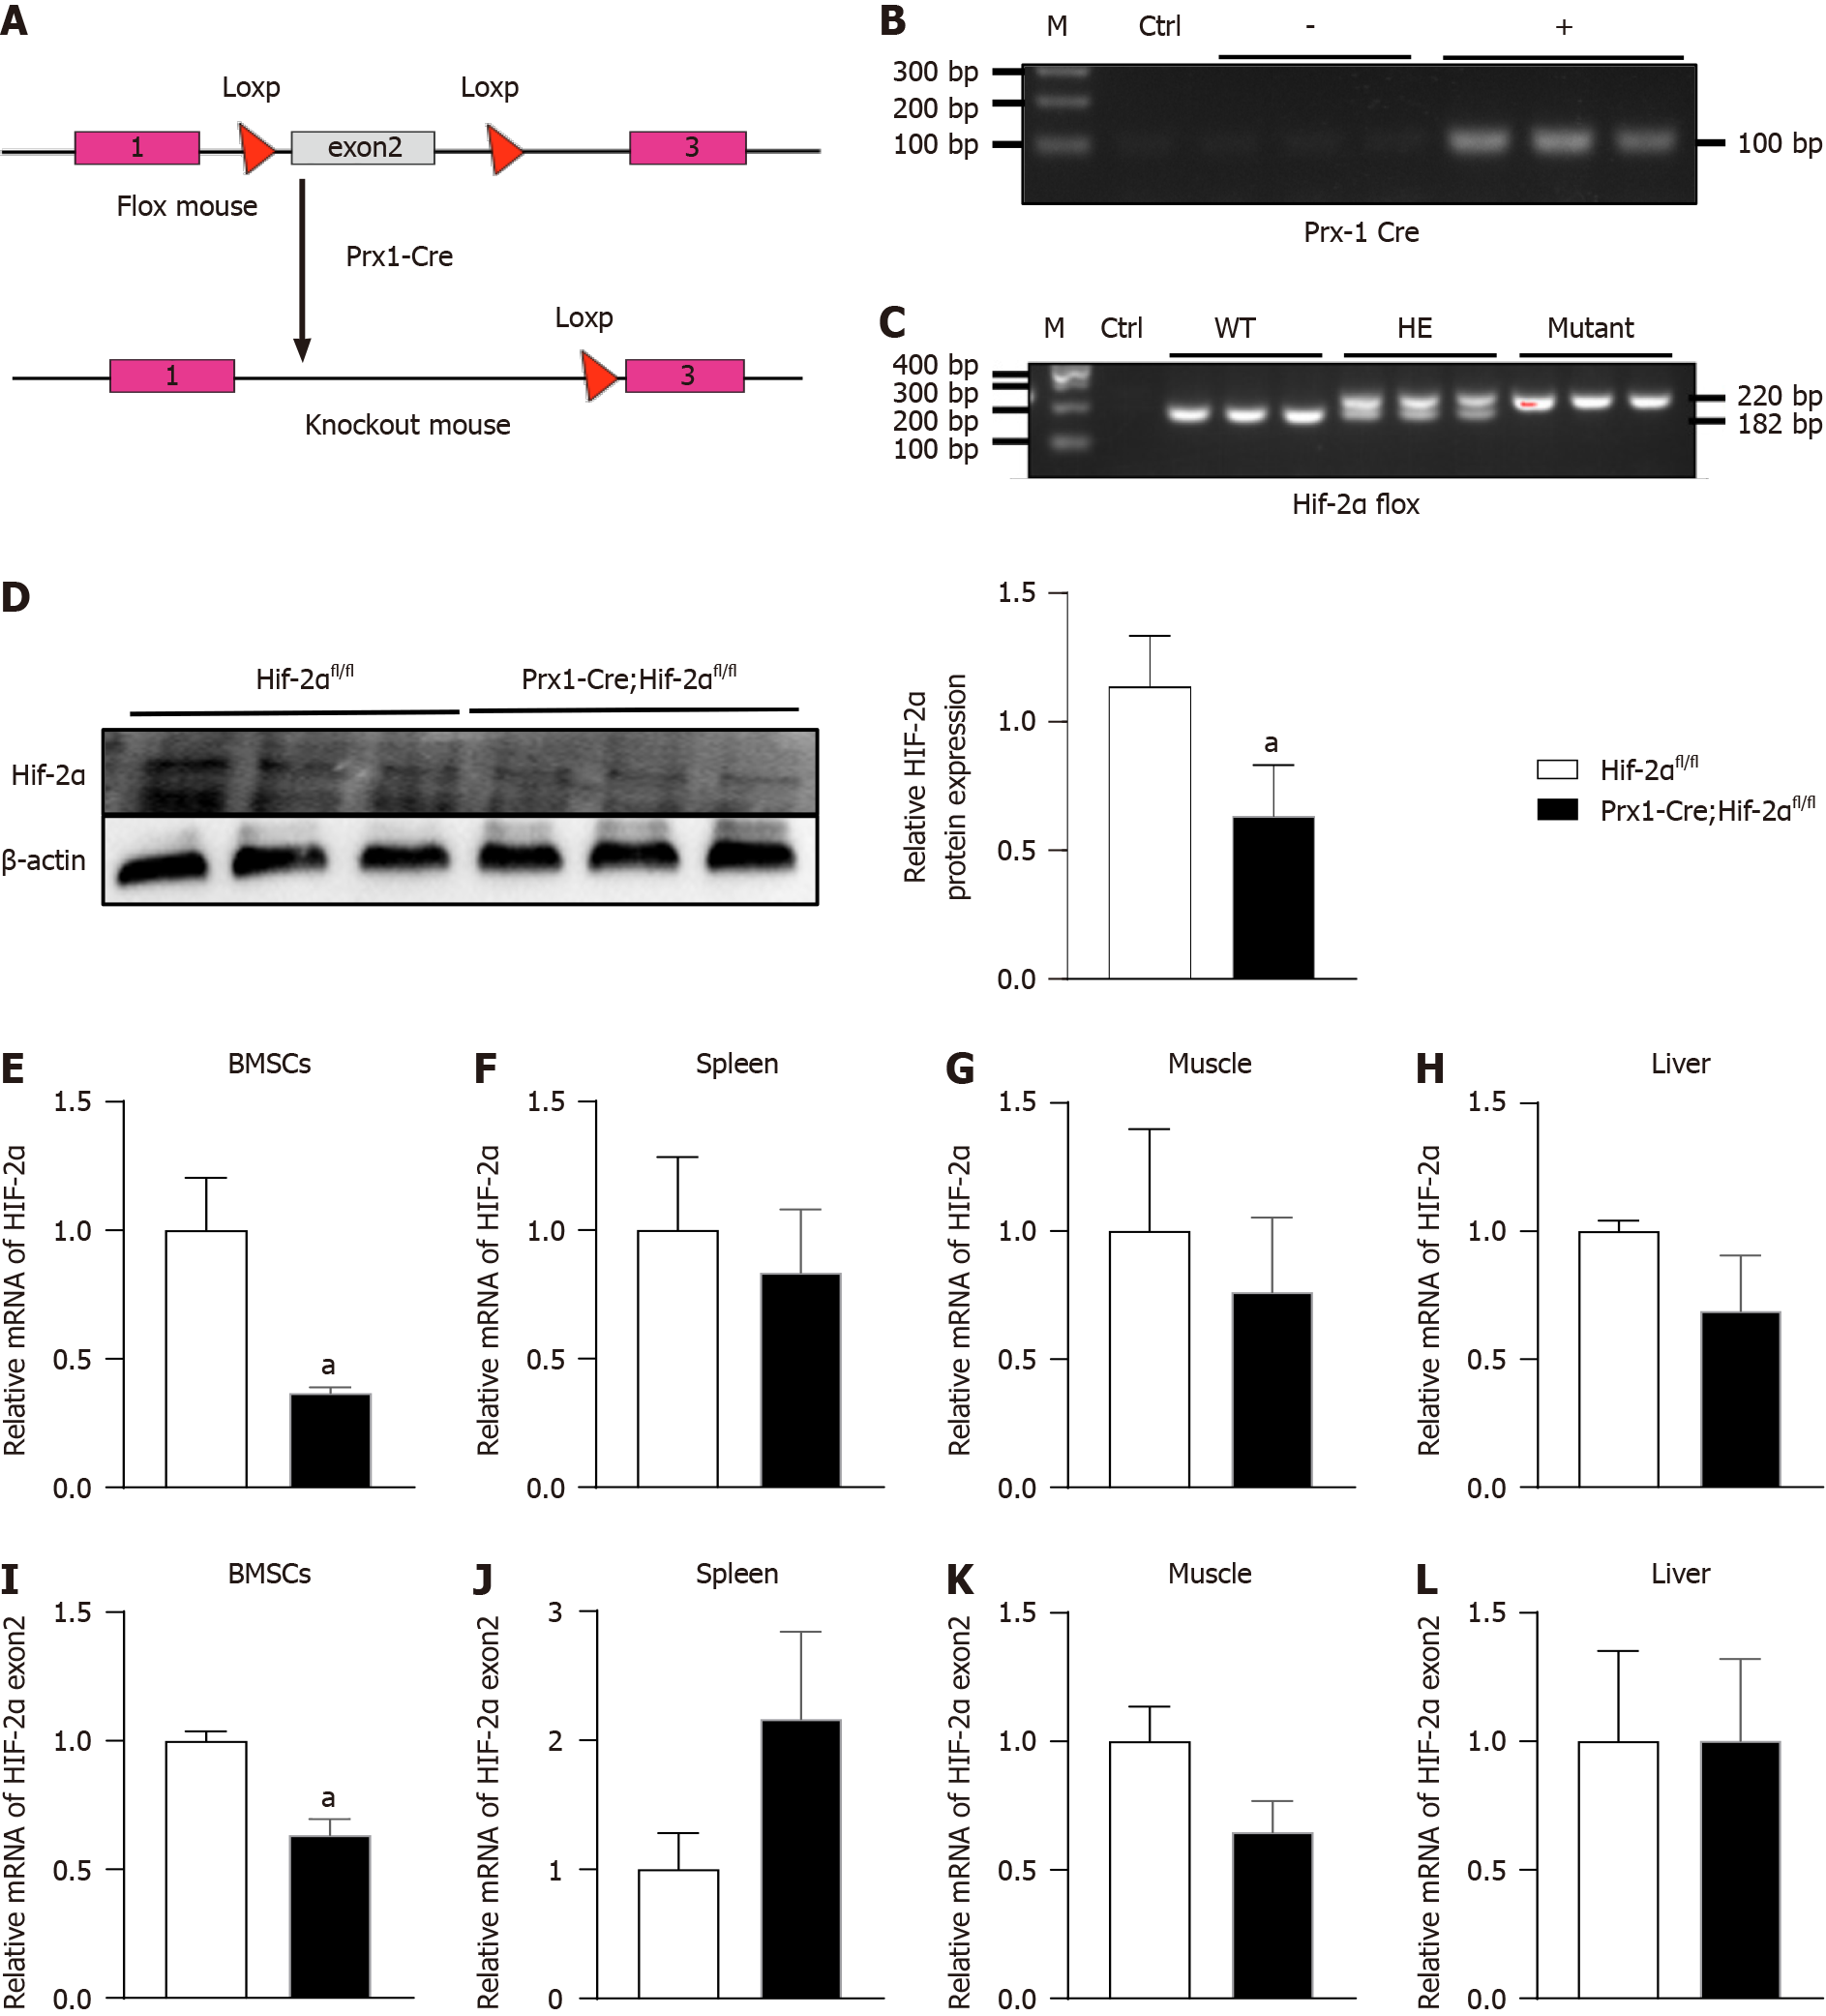
Figure 1 Generation of mice with bone mesenchymal stem cell-specific hypoxia-inducible factor 2alpha-KO.
A: The mouse mating process; B: Prx-1 Cre gene identification; 100 bp is the positive band; C: Hypoxia-inducible factor 2alpha (HIF-2α) gene identification; 220 bp is the target band, 182 bp is the WT band; D: The differences in protein expression in primary bone mesenchymal stem cells (BMSCs) isolated from Prx1-Cre;Hif-2αfl/fl and Hif-2αfl/fl mice; E-L: HIF-2α (E) and HIF-2α Exon2 (I) transcript levels in BMSCs in Prx1-Cre;Hif-2αfl/fl and Hif-2αfl/fl mice; HIF-2α (F) and HIF-2α Exon2 (J) transcript levels in spleens of Prx1-Cre;Hif-2αfl/fl and Hif-2αfl/fl mice; HIF-2α (G) and HIF-2α Exon2 (K) transcript levels in muscles of Prx1-Cre;Hif-2αfl/fl and Hif-2αfl/fl mice; HIF-2α (H) and HIF-2α Exon2 (L) transcript levels in livers of Prx1-Cre;Hif-2αfl/fl and Hif-2αfl/fl mice; aP < 0.05. BMSC: Bone mesenchymal stem cell; HIF-2α: Hypoxia-inducible factor 2alpha.
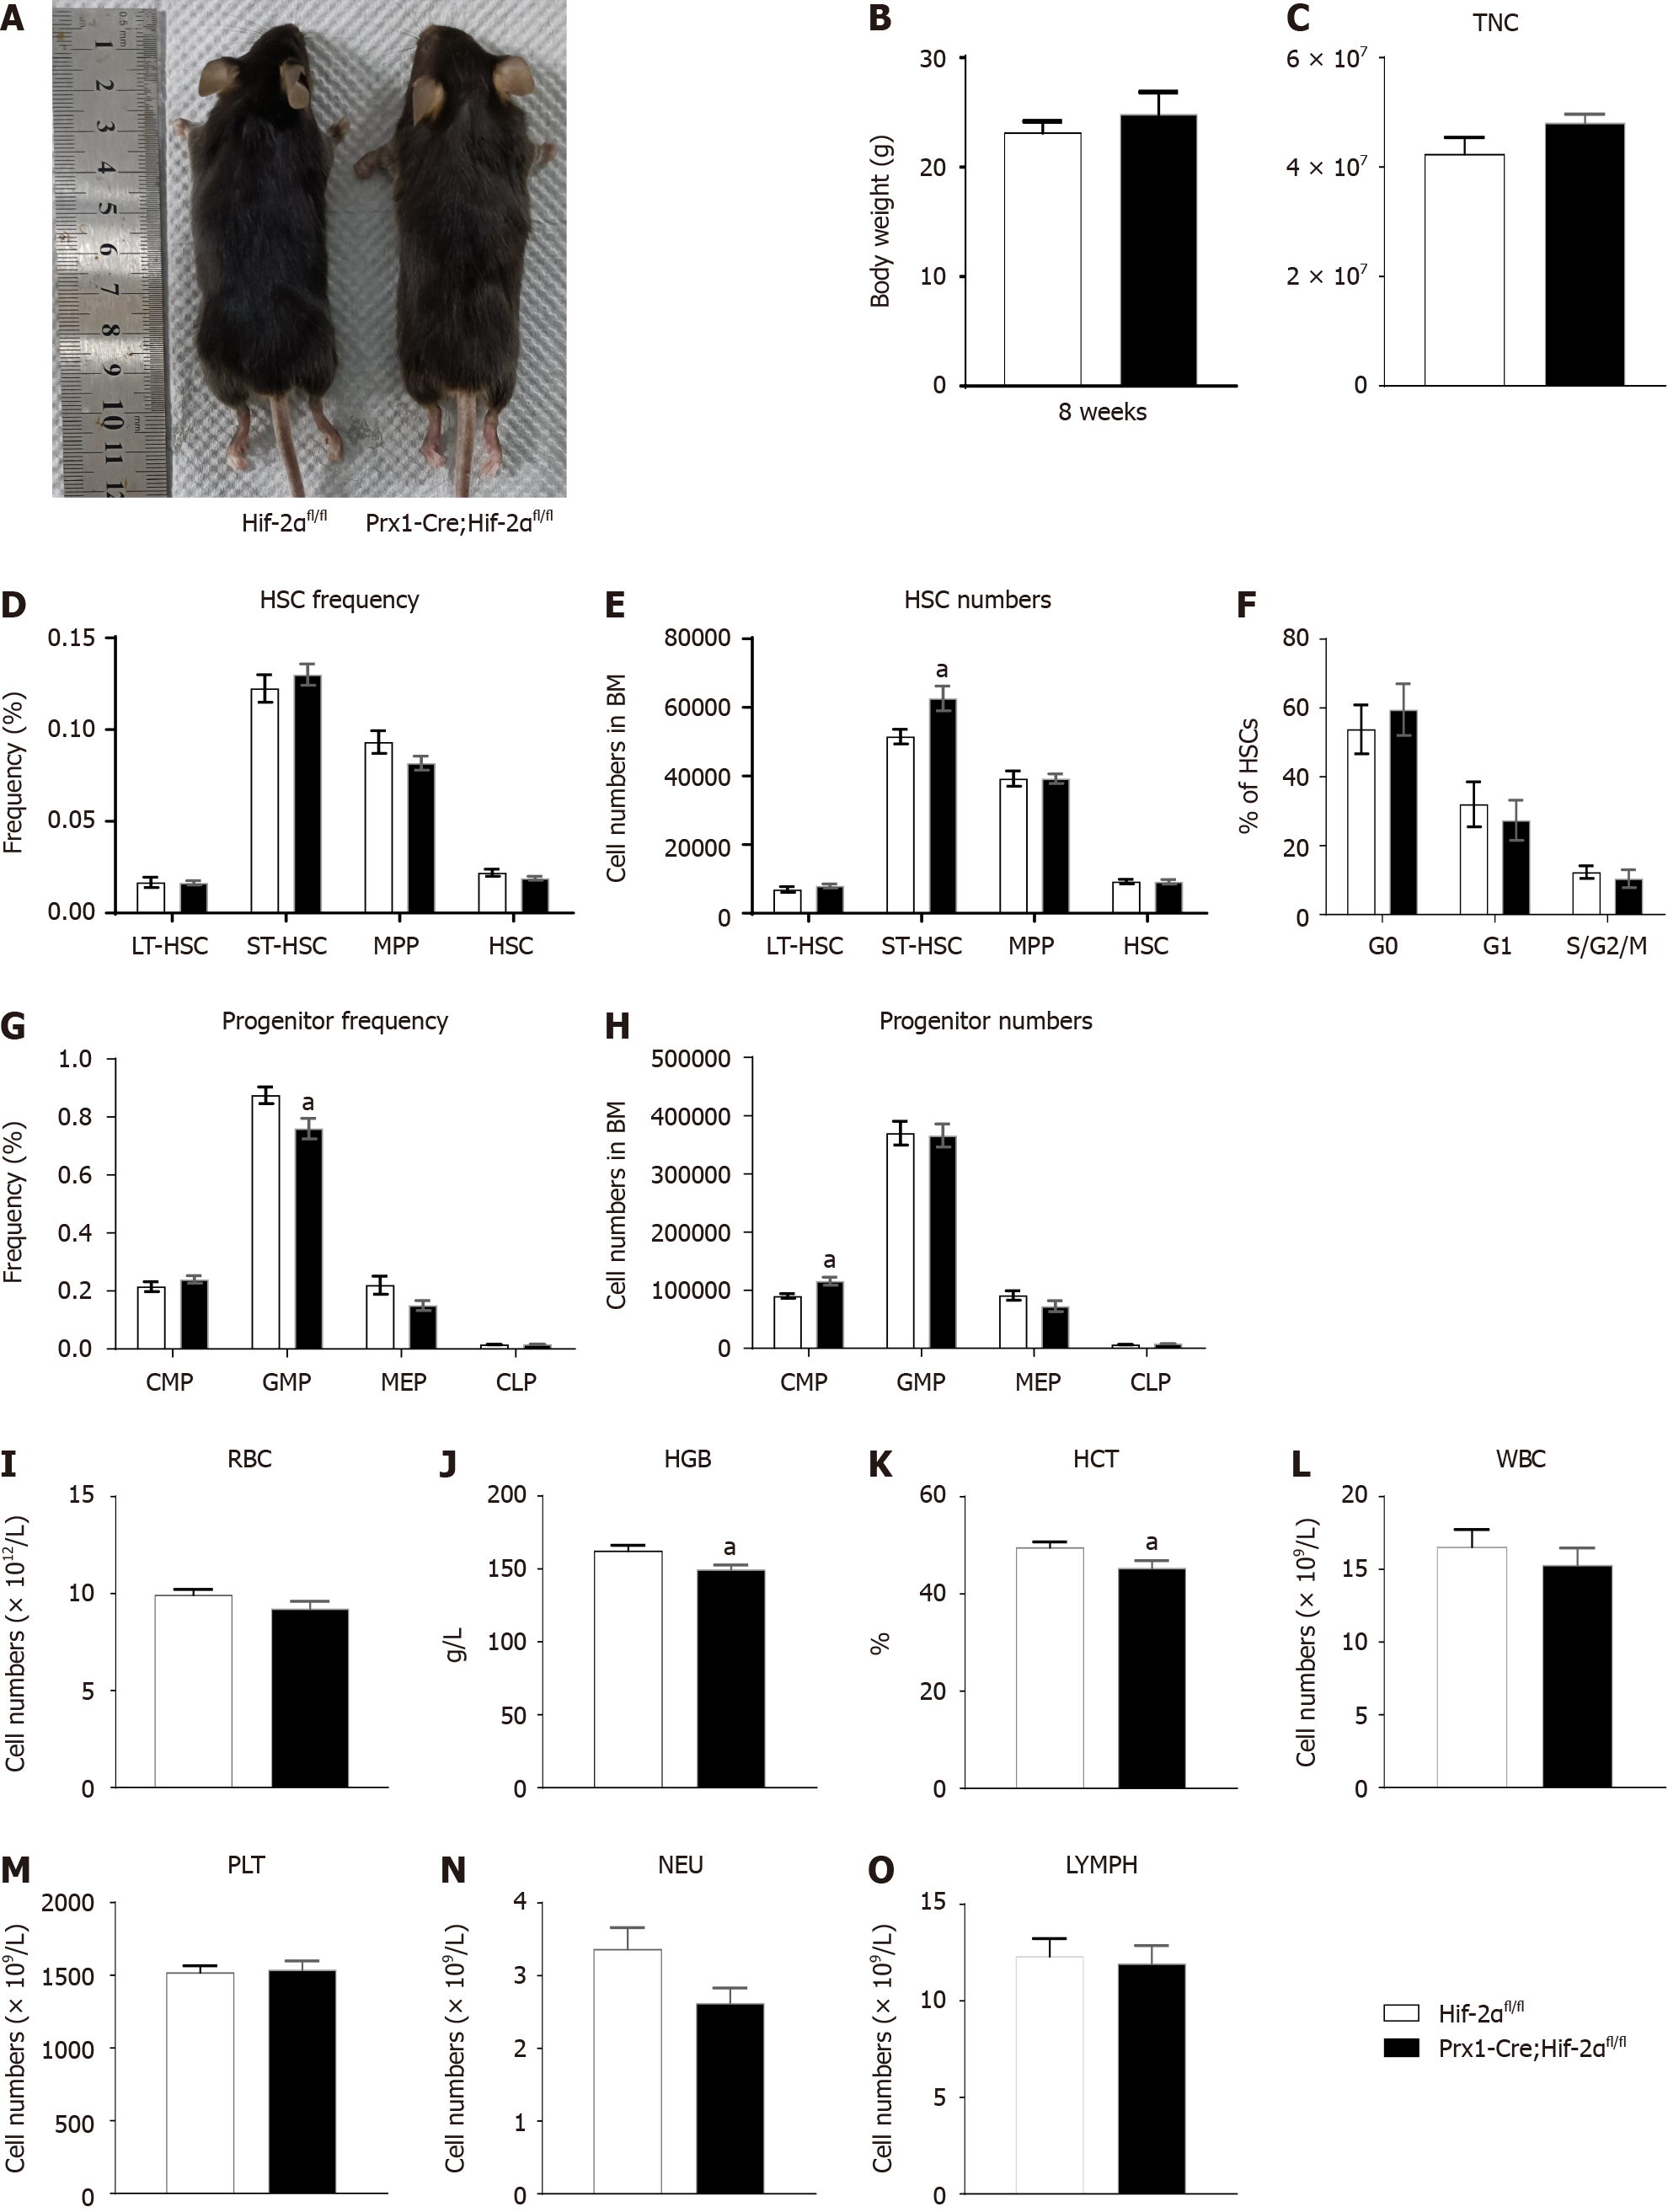
Figure 2 Hypoxia-inducible factor 2alpha-deficient mice were grossly developmentally normal and exhibited mild anemia but normal hematopoiesis.
A: Representative images of two-month-old Prx1-Cre;Hif-2αfl/fl and Hif-2αfl/fl mice; B: Body masses of 2-month-old Prx1-Cre;Hif-2αfl/fl and Hif-2αfl/fl mice; C: Total nucleated cells in bone marrow (BM); D-O: BM cells freshly harvested from 8-wk-old Prx1-Cre;Hif-2αfl/fl and Hif-2αfl/fl mice were assayed by multiparametric fluorescence-activated cell sorting (FACS) analyses to determine the frequencies of hematopoietic stem cells (HSCs) (D), HSC numbers (E), frequencies of progenitors (G), and progenitor numbers (H); BM cells harvested from Prx1-Cre;Hif-2αfl/fl and Hif-2αfl/fl mice were assayed by FACS to determine the cell cycle status of HSCs. The percentages of HSCs in G0, G1, and S/G2/M phases (F) were quantified; erythrocyte count (I), hemoglobin content (J), hematocrit value (K), white blood cell count (L), platelet count (M), neutrophil count (N), and lymphocyte count (O) in peripheral blood of Prx1-Cre;Hif-2αfl/fl and Hif-2αfl/fl mice; aP < 0.05. TNC: Total nucleated cell; HSC: Hematopoietic stem cell; LT-HSC: Long-term hematopoietic stem cell; ST-HSC: Short-term hematopoietic stem cell; MPP: Multipotent progenitor; MSC: Mesenchymal stem cell; CMP: Common myeloid progenitor; GMP: Granulocyte-monocyte progenitor; MEP: Megakaryocyte-erythroid progenitor; CLP: Common lymphoid progenitor; RBC: Red blood cell; HGB: Hemoglobin; HCT: Hematocrit; WBC: White blood cell; PLT: Platelet; NEU: Neutrophil; LYMPH: Lymphocyte; HIF-2α: Hypoxia-inducible factor 2alpha.
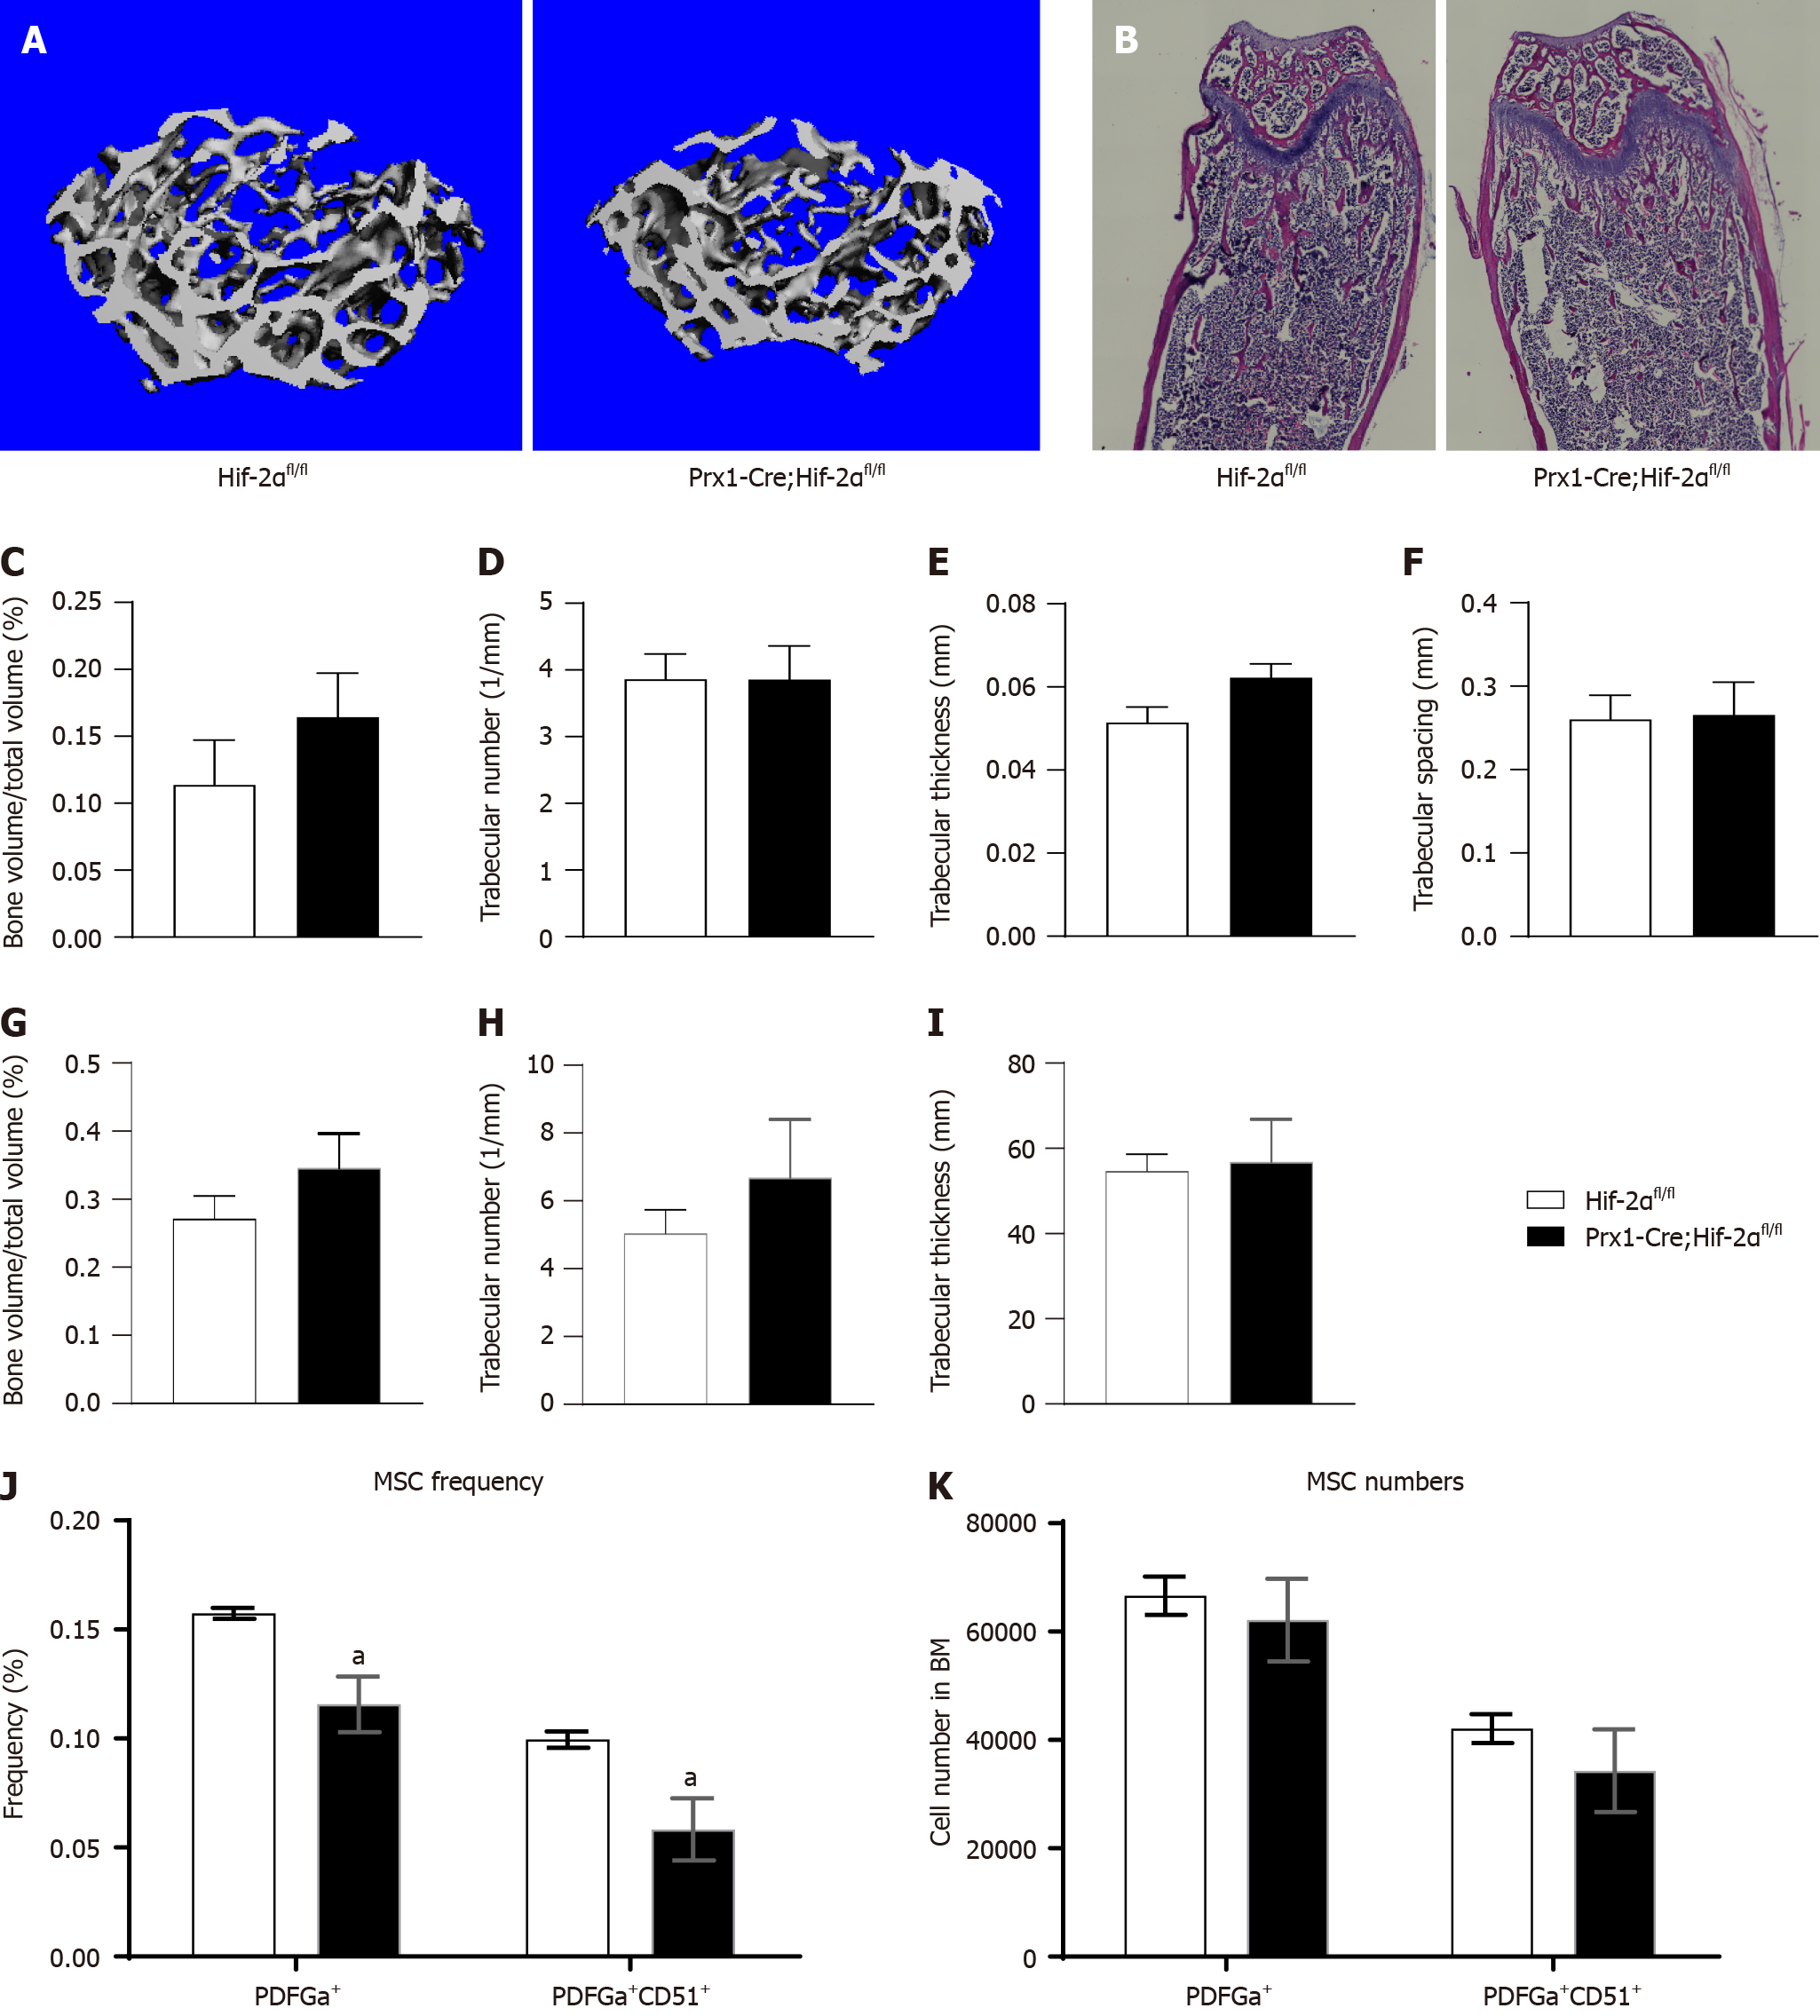
Figure 3 Adult Prx1-Cre;Hif-2αfl/fl and Hif-2αfl/fl mice exhibit no difference in bone mass under the naive condition.
A: Microcomputed tomography (μCT) reconstruction images of distal femoral metaphyses from 2-month-old Prx1-Cre;Hif-2αfl/fl and Hif-2αfl/fl mice; B: Hematoxylin and eosin (HE) staining images of distal femoral metaphyses from 2-month-old Prx1-Cre;Hif-2αfl/fl and Hif-2αfl/fl mice; C-K: Quantitative μCT analyses of the structural parameters of femoral trabeculae from 2-month-old mice: bone volume/tissue volume (C), trabecular number (D), trabecular thickness (E), and trabecular spacing (F); quantitative HE staining analysis of the structural parameters of femoral trabeculae from 2-month-old mice: bone volume/tissue volume (G), trabecular number (H), and trabecular thickness (I); bone marrow cells freshly harvested from 8-wk-old Prx1-Cre;Hif-2αfl/fl and Hif-2αfl/fl mice were assayed by multiparameter fluorescence-activated cell sorting analyses to determine the frequency (J) and number (K) of bone mesenchymal stem cells. aP < 0.05. MSC: Mesenchymal stem cell.
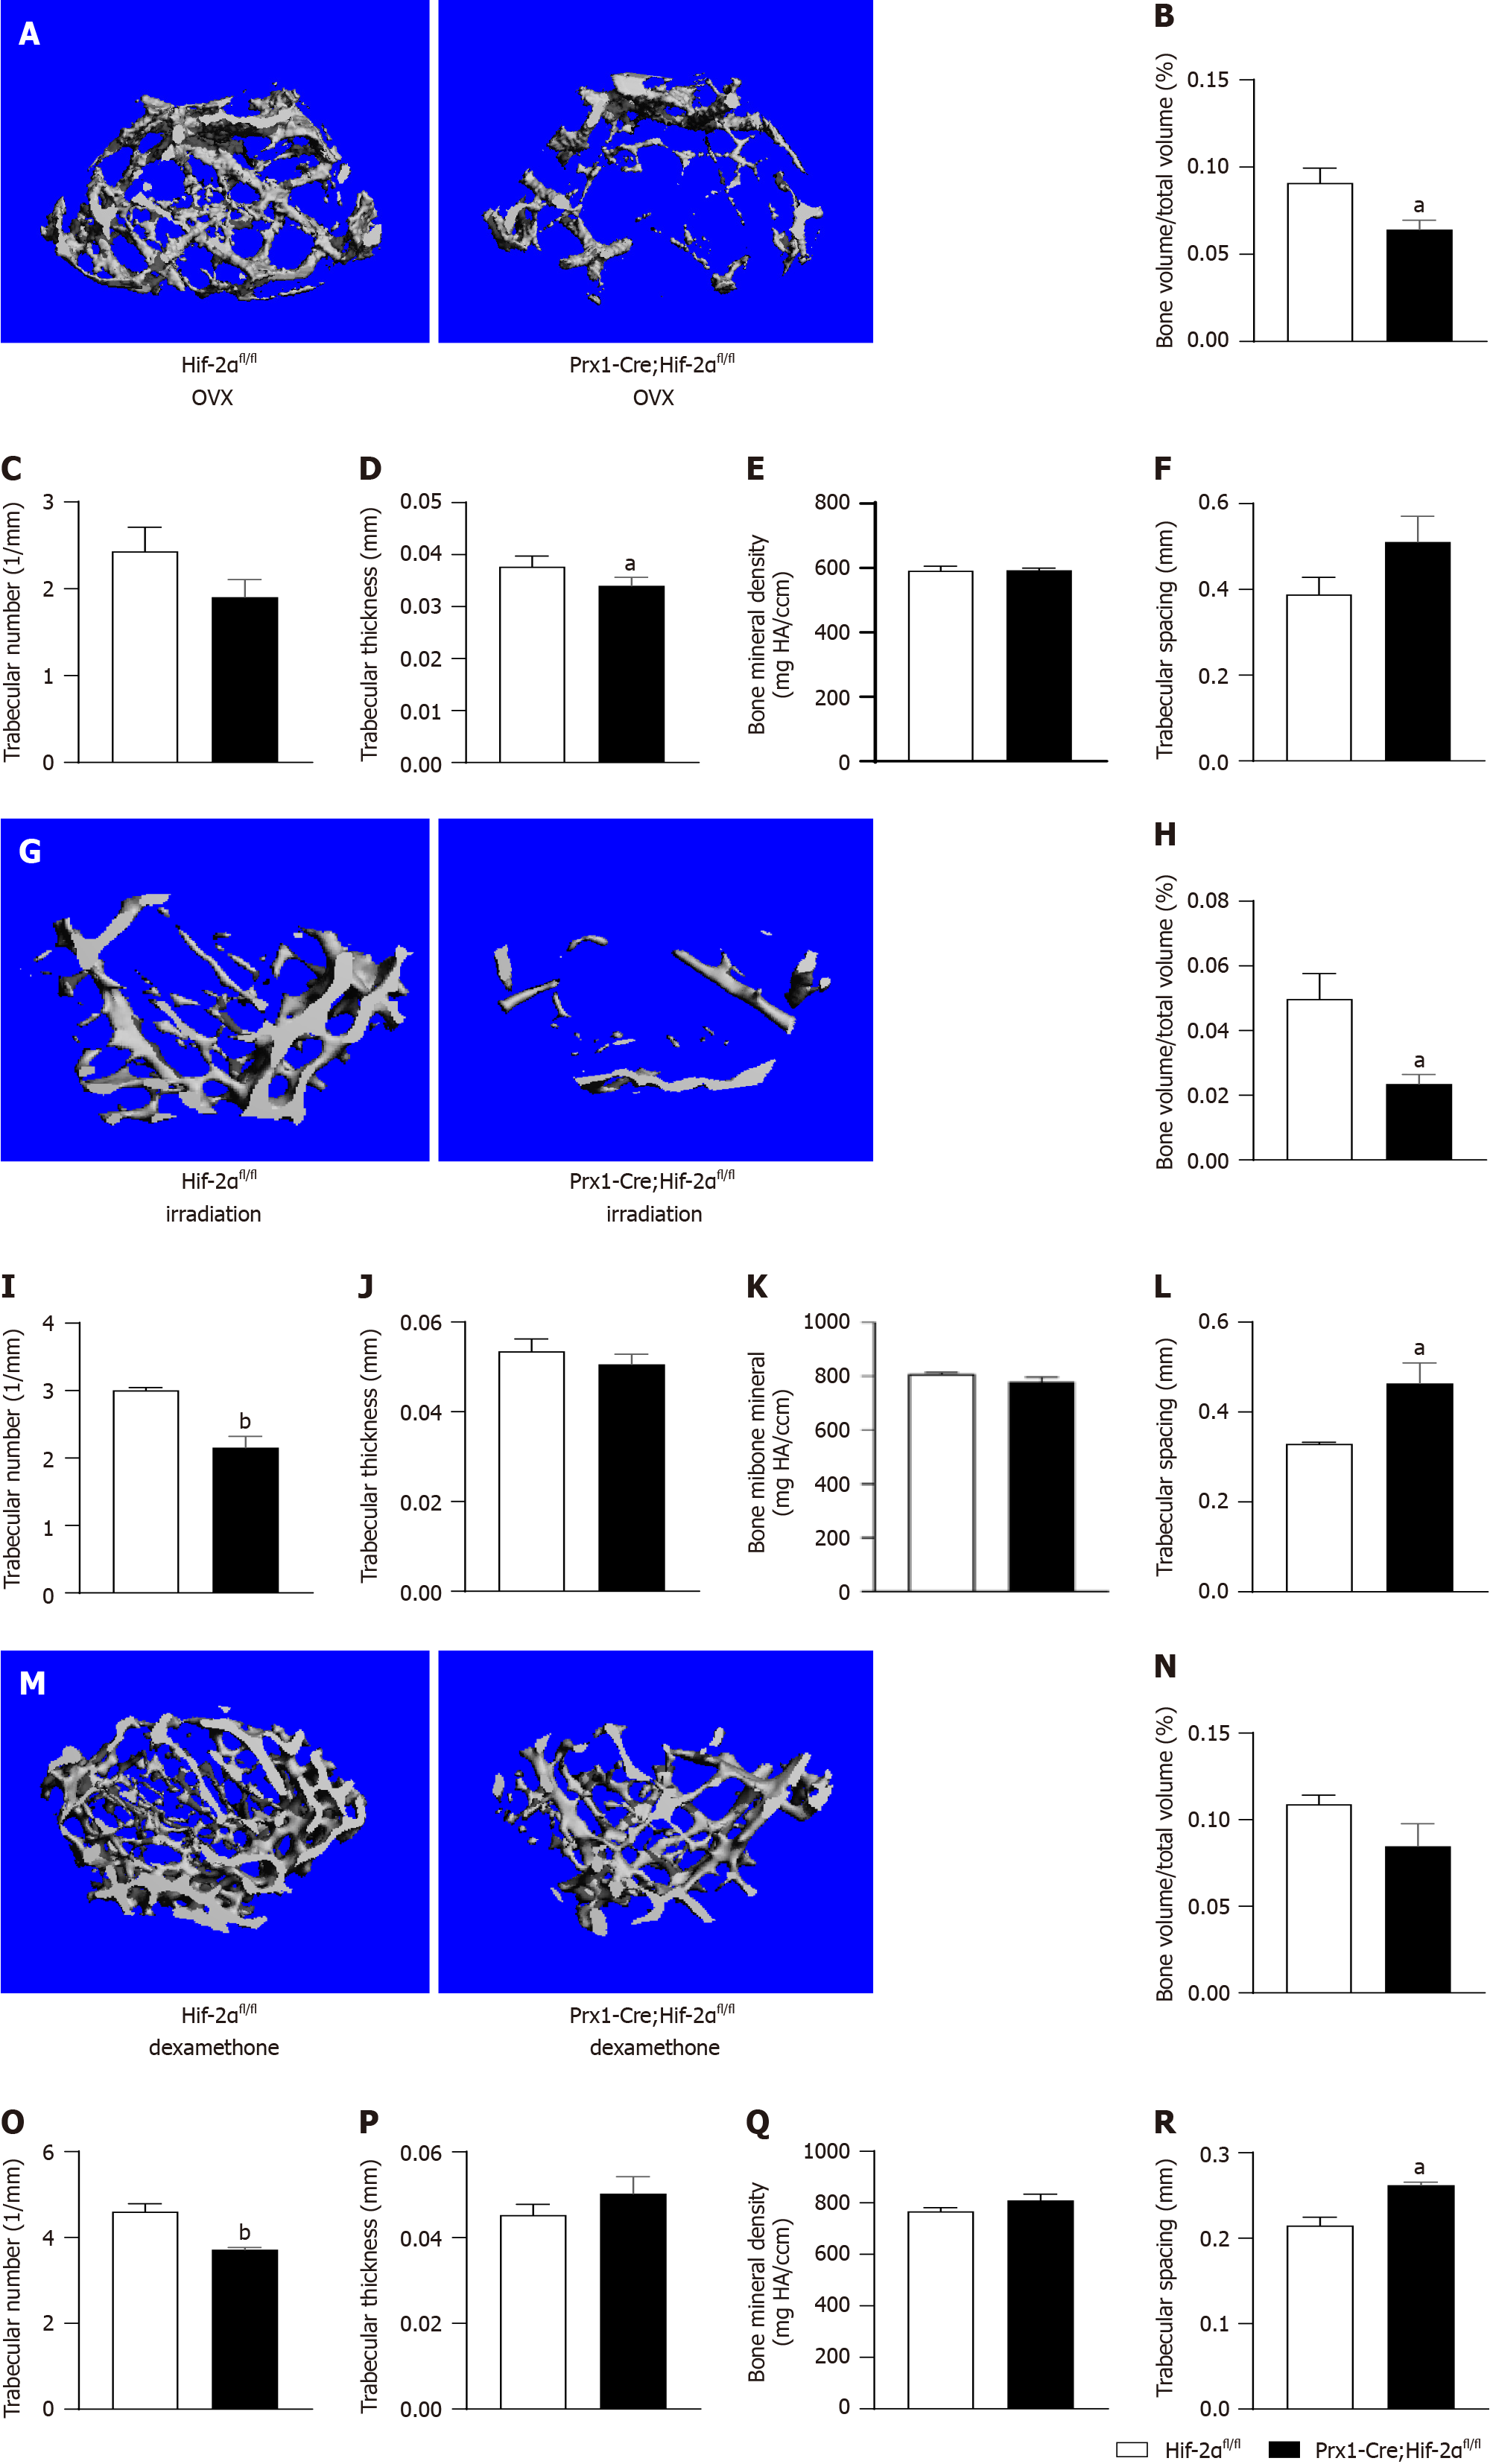
Figure 4 Adult Prx1-Cre;Hif-2αfl/fl and Hif-2αfl/fl mice exhibit decreased bone mass under three different stimulation conditions.
A: Representative microcomputed tomography (μCT) images of femora from both Prx1-Cre;Hif-2αfl/fl and Hif-2αfl/fl mice 8 wk after ovariectomy; B-E: The bone volume (BV) fraction [BV/total volume (TV)] (B), trabecular number (Tb.N) (C), trabecular thickness (Tb.Th) (D) and bone mineral density (E) in the distal metaphysis of the femur were decreased by ovariectomy in Prx1-Cre;Hif-2αfl/fl mice, while the trabecular spacing (Tb.Sp) was appreciably increased in Prx1-Cre;Hif-2αfl/fl mice; G: Representative μCT images of femora from both Prx1-Cre;Hif-2αfl/fl and Hif-2αfl/fl mice 4 wk after semilethal irradiation; H-L: The BV/TV (H), Tb.N (I), Tb.Th (J) and BMD (K) in the distal metaphysis of the femur were obviously decreased by semilethal irradiation in Prx1-Cre;Hif-2αfl/fl mice, while the Tb.Sp (L) was appreciably increased in Prx1-Cre;Hif-2αfl/fl mice; M: Representative μCT images of femora from both Prx1-Cre;Hif-2αfl/fl and Hif-2αfl/fl mice 4 wk after dexamethasone treatment; N-R: The BV/TV (N), Tb.N (O), Tb.Th (P) and BMD (Q) in the distal metaphysis of the femur were obviously decreased by dexamethasone treatment in Prx1-Cre;Hif-2αfl/fl mice, while the Tb.Sp (R) was appreciably increased in Prx1-Cre;Hif-2αfl/fl mice. aP < 0.05, bP < 0.01.
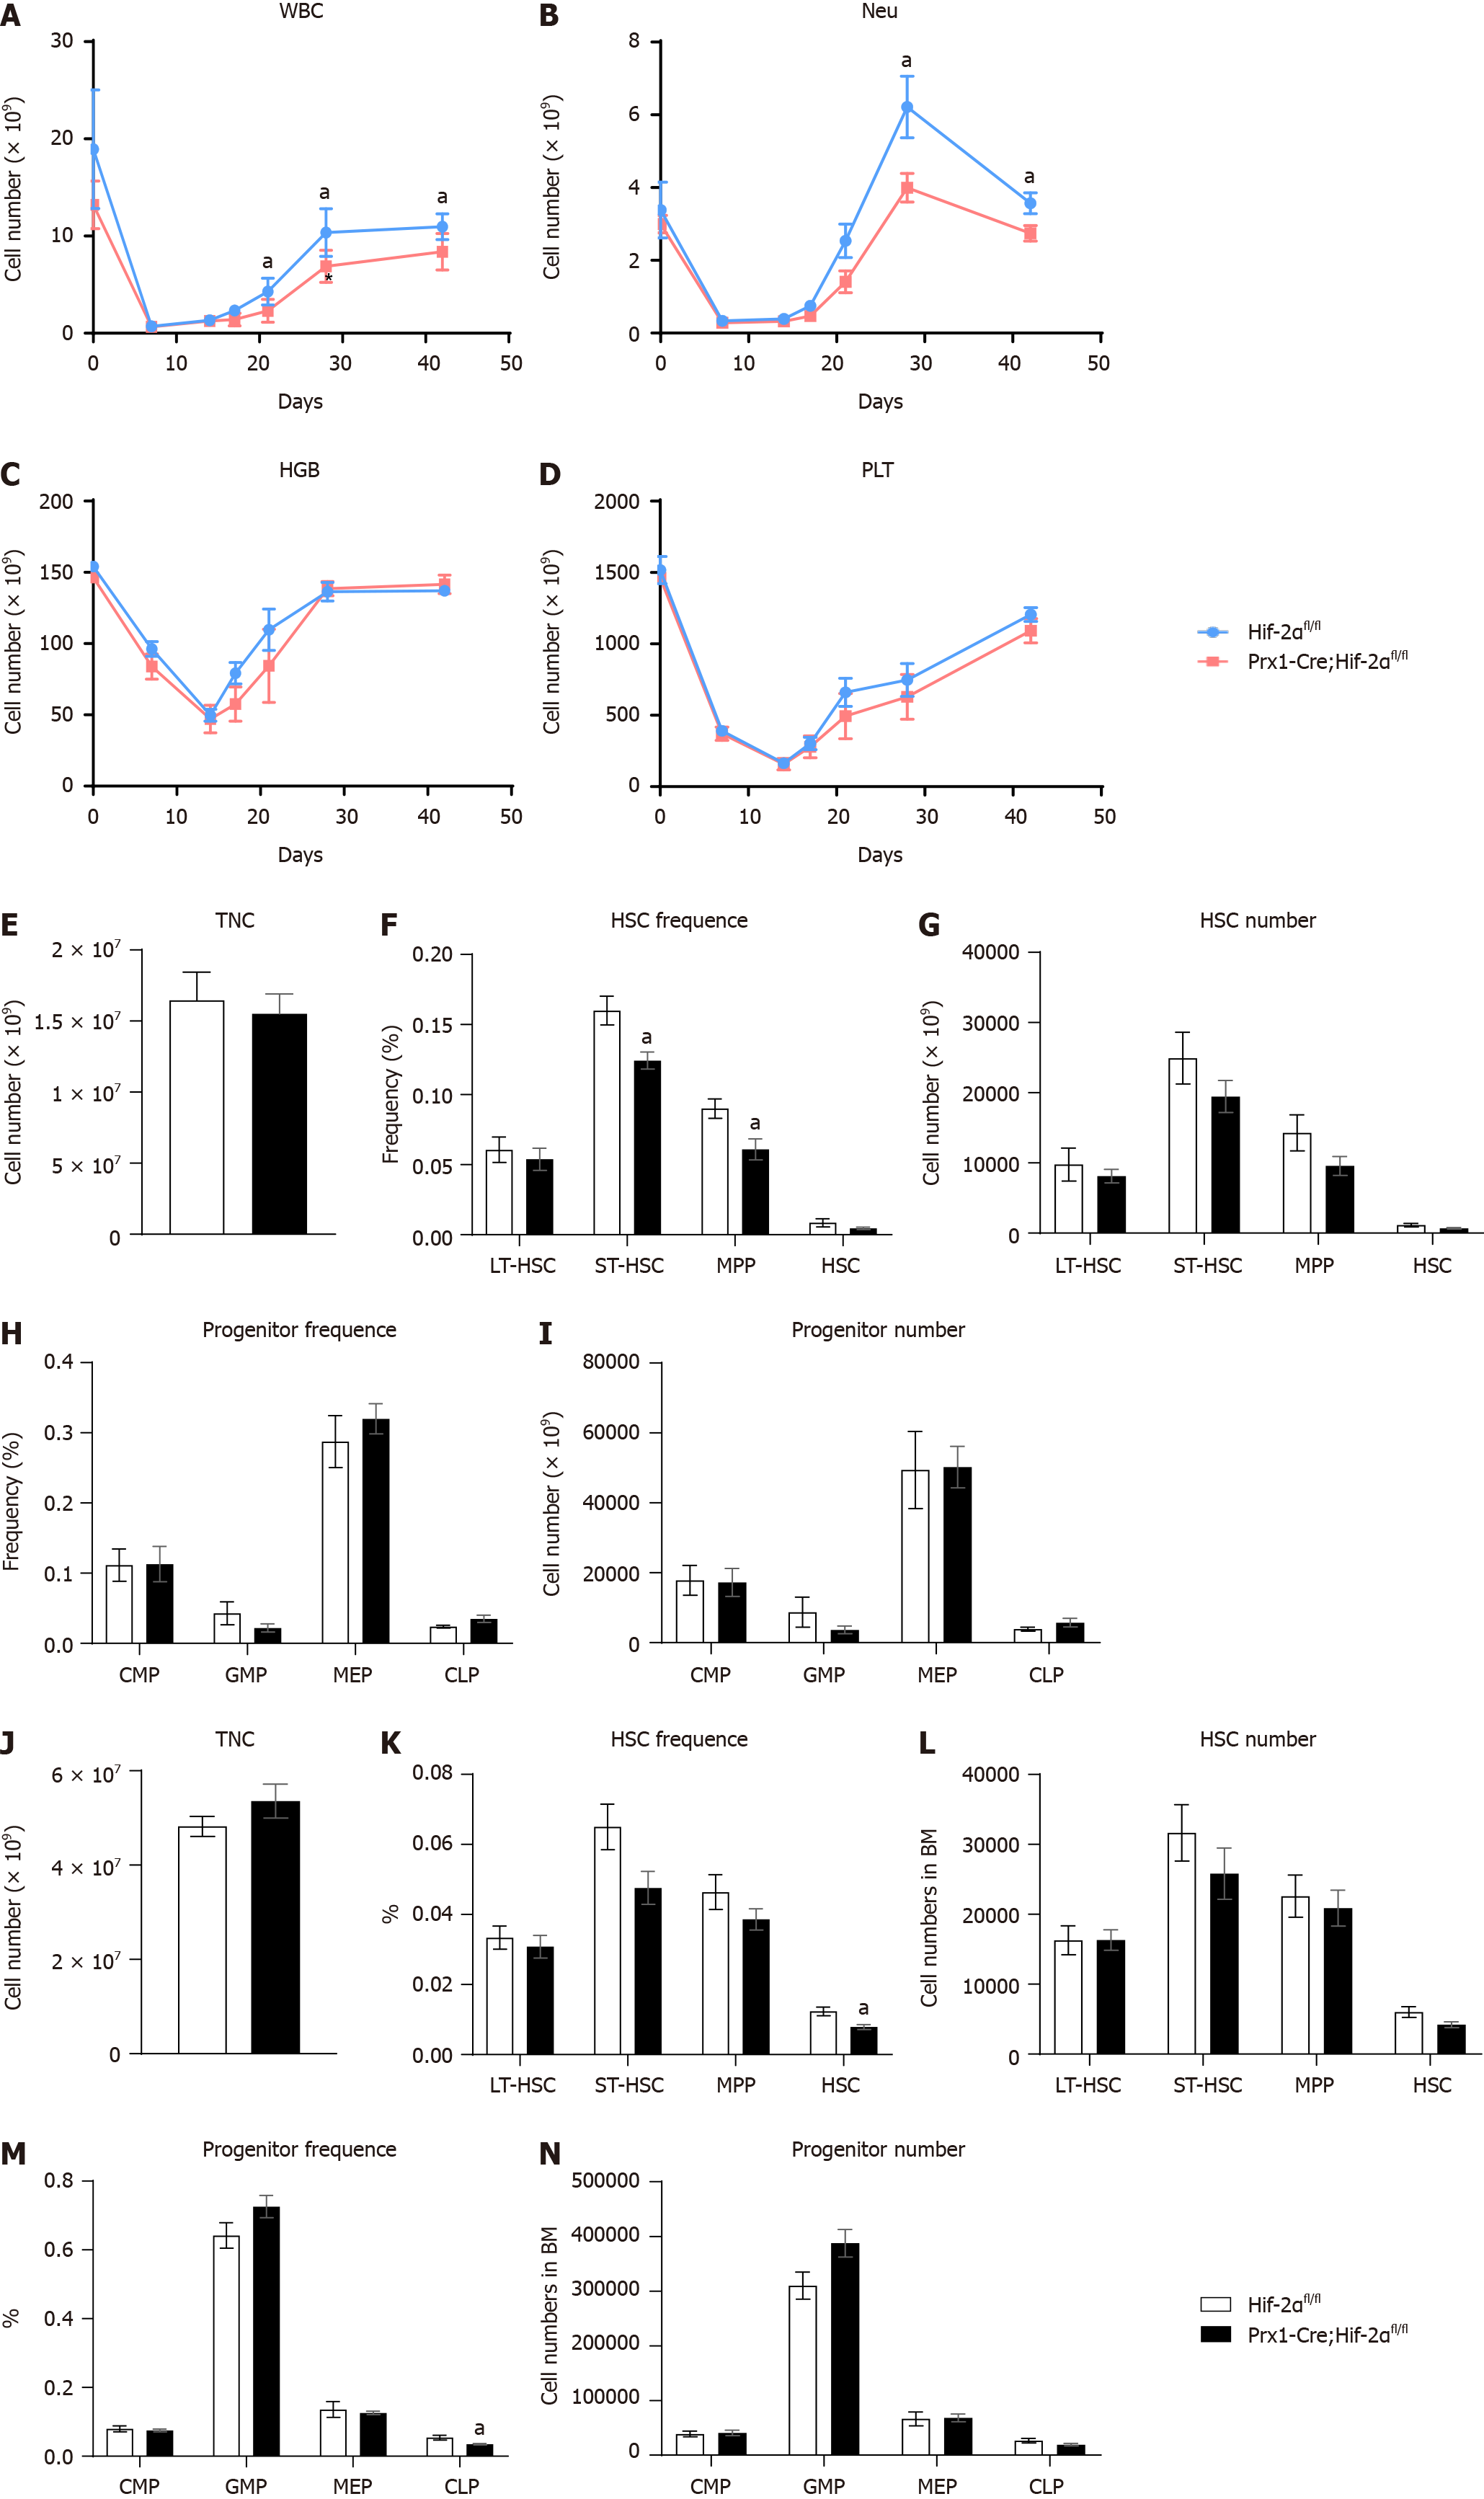
Figure 5 Adult Prx1-Cre;Hif-2αfl/fl and Hif-2αfl/fl mice exhibit normal hematopoiesis under different stimulation conditions.
A-I: Eight-week-old Prx1-Cre;Hif-2αfl/fl and Hif-2αfl/fl mice were subjected to semilethal irradiation. The white blood cell count (A), red blood cell count (B), hemoglobin content (C) and platelet count (D) in peripheral blood were determined. Four weeks after semilethal irradiation, bone marrow (BM) cells freshly harvested from 8-wk-old Prx1-Cre;Hif-2αfl/fl and Hif-2αfl/fl mice were assayed by multiparameter fluorescence-activated cell sorting (FACS) analyses to determine the total nucleated cell (TNC) numbers (E), frequencies of hematopoietic stem cells (HSCs) (F), HSC numbers (G), frequencies of progenitors (H), and progenitor numbers (I); 8-wk-old Prx1-Cre;Hif-2αfl/fl and Hif-2αfl/fl mice were treated with 5-fluorouracil (5-FU); J-N: Four weeks after the 5-FU treatment regimen, BM cells freshly harvested from 8-wk-old Prx1-Cre;Hif-2αfl/fl and Hif-2αfl/fl mice were assayed via multiparameter FACS analyses to determine the TNC numbers (J), frequencies of HSCs (K), HSC numbers (L), frequencies of progenitors (M), and progenitor numbers (N). aP < 0.05. WBC: White blood cell; NEU: Neutrophil; HGB: Hemoglobin; PLT: Platelet; TNC: Total nucleated cell; HSC: Hematopoietic stem cell; LT-HSC: Long-term hematopoietic stem cell; ST-HSC: Short-term hematopoietic stem cell; MPP: Multipotent progenitor; CMP: Common myeloid progenitor; GMP: Granulocyte-monocyte progenitor; MEP: Megakaryocyte-erythroid progenitor; CLP: Common lymphoid progenitor; HIF-2α: Hypoxia-inducible factor 2alpha.
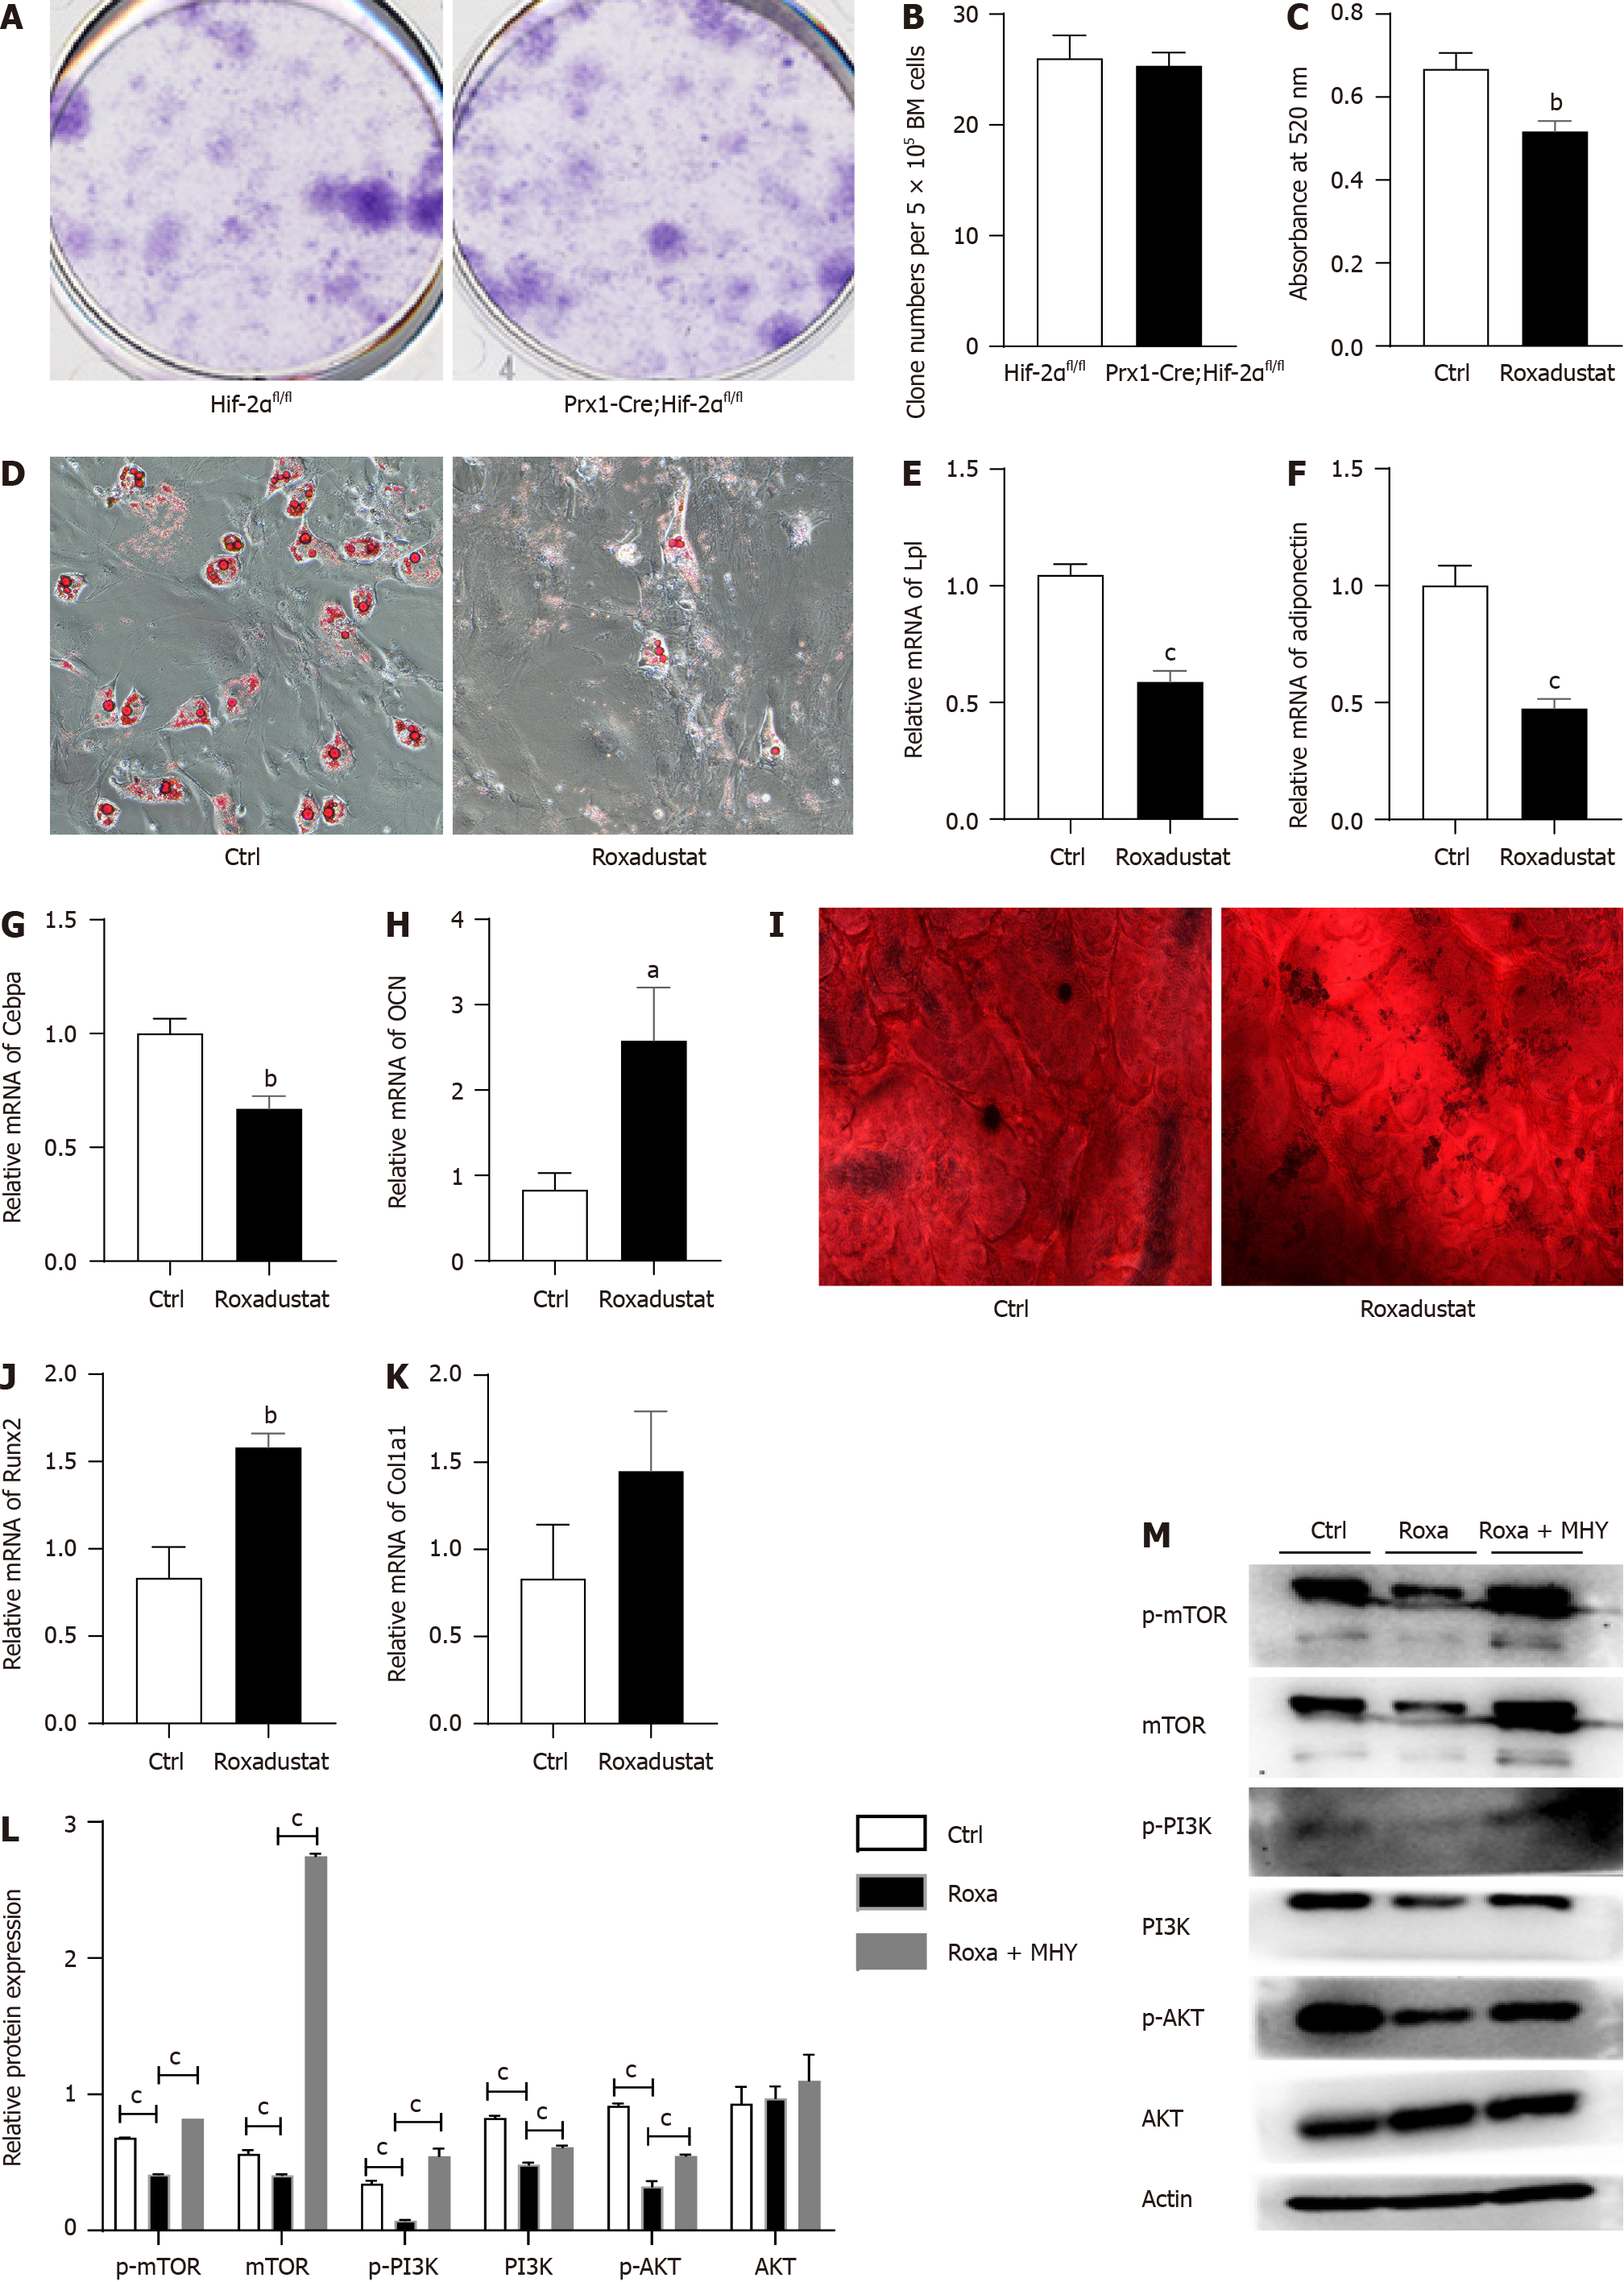
Figure 6 Treatment with the hypoxia-inducible factor 2alpha agonist roxadustat increases osteogenesis and decreases adipogenesis.
A: Representative images of the fibroblast colony-forming unit (CFU-F) assay with Prx1-Cre;Hif-2αfl/fl and Hif-2αfl/fl mice are shown; B: Quantification of CFU-Fs formed by bone mesenchymal stem cells (BMSCs) from Prx1-Cre;Hif-2αfl/fl and Hif-2αfl/fl mice are shown; C and D: Hif-2αfl/fl mouse BMSCs were cultured with or without roxadustat. In the adipogenic differentiation assay, Oil red O staining was performed after seven days (D); quantification of Oil Red O staining in BMSCs after induction of adipogenic differentiation (C); E-M: Relative mRNA levels of the adipogenesis-related genes Lpl (E), Adiponectin (F) and Cebpa (G) in BMSCs after 7 d of adipogenic differentiation. In the osteogenic differentiation assay, Alizarin red staining was performed after 14 d to quantify osteoblast mineralization (I). Relative mRNA levels of the osteogenesis-related genes OCN (H), Runx2 (J) and Col1α1 (K) in BMSCs after 14 d of osteogenic differentiation. Adipogenic differentiation was induced in BMSCs by treatment with roxadustat and MHY1485 for 7 d. The levels of the mechanistic target of rapamycin (mTOR) and PI3K/AKT signaling pathway proteins were measured via western blotting in the Ctrl, roxadustat and Roxadustat + MHY1485 groups (M). Quantification of the relative levels of the mTOR, PI3K and AKT proteins (L). The phosphorylated protein levels were normalized to the corresponding total protein levels. aP < 0.05, bP < 0.01, cP < 0.001. Roxa: Roxadustat; MHY: MHY1485; HIF-2α: Hypoxia-inducible factor 2alpha; mTOR: Mechanistic target of rapamycin.
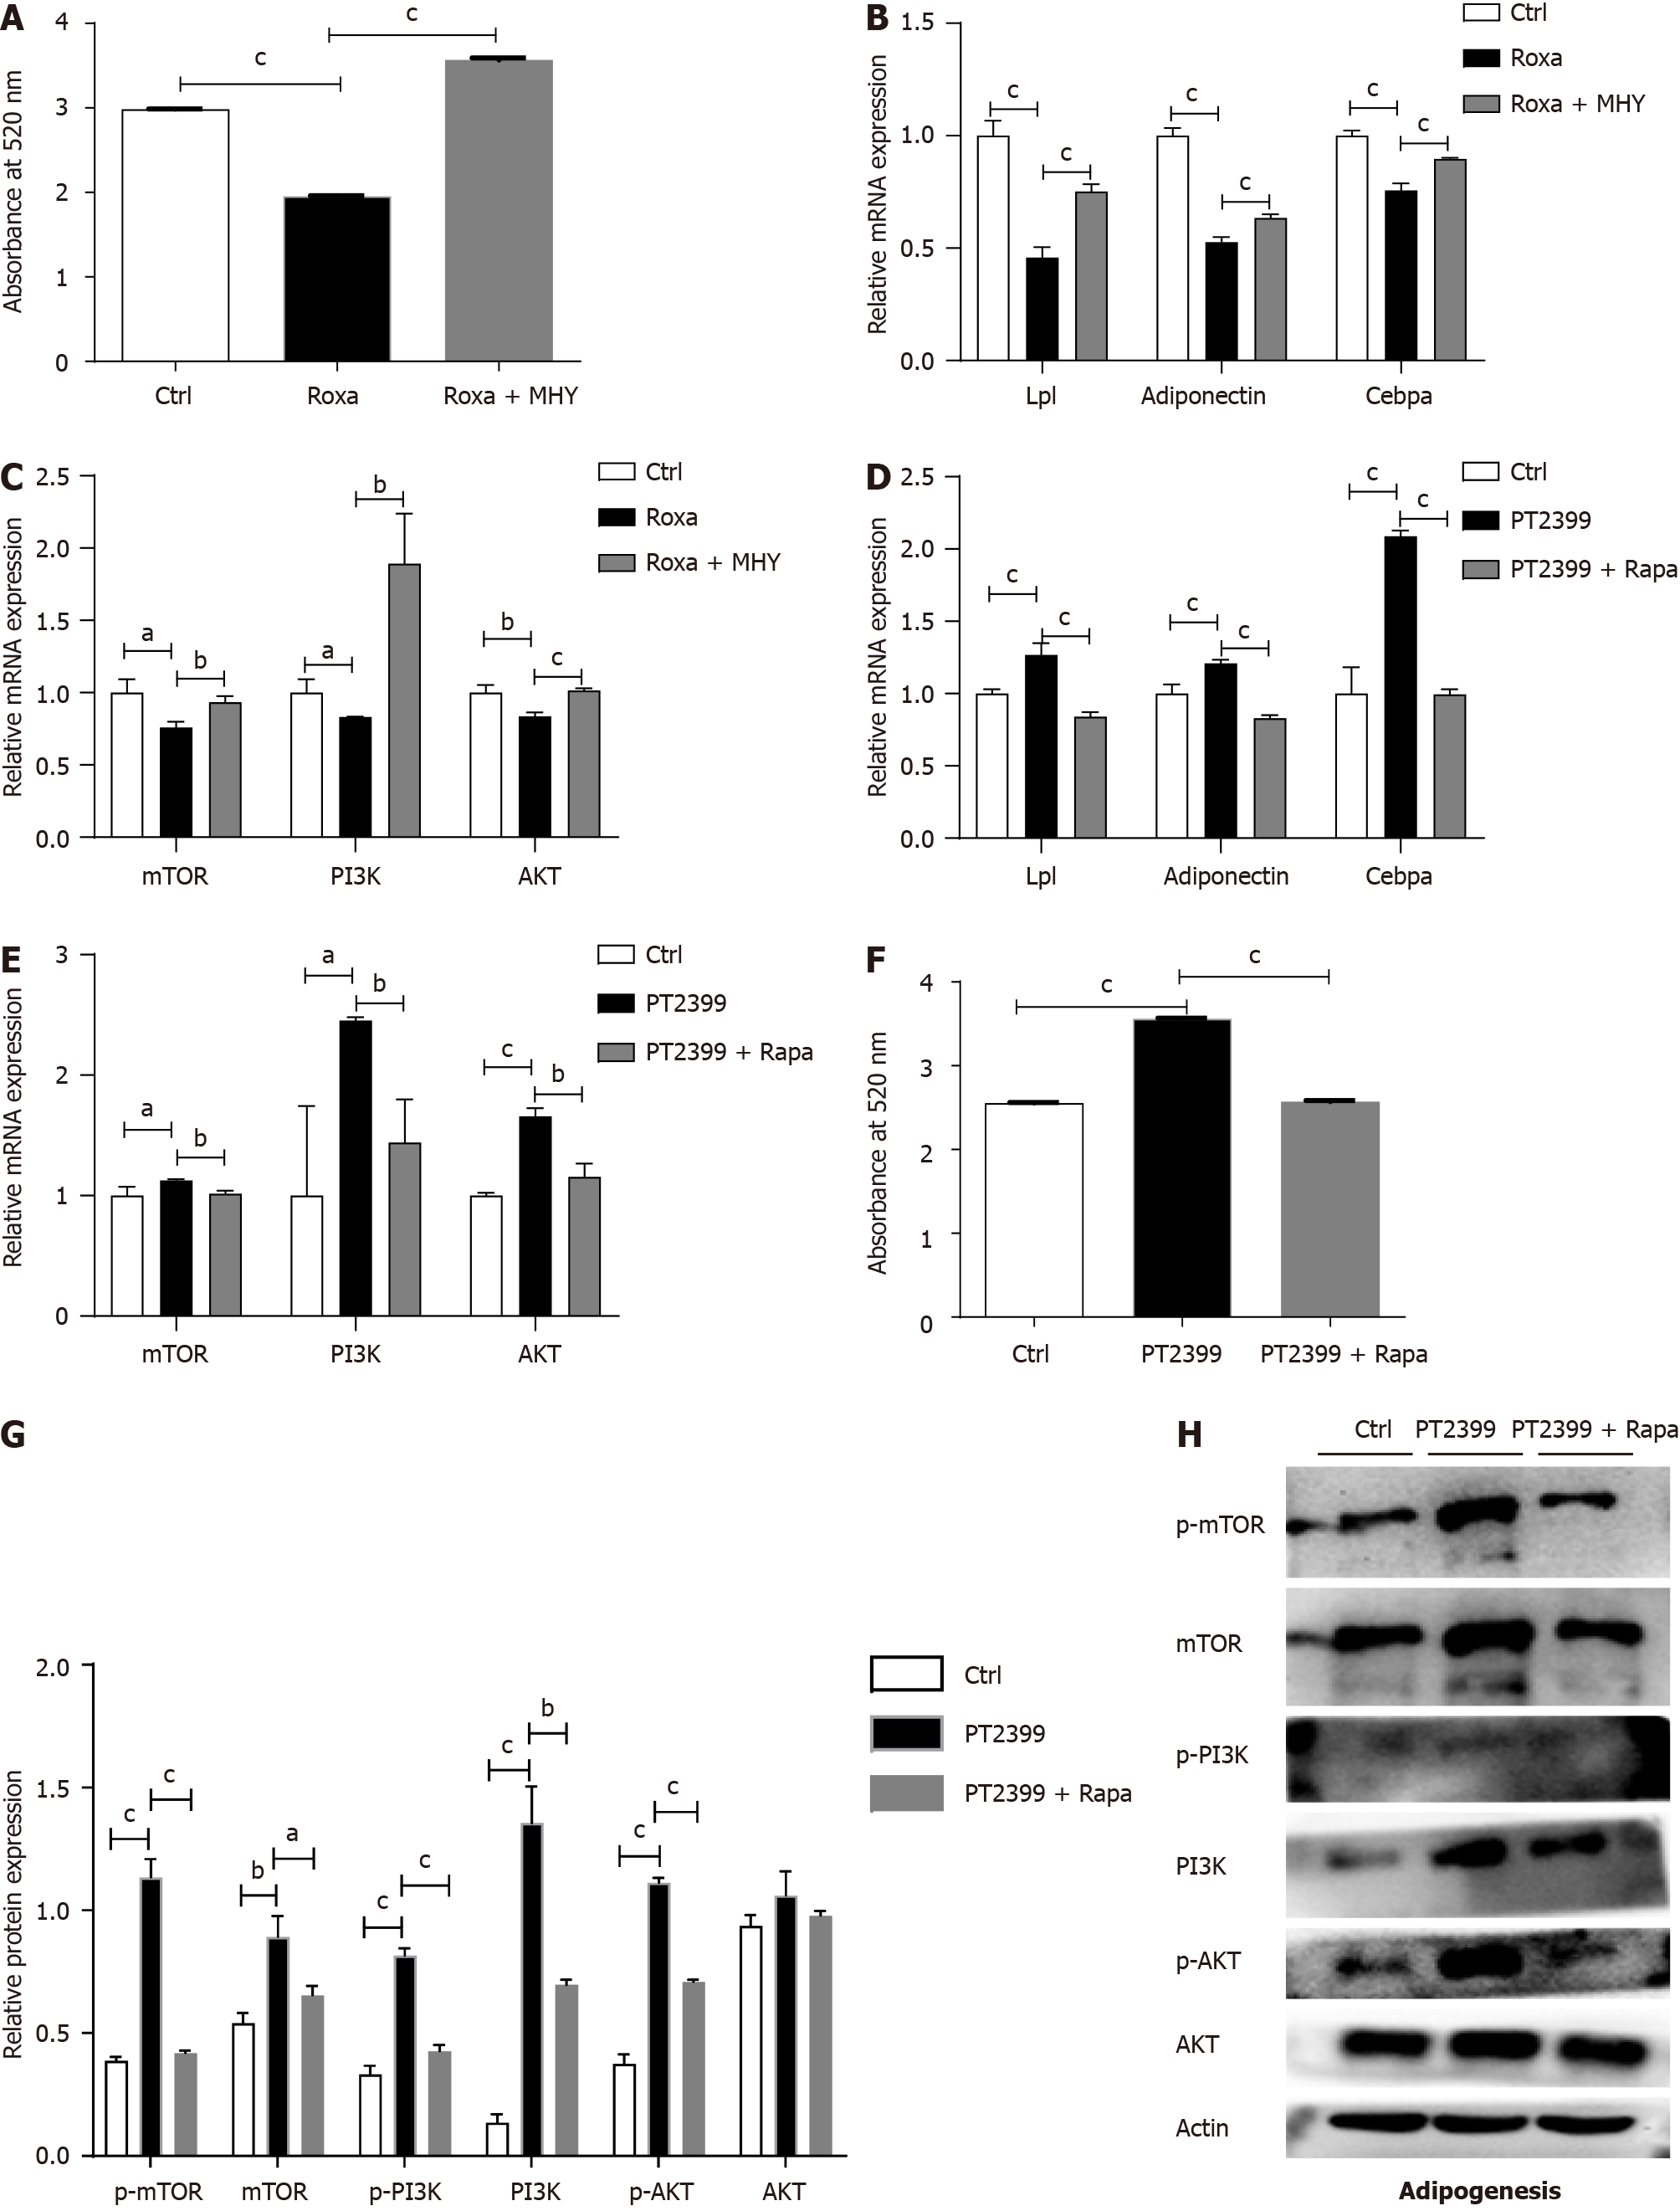
Figure 7 Hypoxia-inducible factor 2alpha decreases bone mesenchymal stem cell adipogenic differentiation by inhibiting mechanistic target of rapamycin and PI3K/AKT signaling.
Adipogenic differentiation was induced in Hif-2αfl/fl bone mesenchymal stem cells (BMSCs) by treatment with roxadustat and MHY1485 for 7 d. A: Quantification of Oil Red O staining in BMSCs after induction of adipogenic differentiation; B: Relative mRNA expression levels of the adipogenesis-related genes Lpl, Adiponectin and Cebpα in BMSCs during adipogenic differentiation; C-G:: Relative mRNA expression levels of the mechanistic target of rapamycin (mTOR) signaling-related genes mTOR, PI3K and AKT in BMSCs during adipogenic differentiation (C) Adipogenic differentiation was induced in BMSCs by treatment with 10 μM PT2399 and 100 nM rapamycin for 7 d; quantification of Oil Red O staining in BMSCs after induction of adipogenic differentiation (F); relative mRNA expression levels of adipogenesis-related genes in BMSCs with induction of osteogenic differentiation with PT2399 and the mTOR inhibitor rapamycin (D). Relative mRNA expression levels of mTOR signaling-related genes in BMSCs with induction of adipogenic differentiation with PT2399 and rapamycin (E). Protein levels were measured by western blotting in the PT2399 and PT2399 + rapamycin groups (H). Quantification of the relative p-mTOR, mTOR, p-PI3K, PI3K, p-AKT and AKT levels. The phosphorylated protein levels were normalized to the corresponding total protein levels (G). aP < 0.05, bP < 0.01, cP < 0.001. Roxa: roxadustat, MHY: MHY1485, Rapa: Rapamycin; mTOR: Mechanistic target of rapamycin.
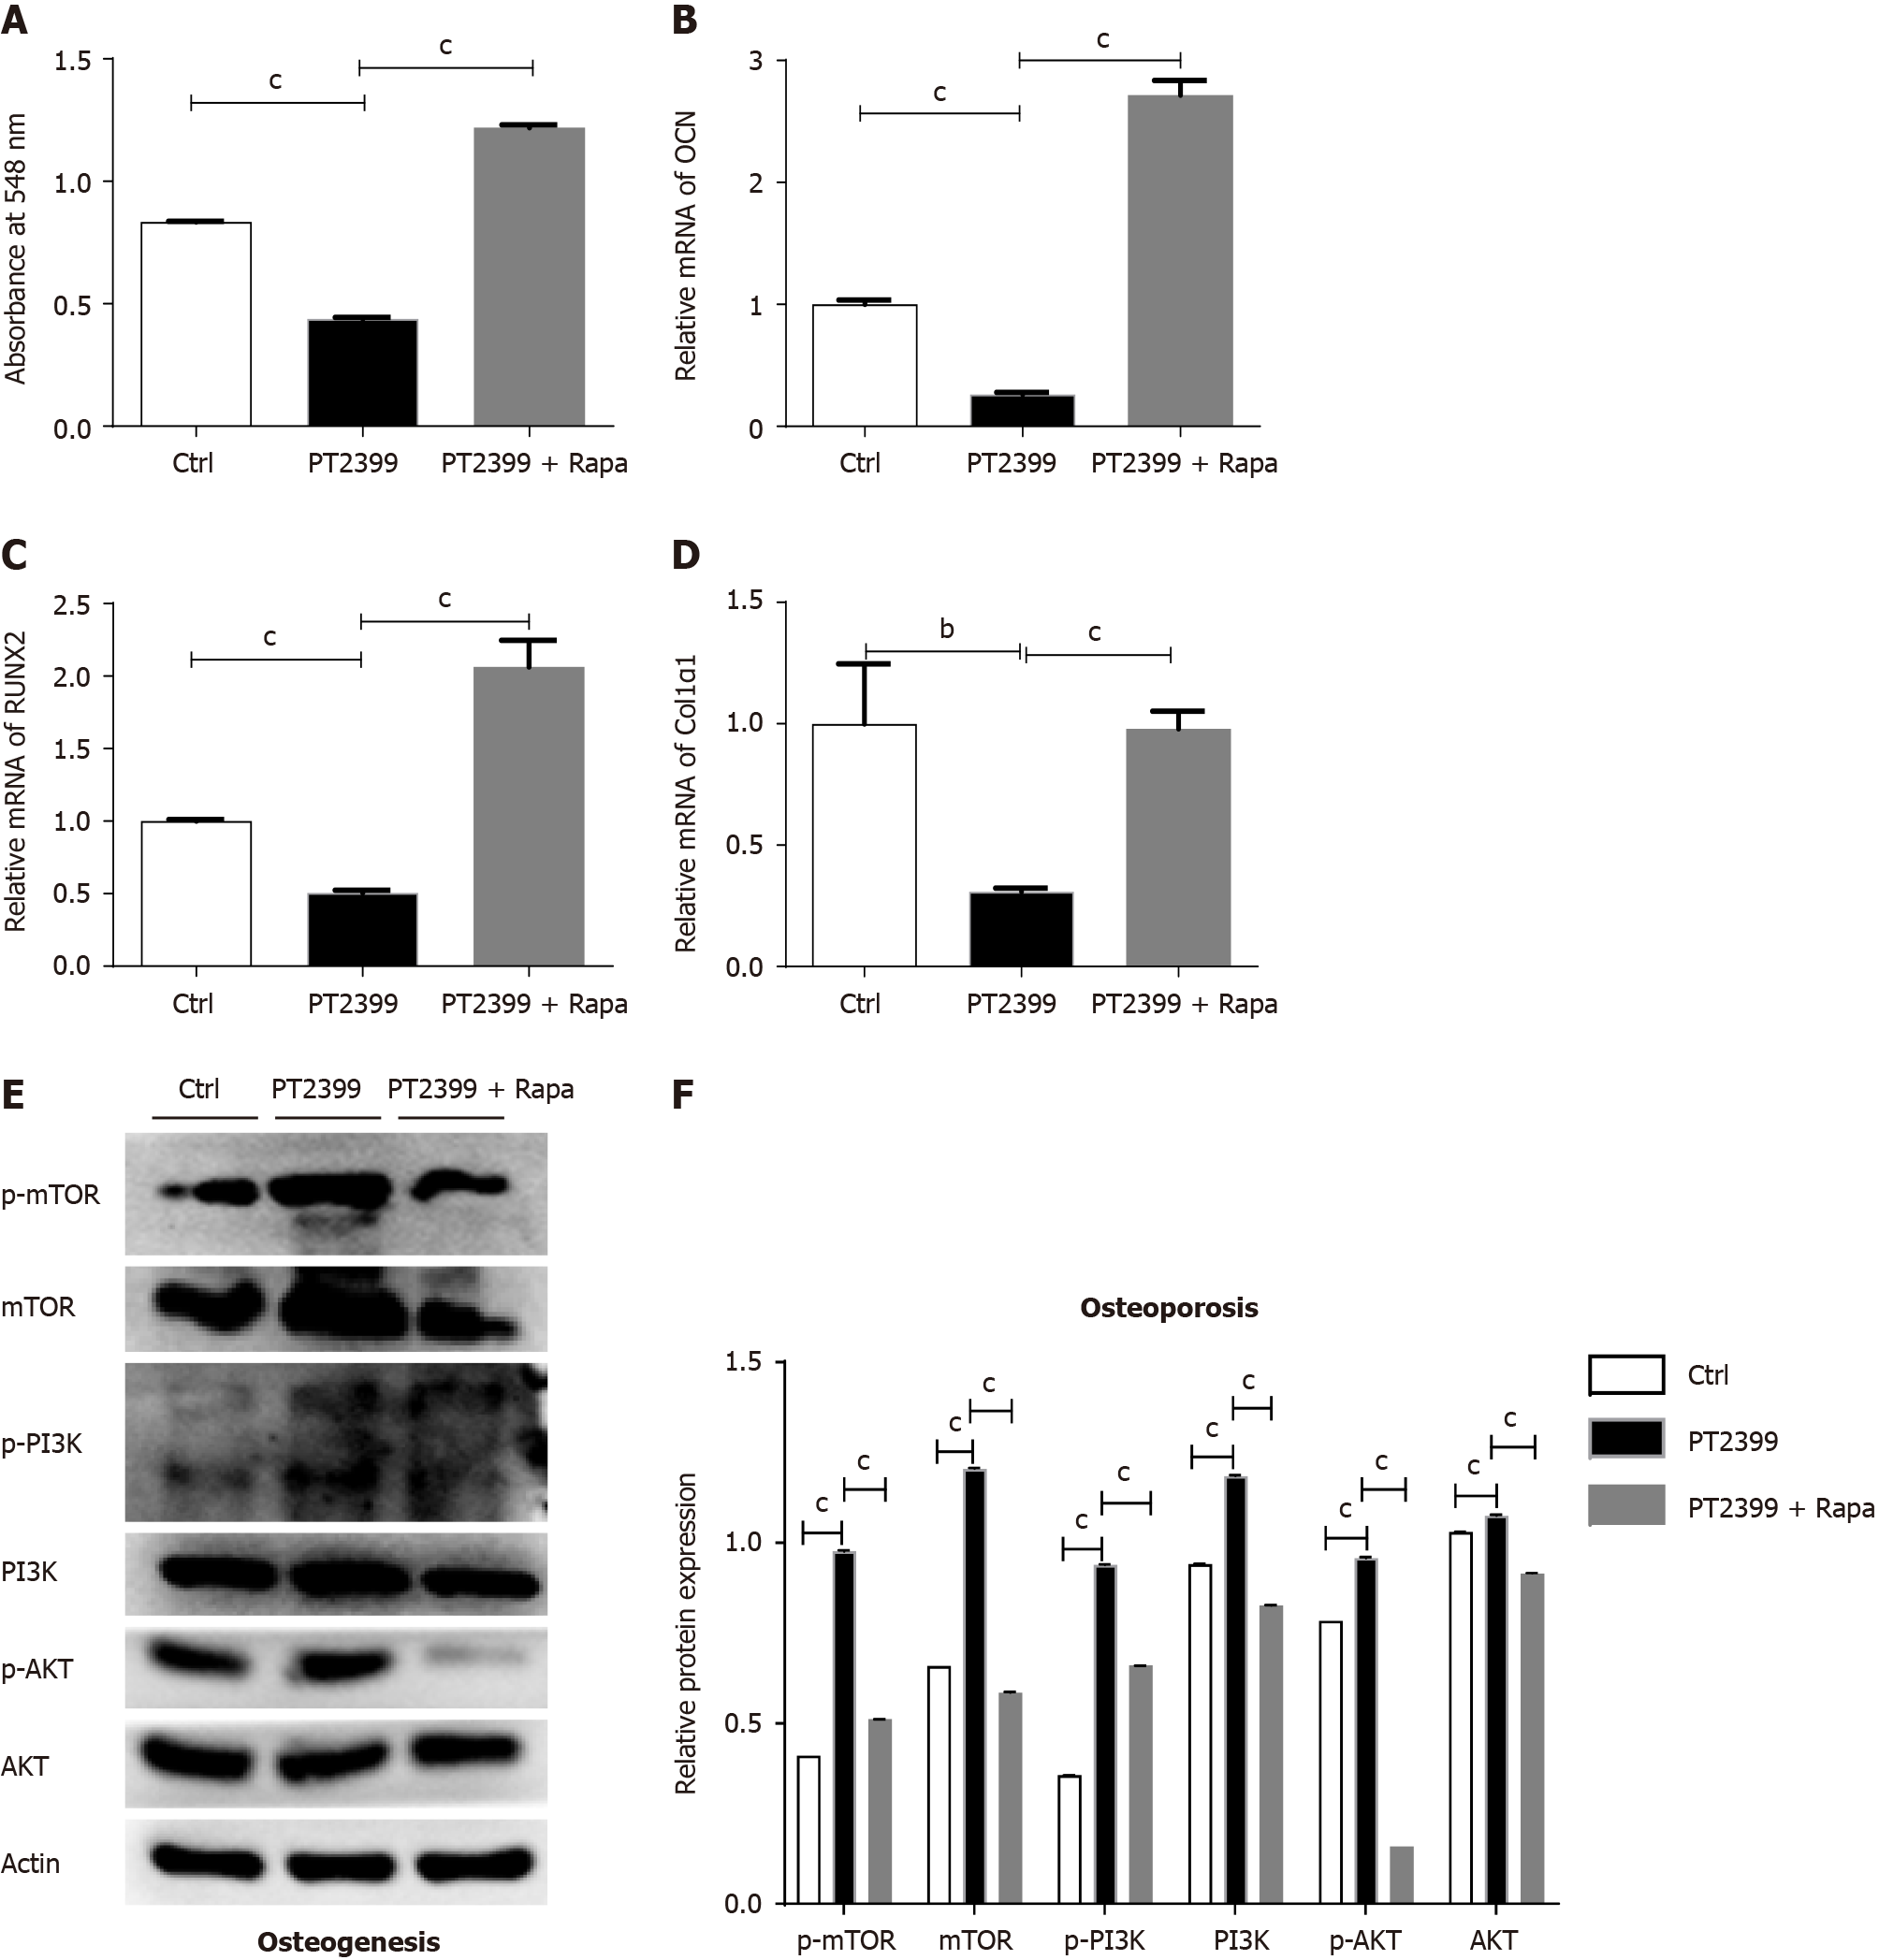
Figure 8 The mechanistic target of rapamycin inhibitor rapamycin rescued the decrease in the osteogenic differentiation of bone mesenchymal stem cells induced by the hypoxia-inducible factor 2alpha inhibitor PT2399.
A-F: Osteogenic differentiation was induced in Hif-2αfl/fl bone mesenchymal stem cells (BMSCs) by treatment with 10 μM PT2399 and 100 nM rapamycin for 14 d: Quantification of alizarin red staining in BMSCs after induction of osteogenic differentiation (A); relative mRNA expression levels of the osteogenesis-related genes OCN (B), RUNX2 (C) and Col1α1 (D) in BMSCs cells with induction of osteogenic differentiation with PT2399 and the mechanistic target of rapamycin (mTOR) inhibitor rapamycin. Protein levels were measured by western blotting in the PT2399 and PT2399 + rapamycin groups (E). Quantification of the relative p-mTOR, mTOR, p-PI3K, PI3K, p-AKT and AKT levels (F). The phosphorylated protein levels were normalized to the corresponding total protein levels. bP < 0.01, cP < 0.001. Rapa: Rapamycin; mTOR: Mechanistic target of rapamycin.
- Citation: Wang LL, Lu ZJ, Luo SK, Li Y, Yang Z, Lu HY. Unveiling the role of hypoxia-inducible factor 2alpha in osteoporosis: Implications for bone health. World J Stem Cells 2024; 16(4): 389-409
- URL: https://www.wjgnet.com/1948-0210/full/v16/i4/389.htm
- DOI: https://dx.doi.org/10.4252/wjsc.v16.i4.389


