©The Author(s) 2023.
World J Stem Cells. Sep 26, 2023; 15(9): 931-946
Published online Sep 26, 2023. doi: 10.4252/wjsc.v15.i9.931
Published online Sep 26, 2023. doi: 10.4252/wjsc.v15.i9.931
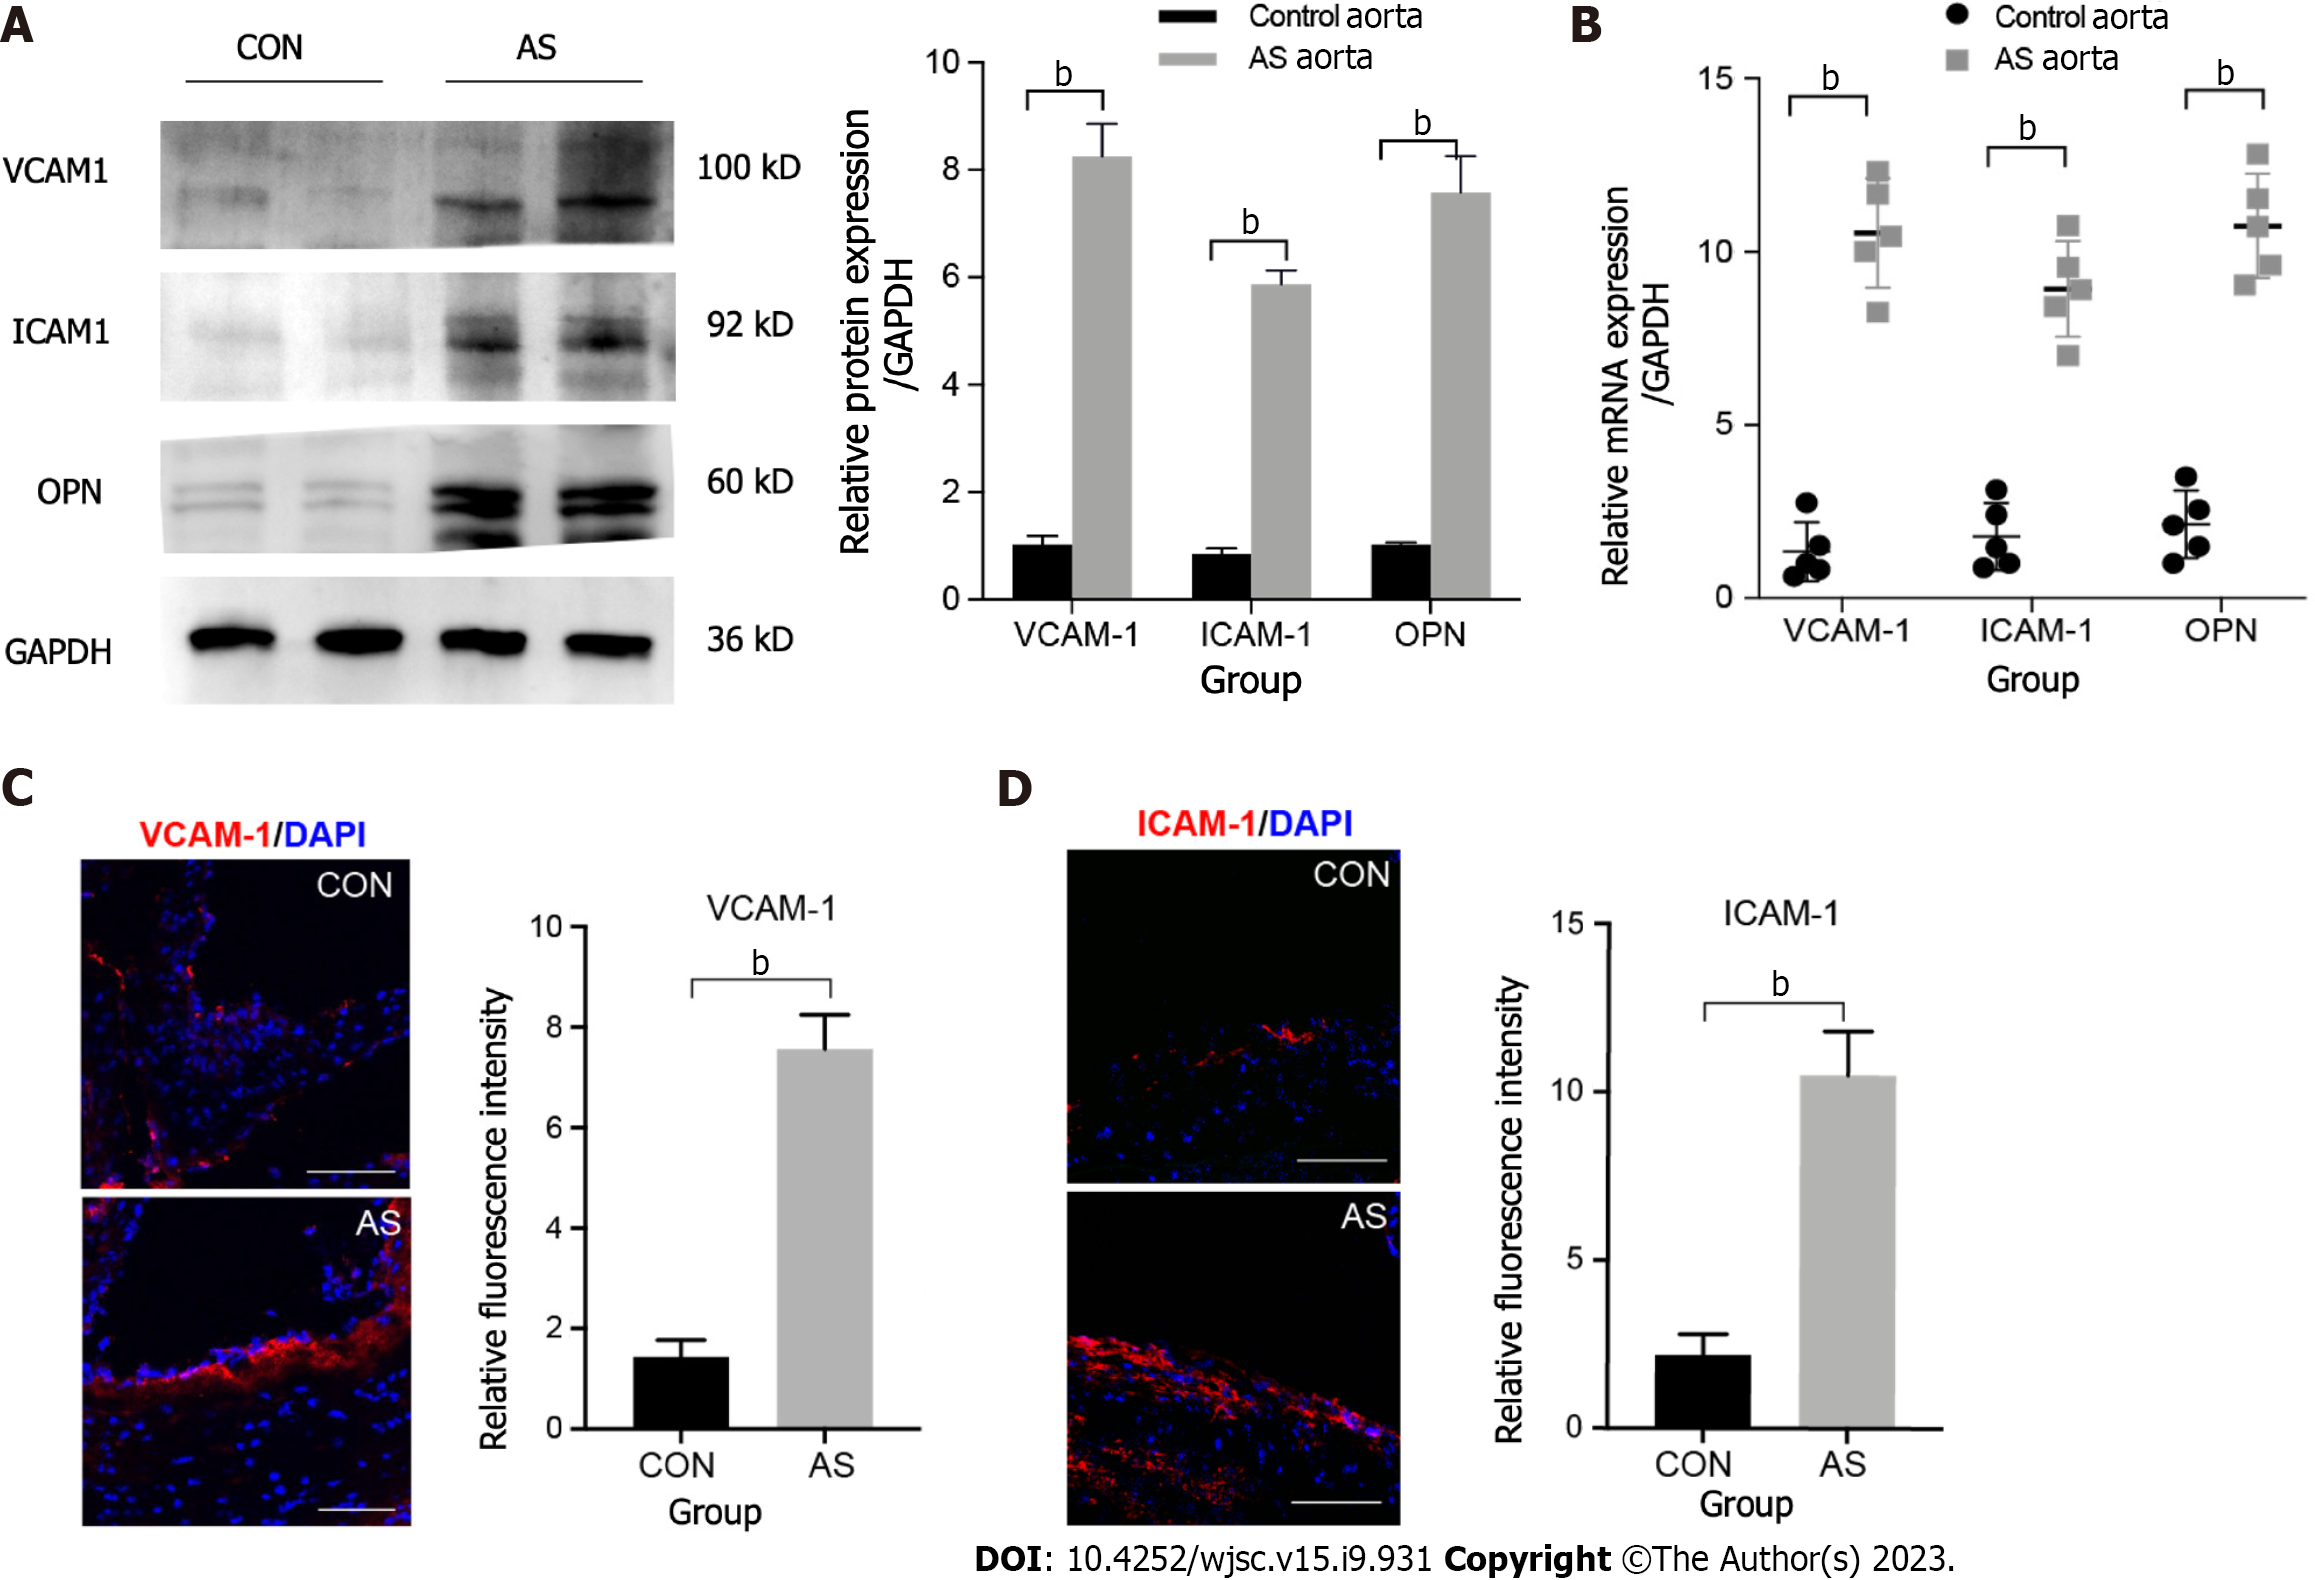
Figure 1 Expression of inflammatory factors in the vascular atherosclerotic plaque.
A: Expression of mouse vascular cell adhesion molecule-1 (VCAM-1), intercellular cell adhesion molecule-1 (ICAM-1), and osteopontin (OPN) expression in total tissue lysates of normal and atherosclerotic (AS) aorta analyzed using western blot. GAPDH was used as the internal control. The experiment was repeated thrice with tissues isolated from independent mice; a representative blot is shown; B: Expression levels of various inflammatory factors involved in atherosclerosis analyzed using quantitative real-time polymerase chain reaction of mRNA samples extracted from normal and AS vessels of three independent mice. Data are presented as the mean ± SEM for each group. Fold change represents the expression of each inflammatory factor in AS vessel of a mice fed with high fat diet for 12 wk compared with that in normal blood vessel; C: Representative images of normal and AS vascular sections stained for VCAM1 (red) and ICAM1 (red). The experiment was repeated three times with tissues isolated from independent mice; a representative image is shown. Nuclei were visualized by DAPI staining (blue). Scale bars = 100 mm; D: Representative images of normal and AS vascular sections stained for ICAM1 (red). The experiment was repeated three times with tissues isolated from independent mice; a representative image is shown. Nuclei were visualized by DAPI staining (blue). Scale bars = 100 μm. bP < 0.001. AS: Atherosclerotic; OPN: Osteopontin; qRT-PCR: Quantitative real-time polymerase chain reaction; SEM: Standard error of the mean; VCAM-1: Vascular cell adhesion molecule-1; ICAM-1: Intercellular cell adhesion molecule-1.
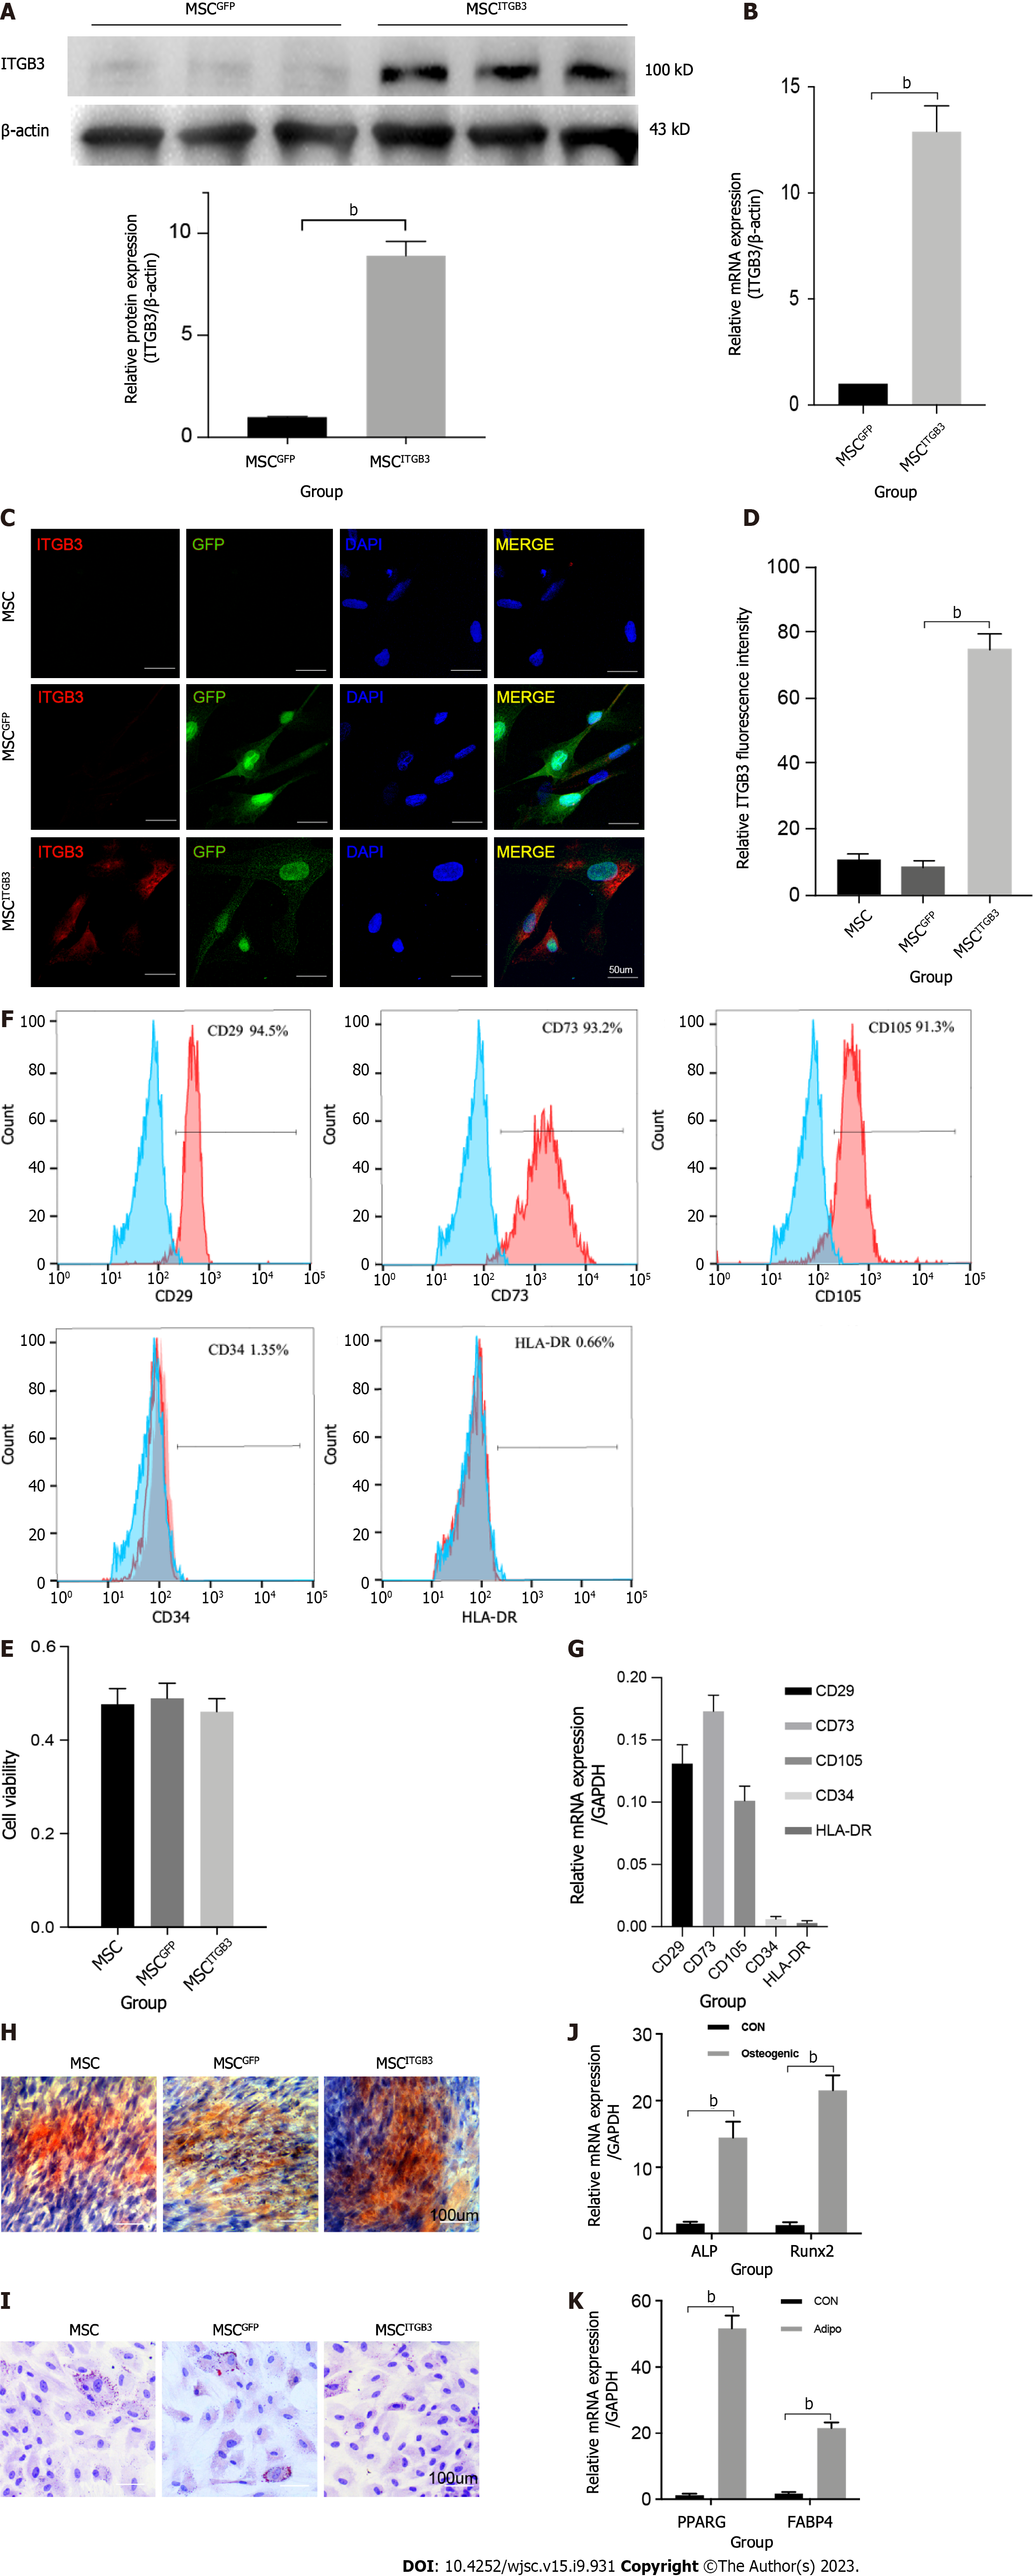
Figure 2 Expression of integrin subunit beta 3 on human umbilical cord-derived mesenchymal stem cells.
A: Western blot; B: Quantitative real-time polymerase chain reaction (qRT-PCR) analysis of Integrin subunit beta 3 (ITGB3) expression; C: Representative immunofluorescence image; D: Quantification of ITGB3 and green fluorescence protein staining in untransfected and transfected mesenchymal stem cells (MSCs); E: Cell viability of untransfected and transfected MSCs determined by CCK8 assay. The experiment was repeated three times; F and G: Analysis of cell surface markers on MSCITGB3 using flow cytometry to determine whether they have pluripotent characteristics; H: Osteogenic differentiation of MSCITGB3 identified using Alizarin red staining; I: Oil Red O staining shows differentiation of MSCITGB3 into adipocytes; J: qRT-PCR analysis of marker genes in induced osteoblasts; K: qRT-PCR analysis of marker genes in induced adipocyte. bP < 0.001. GFP: Green fluorescence protein; ITGB3: Integrin subunit beta 3; MSC: Mesenchymal stem cell; ORO: Oil Red O; qRT-PCR: Quantitative real-time polymerase chain reaction.
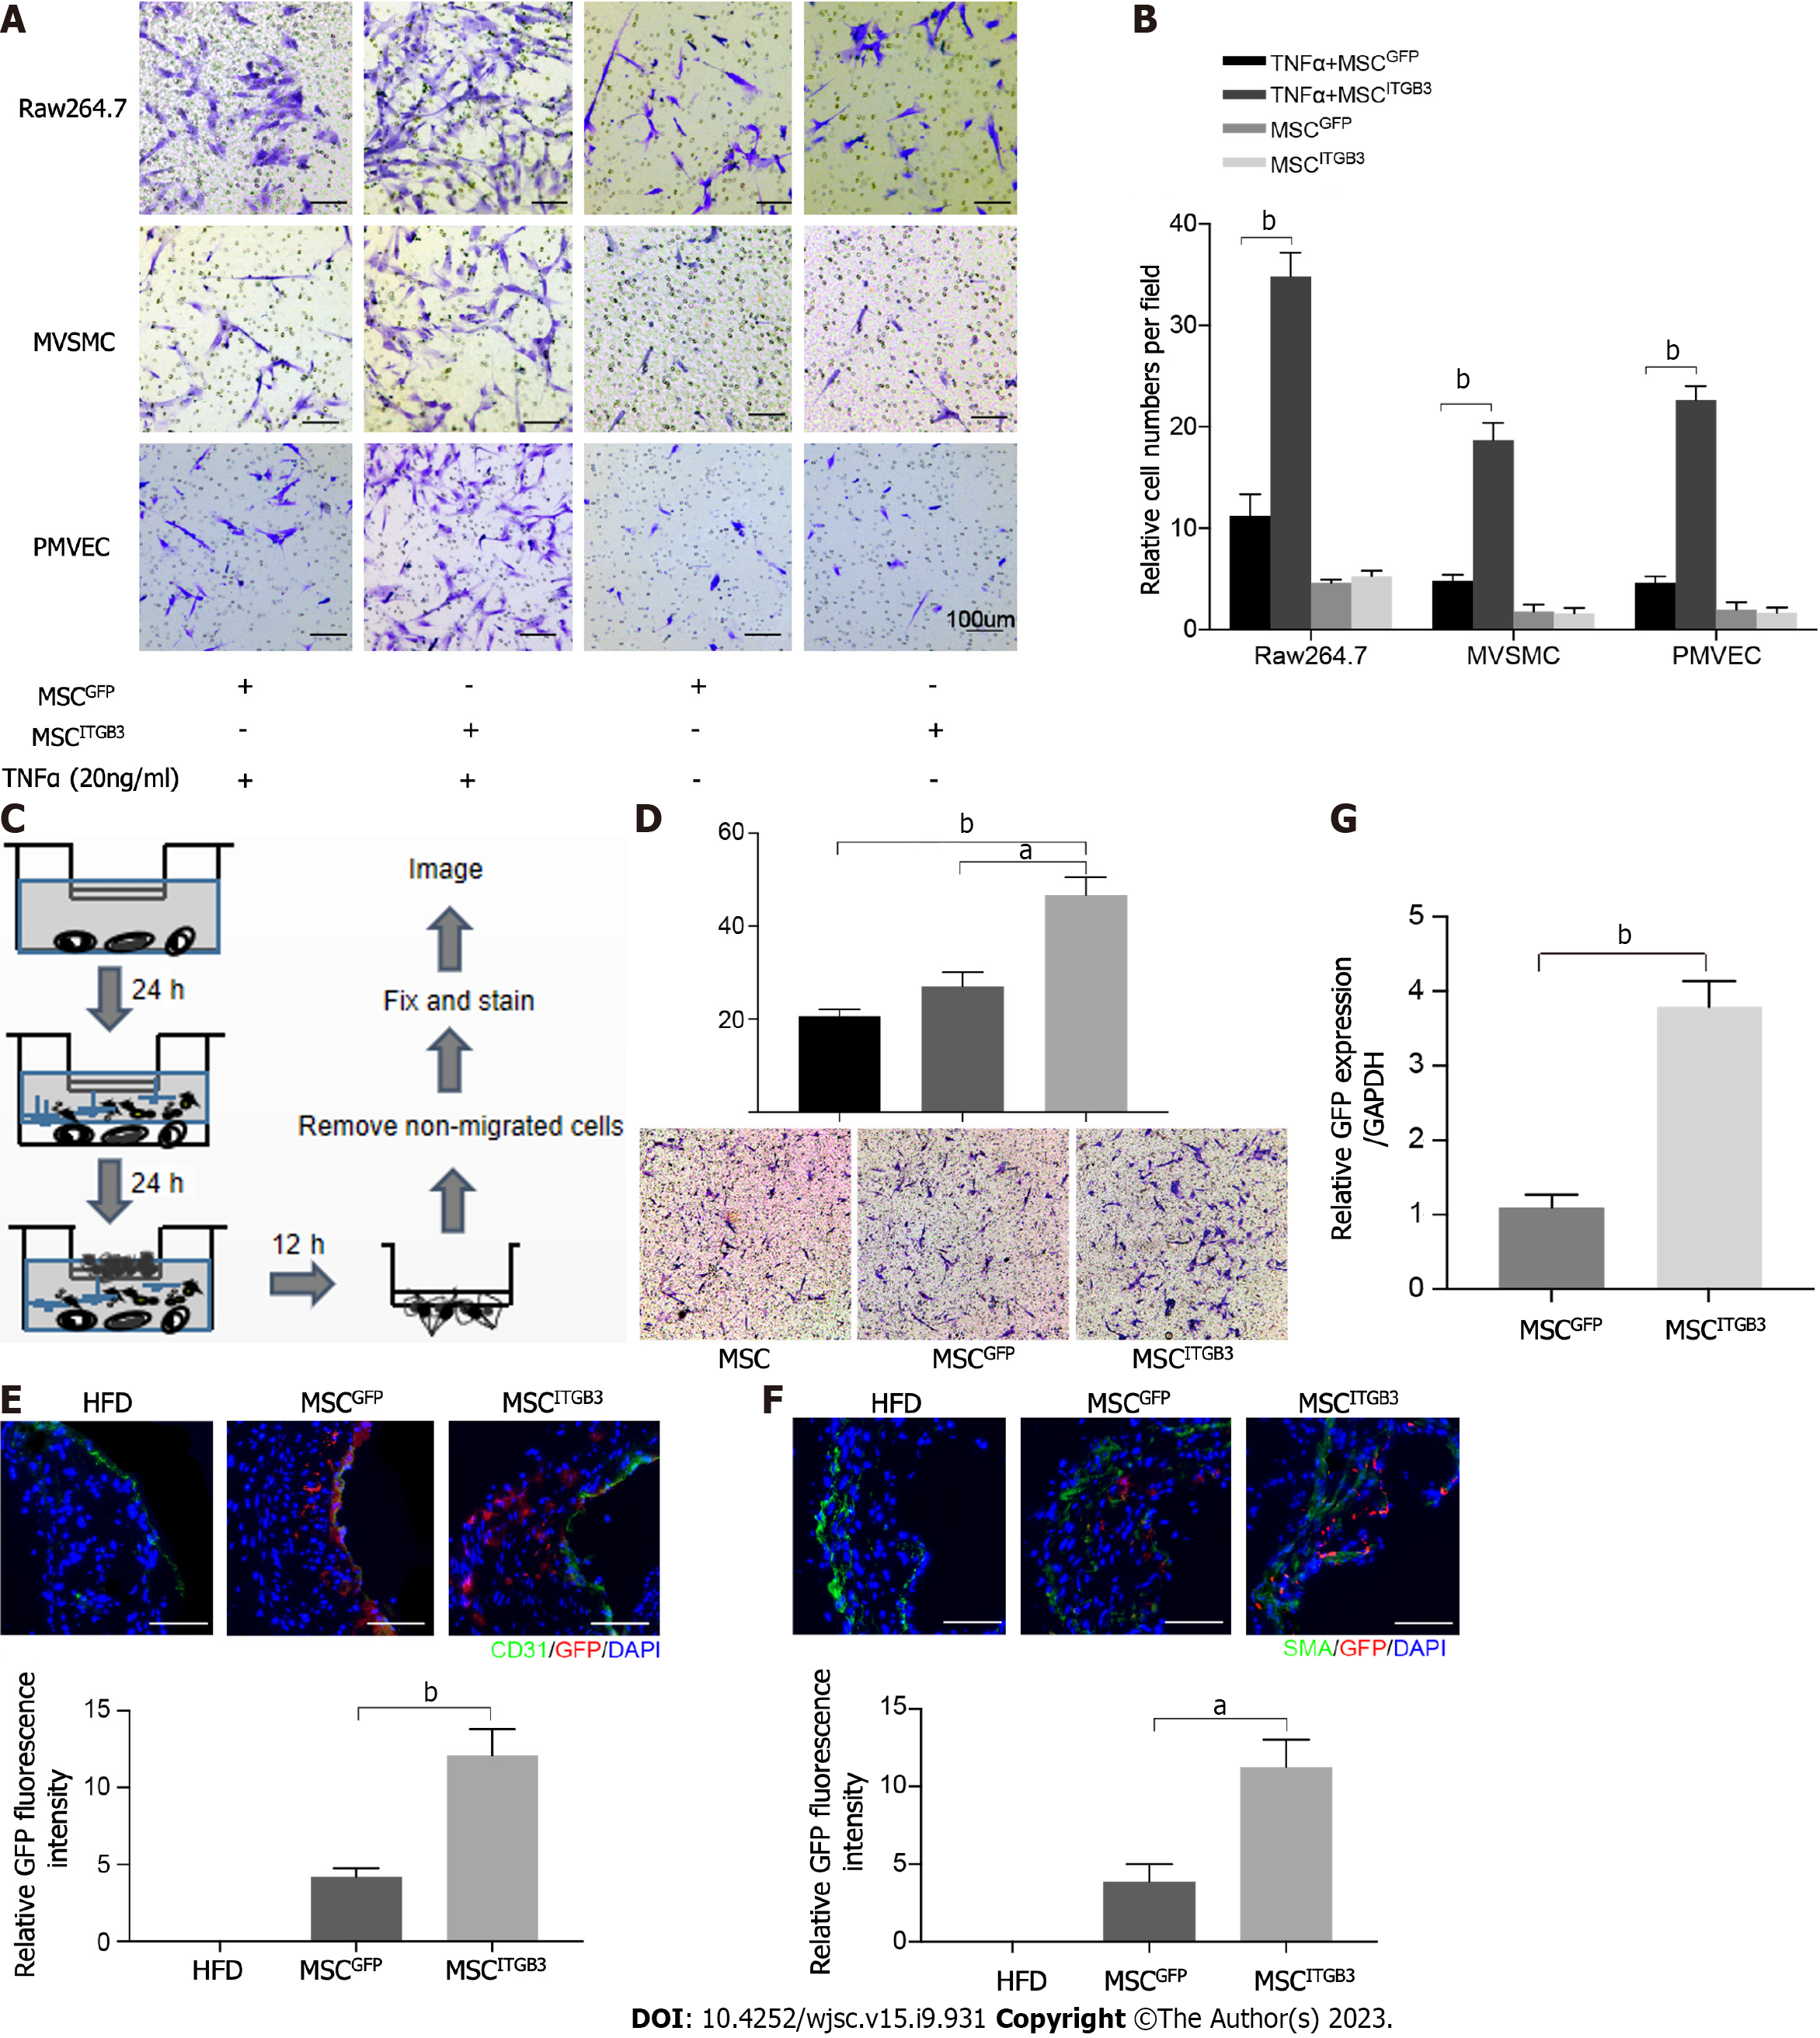
Figure 3 Integrin subunit beta 3 enhances mesenchymal stem cell migration in vitro and in vivo.
A: In vitro migration of integrin subunit beta 3 (ITGB3)-overexpressing mesenchymal stem cell (MSC) (MSCsITGB3) toward lower Raw264.7, MVSMC and PMVEC stimulated by tumor necrosis factor α. Scale bars = 100 μm; B: Quantification of migrated cells. Data are presented as the mean ± SEM; C: Experimental scheme of chemotactic assays with mouse atherosclerotic vascular samples. The blood vessel was divided into three parts. For each of the experiments, each part was cultured for 24 h in medium. To perform the assay, a suspension of 2 × 10⁵ MSCs, 2 × 10⁵ MSCsGFP, or 2 × 10⁵ MSCsITGB3 in medium were seeded in the upper chamber. Following incubation for 24 h, non-migrated cells were removed; D: Representative image and quantification of migrated cells stuck in the porous membrane or the lower layer of the transwell stained with 0.1% crystal violet; E: MSCsITGB3 and MSCsGFP, both expressing green fluorescence, were intravenously injected into mice. The expression of green fluorescent protein (GFP) and CD31 was examined by frozen staining. GFP-positive cells were quantified per microscopic field of vascular staining in triplicate mice; F: The expression of GFP and SMA were examined by frozen staining. GFP-positive cells were quantified per microscopic field of vascular staining in triplicate mice. Scale bars = 100 μm; G: Expression levels of GFP in atherosclerosis analyzed using quantitative real-time polymerase chain reaction of mRNA samples extracted from MSCGFP and MSCITGB3 vessels of three mice. Data are presented as the mean ± SEM for each group. The data are representative of three independent experiments. aP < 0.05, bP < 0.001. GFP: Green fluorescent protein; ITGB3: Integrin subunit beta 3; MSC: Mesenchymal stem cell; qRT-PCR: Quantitative real-time polymerase chain reaction; SEM: Standard error of the mea; TNF: Tumor necrosis factor.
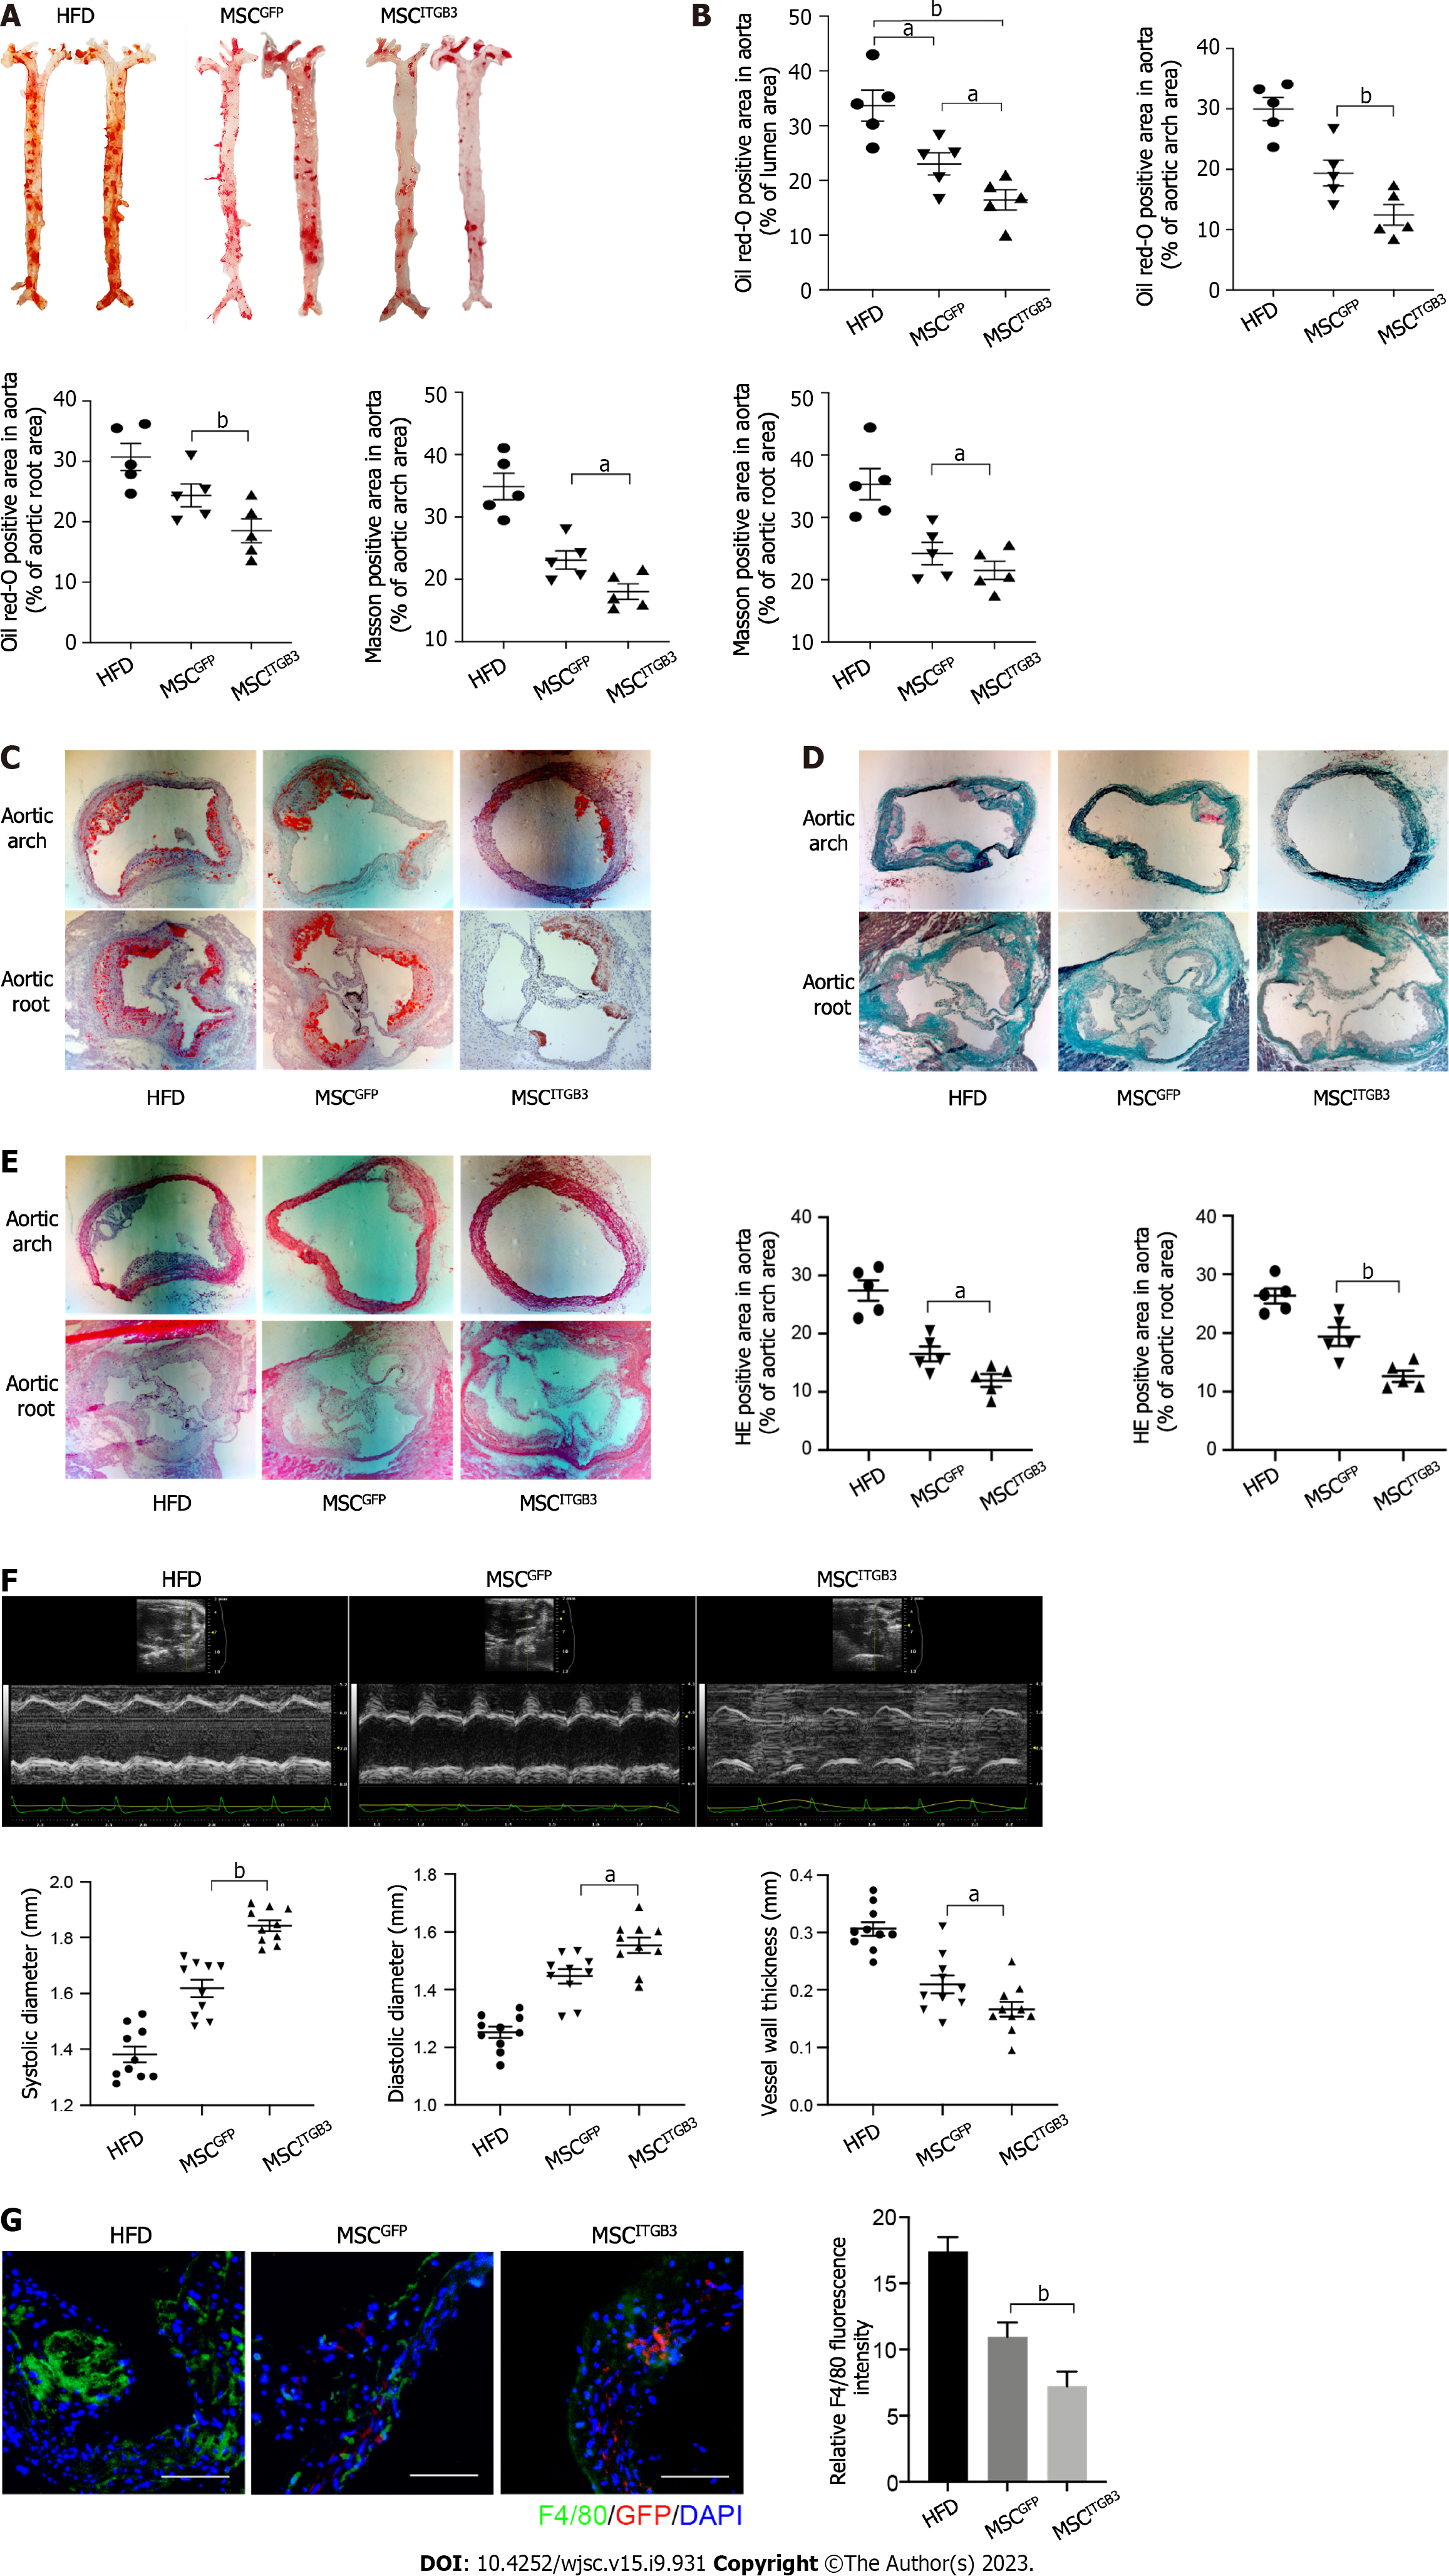
Figure 4 Injection of mesenchymal stem cellITGB3 attenuates atherosclerotic in vivo.
A: Representative en face images of mouse aortas stained with Oil Red O (ORO); B: Quantification of the atherosclerotic plaque area as a ratio of the stained area to the total area of the aorta; C: Representative section of mouse aortic arch and aortic root stained with ORO. The ORO-positive area in the aortic root is shown as the ratio of the stained area to the total area of the aortic sinus; D: Representative section of mouse aortic arch and aortic root stained with Masson staining. The Masson staining-positive area in the aortic arch and aortic root is shown as the ratio of the stained area to the total area of the aortic sinus; E: Representative section of mouse aortic arch and aortic root stained with hematoxylin eosin (HE) staining. The HE staining-positive area in the aortic arch and aortic root is shown as the ratio of the stained area to the total area of the aortic sinus; F: Ultrasonography of the aorta in each group, including representative images, systolic diameter, diastolic diameter, and vessel wall thickness; G: Representative images of aortic arch section stained with anti-F4/80 antibody. The F4/80-positive area in the atherosclerotic plaque is shown as the ratio of the stained area to the total area of the atherosclerotic plaque. Scale bar = 100 μm. aP < 0.05, bP < 0.001. AS: Atherosclerotic; HE: Hematoxylin eosin; MSC: Mesenchymal stem cell; ORO: Oil Red O.
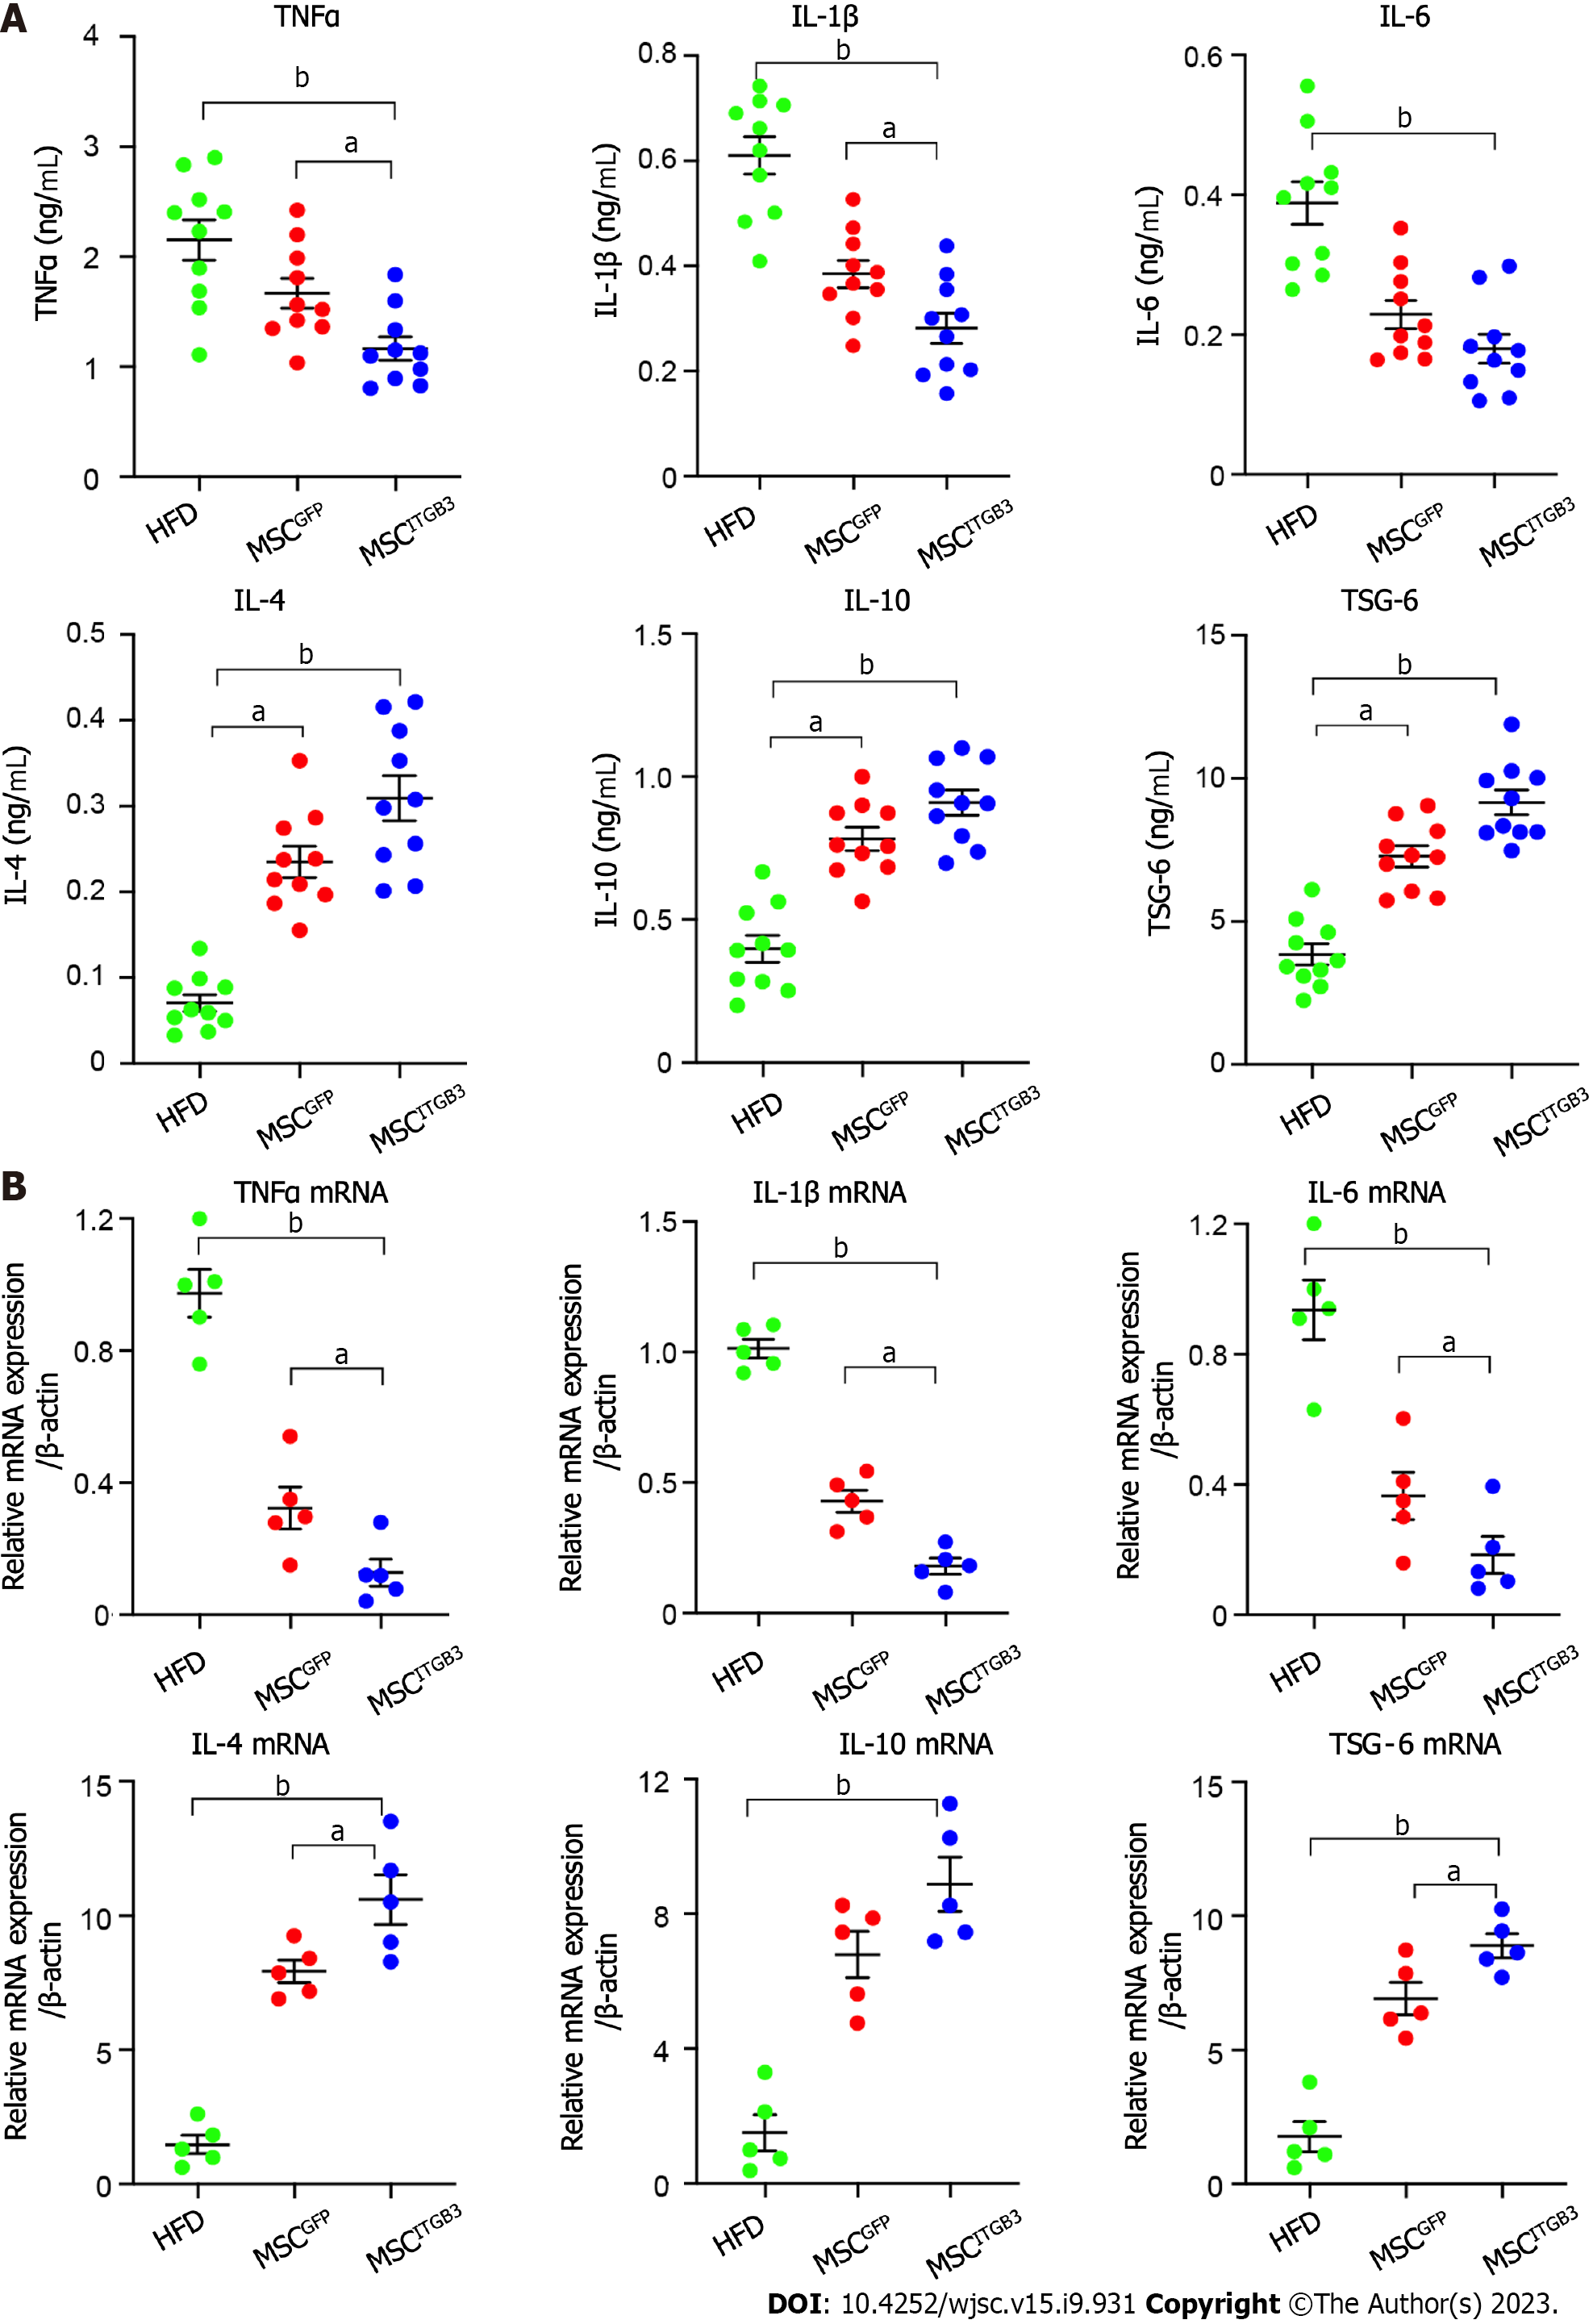
Figure 5 Mesenchymal stem cellITGB3 modulated cytokine expressions in an atherosclerotic mouse model.
A: Serum pro-inflammatory factors tumor necrosis factor (TNF)α, interleukin (IL)-1β, and IL-6 and anti-inflammatory factors IL-4, IL-10, and tumor necrosis factor-stimulated gene-6 (TSG-6) levels measured using ELISA; B: mRNA expression of pro-inflammatory factors TNFα, IL-1β, and IL-6 and anti-inflammatory factors IL-4, IL-10, and TSG-6 in aortic tissue, quantified using quantitative real-time polymerase chain reaction. Expression is shown relative to the expression of housekeeping genes (β-actin). All values are expressed as mean ± SEM. aP < 0.05, bP < 0.001. ELISA: Enzyme-linked immunosorbent assay; IL: Interleukin; MSC: Mesenchymal stem cell; qRT-PCR: Quantitative real-time polymerase chain reaction; SEM: Standard error of the mean; TNF-α: Tumor necrosis factor-a; TSG-6: Tumor necrosis factor-stimulated gene-6.
- Citation: Hu HJ, Xiao XR, Li T, Liu DM, Geng X, Han M, Cui W. Integrin beta 3-overexpressing mesenchymal stromal cells display enhanced homing and can reduce atherosclerotic plaque. World J Stem Cells 2023; 15(9): 931-946
- URL: https://www.wjgnet.com/1948-0210/full/v15/i9/931.htm
- DOI: https://dx.doi.org/10.4252/wjsc.v15.i9.931


