©The Author(s) 2023.
World J Stem Cells. Sep 26, 2023; 15(9): 908-930
Published online Sep 26, 2023. doi: 10.4252/wjsc.v15.i9.908
Published online Sep 26, 2023. doi: 10.4252/wjsc.v15.i9.908
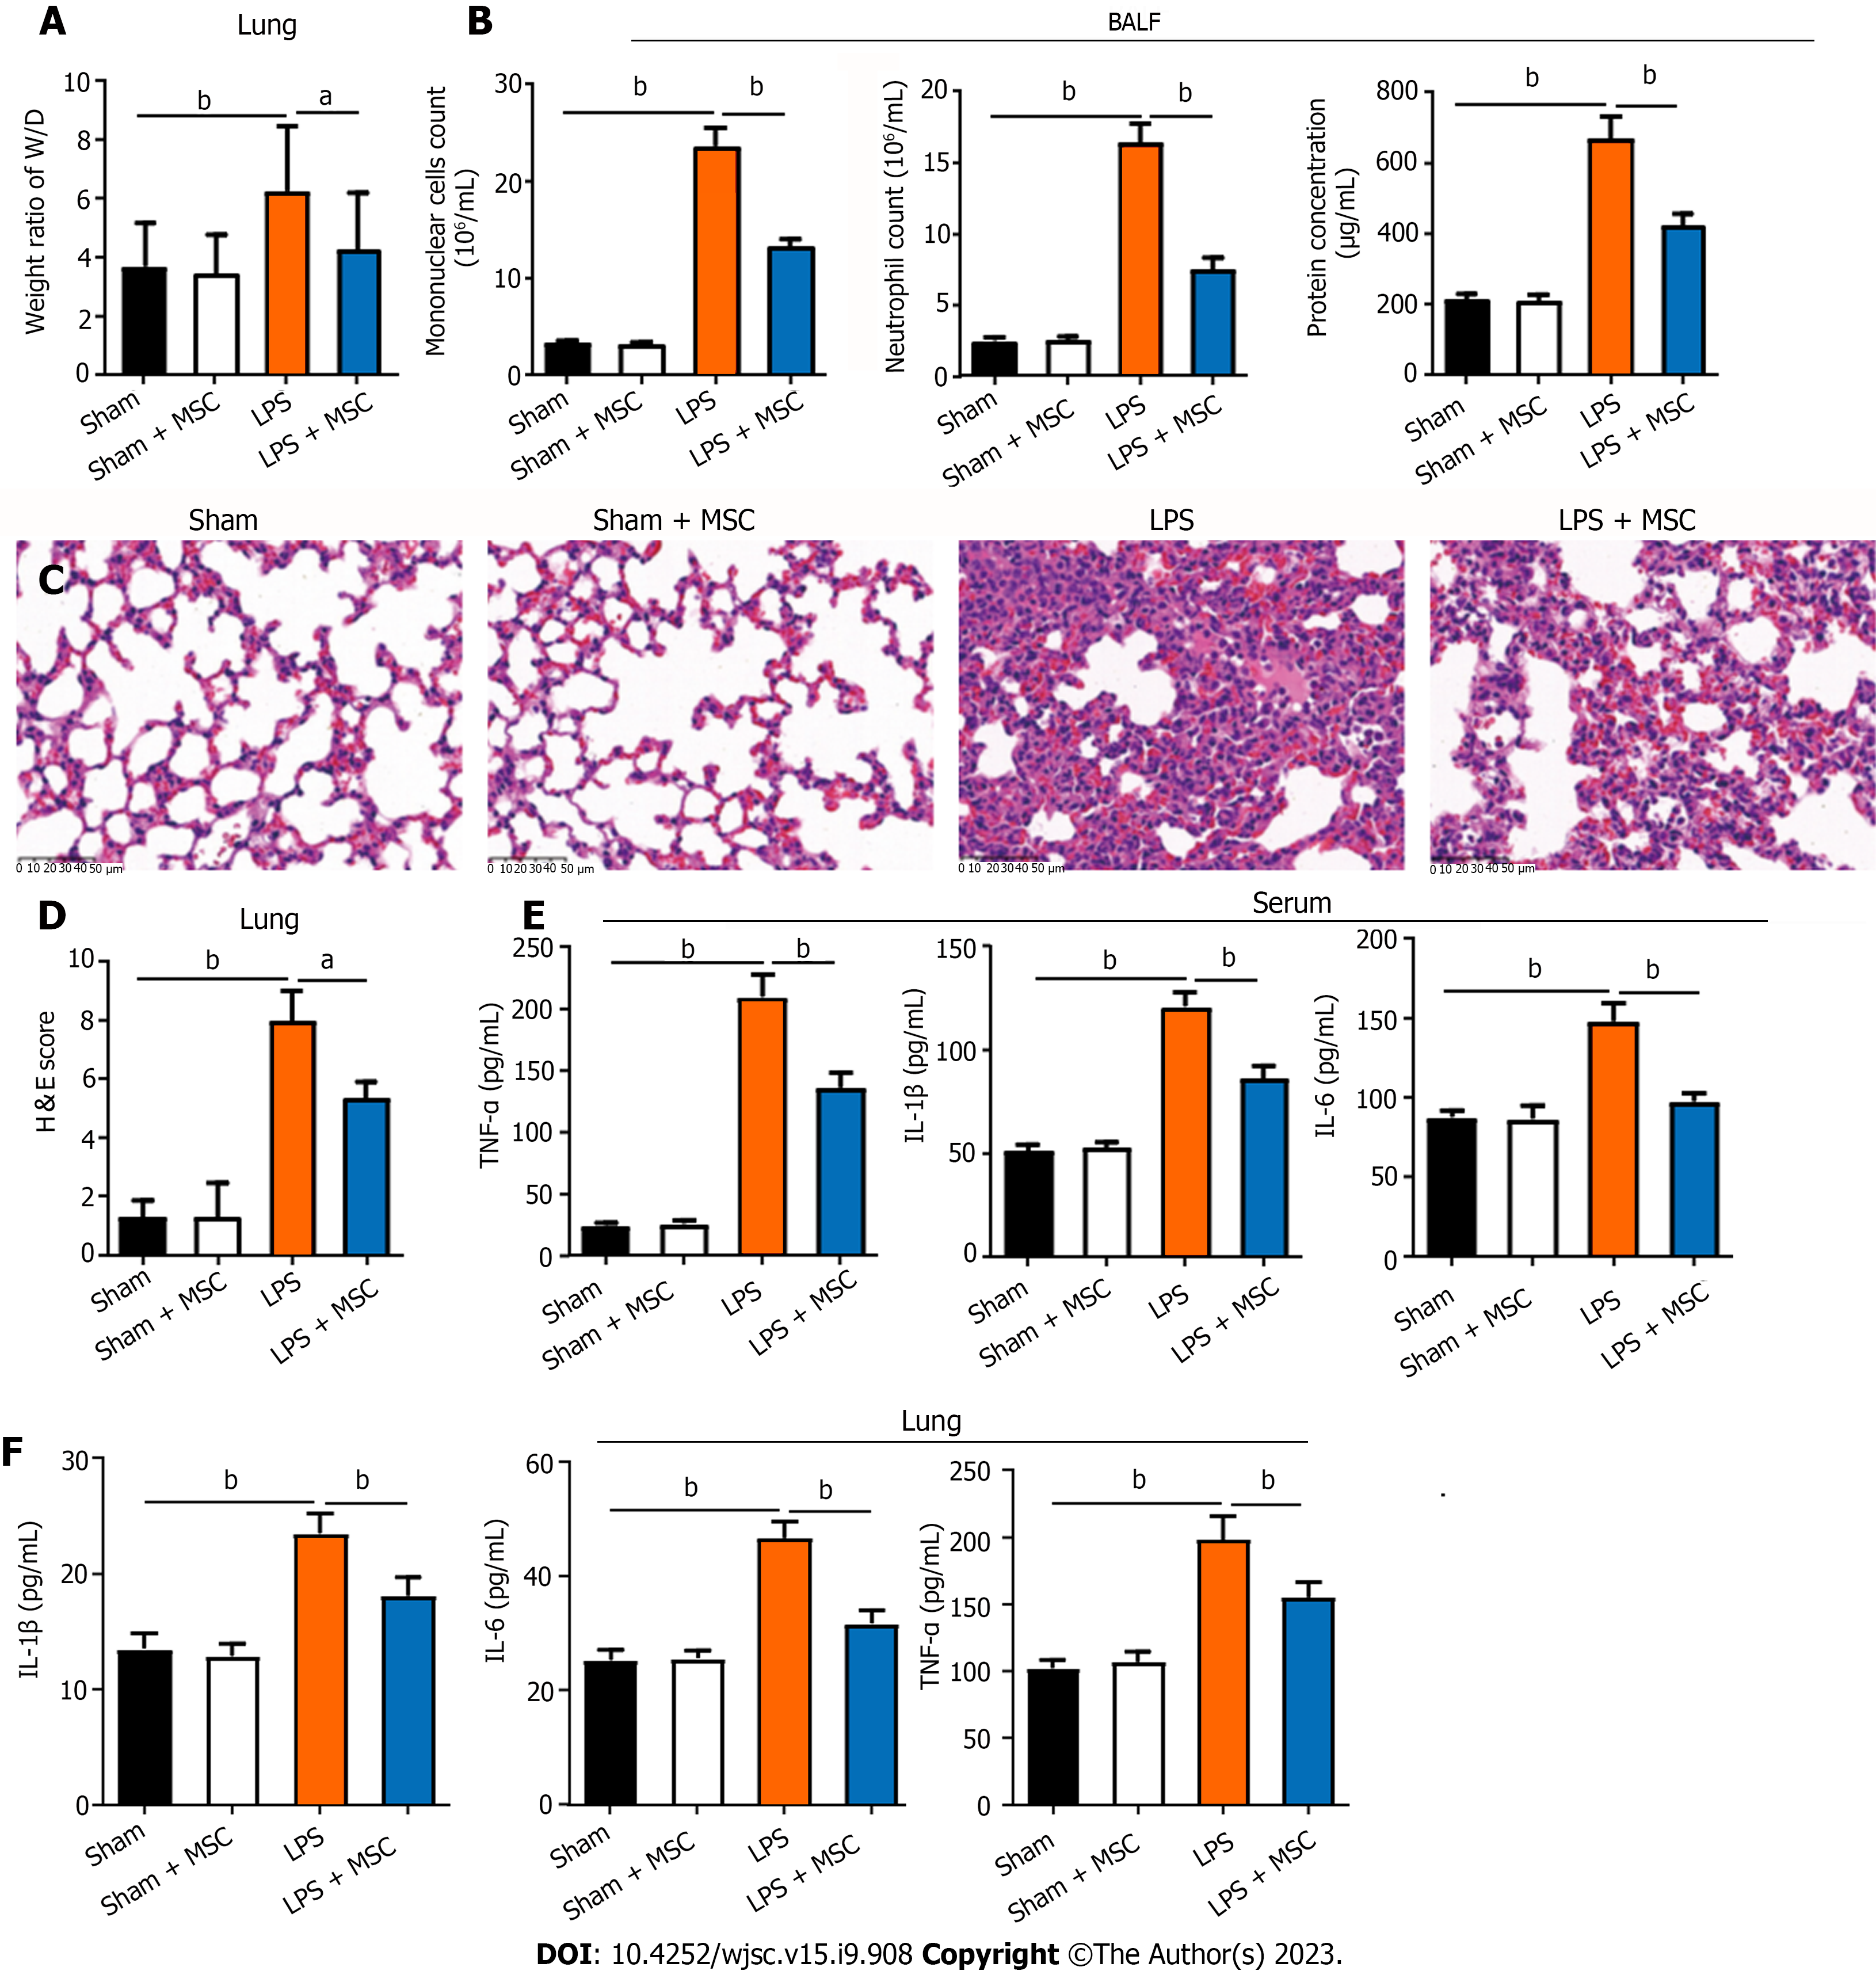
Figure 1 Human umbilical cord mesenchymal stem cells attenuate lipopolysaccharide-induced lung injury and inflammation in acute lung injury mice.
A: In acute lung injury (ALI) mice, the wet-to-dry (W/D) weight ratio of the lung was higher than that of human umbilical cord mesenchymal stem cell (HUC-MSC)-treated ALI mice (n = 3); B: ALI mice had more mononuclear cells and neutrophils, and higher protein concentration in bronchoalveolar lavage fluid (BALF) than sham mice, while HUC-MSC treatment decreased these parameters (n = 12); C: Representative images of hematoxylin-eosin (H&E)-stained lung tissues (× 400, scale = 50 μm); D: Lung histopathological damage in mice (H&E staining; n = 3); E: Serum tumor necrosis factor (TNF)-α, interleukin (IL)-1β, IL-6, and lipopolysaccharide levels were higher in ALI mice and HUC-MSC treatment decreased their levels (n = 12); F: TNF-α, IL-1β, and IL-6 levels in the lungs of ALI mice were hugely increased than those in sham mice, while HUC-MSC treatment in ALI mice decreased them (n = 12). aP < 0.05, bP < 0.01. LPS: Lipopolysaccharide; MSC: Mesenchymal stem cell; BALF: Bronchoalveolar lavage fluid; H&E: Hematoxylin-eosin; IL: Interleukin; TNF: Tumor necrosis factor.
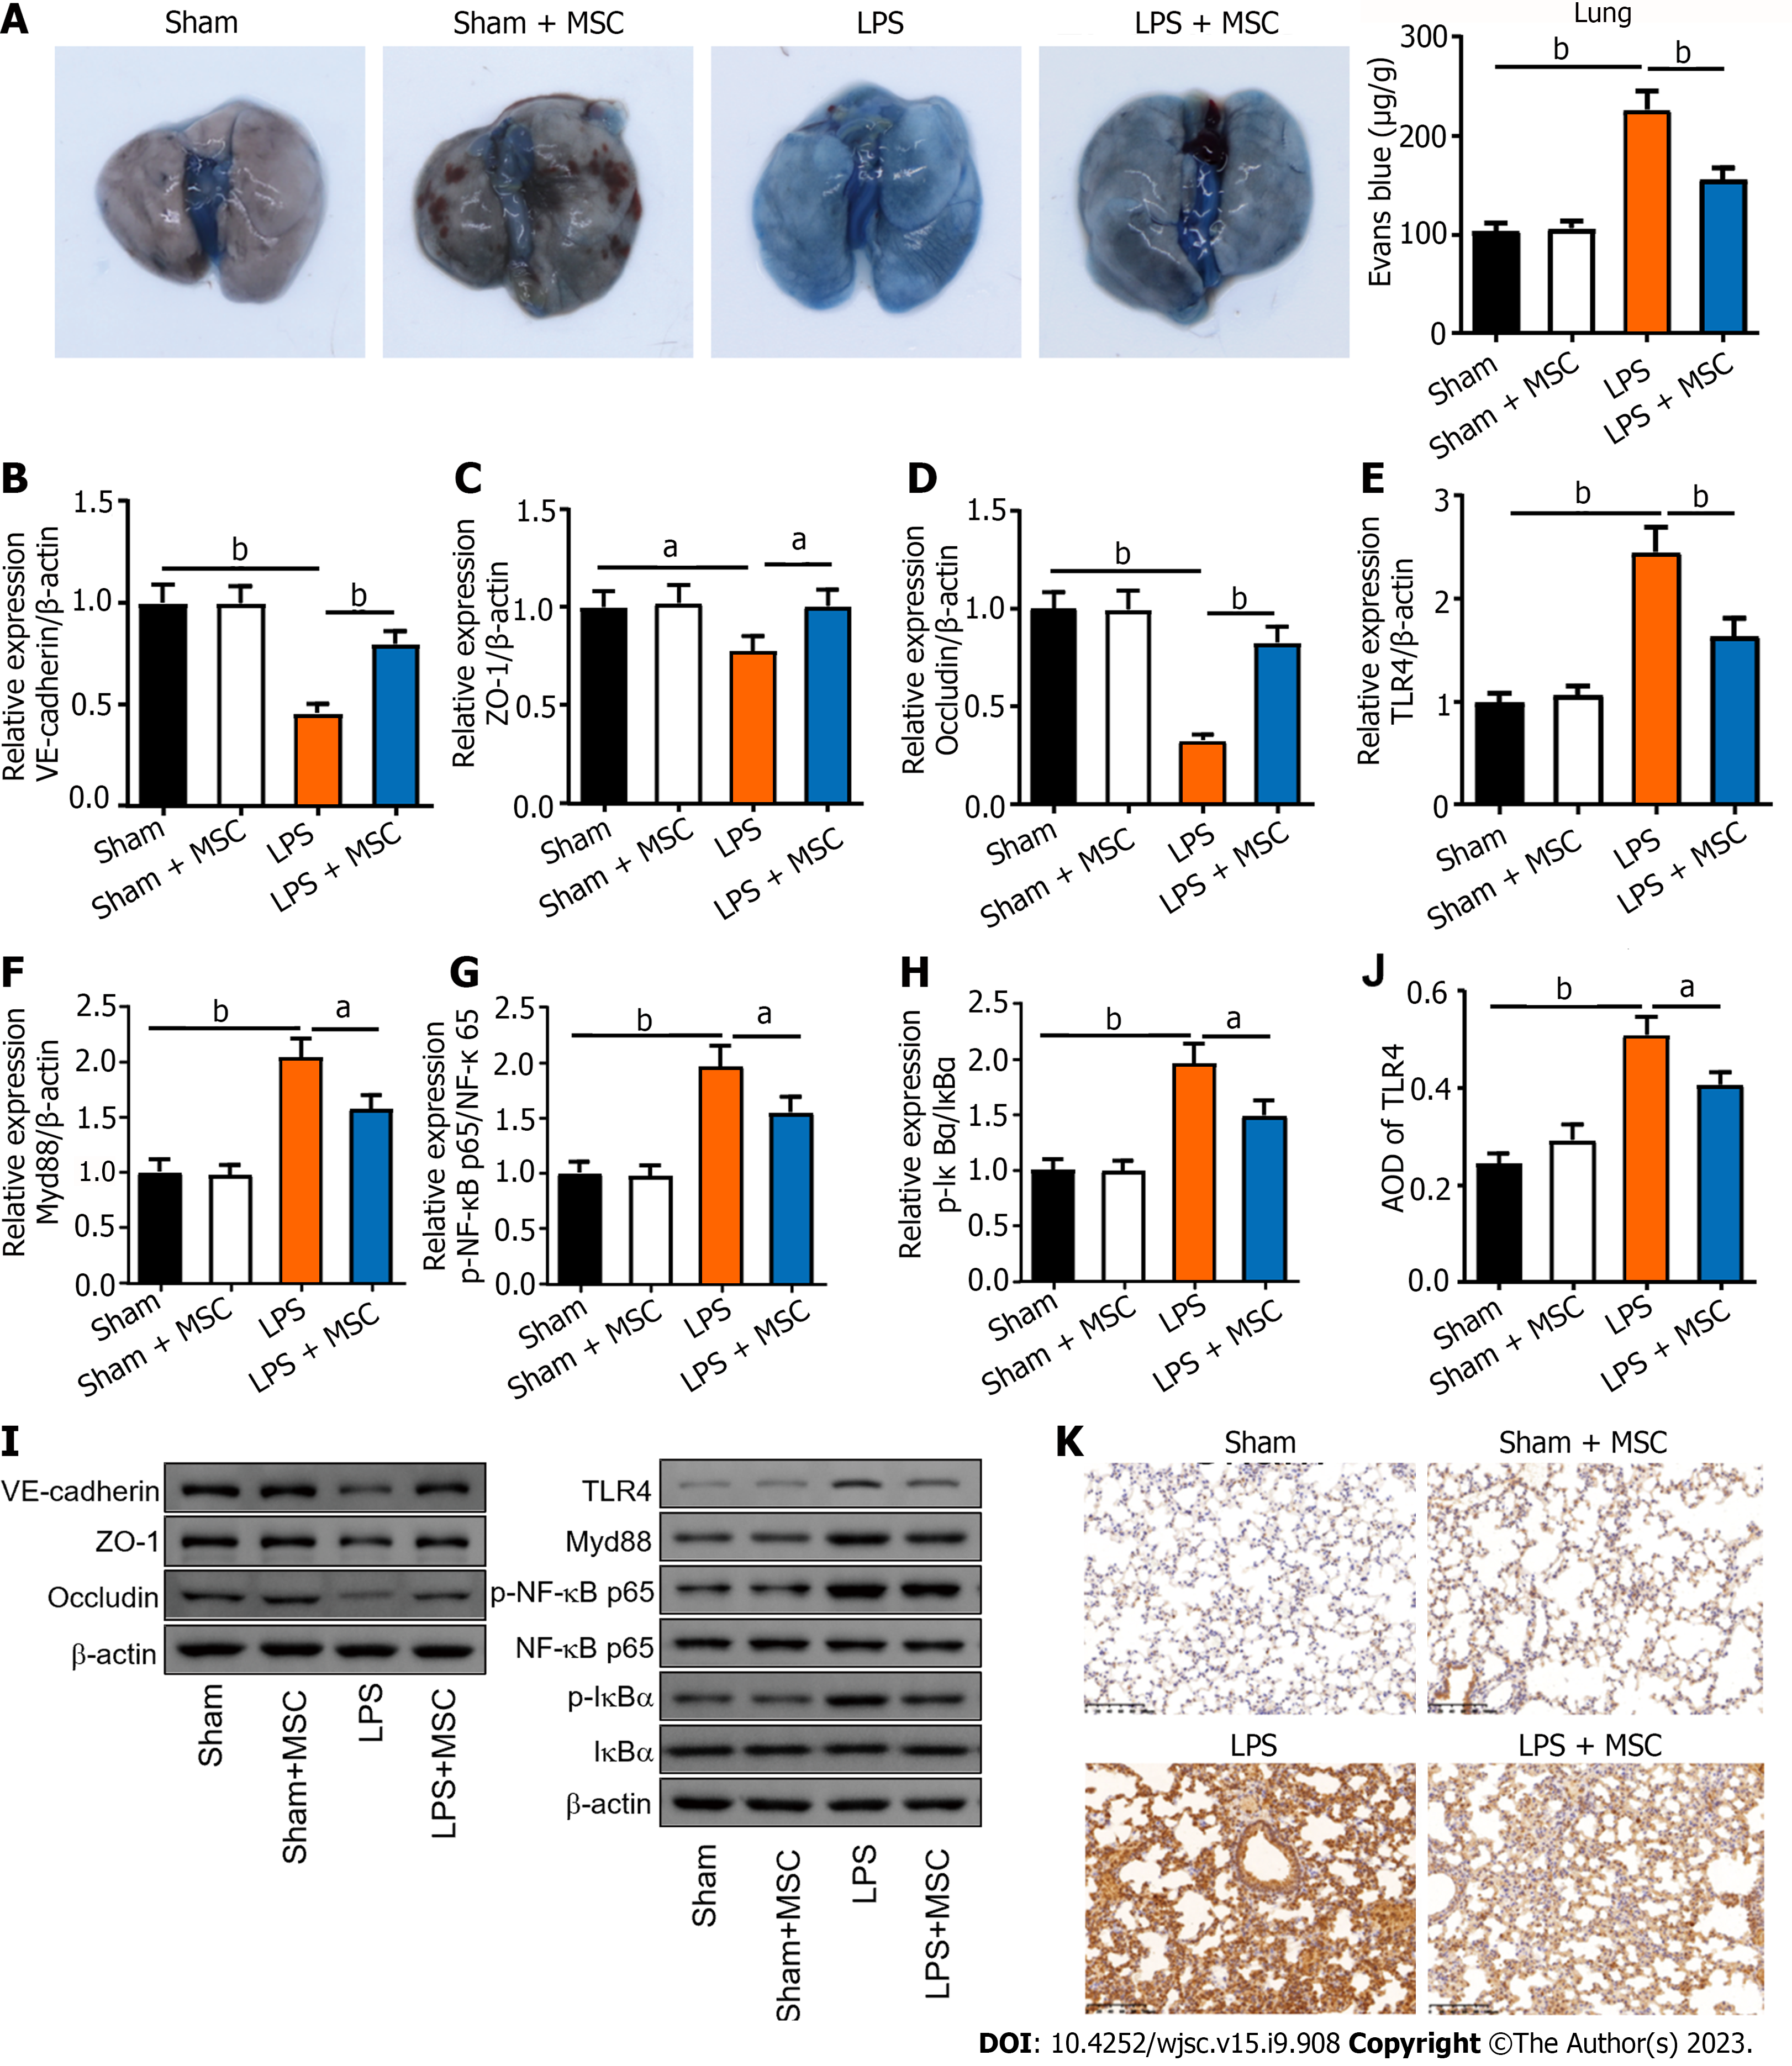
Figure 2 Human umbilical cord mesenchymal stem cells improve endothelial barrier function in vivo and regulate related protein expression.
A: The Evans blue assay was carried out to assess lung endothelial barrier function in acute lung injury (ALI) mice (n = 3). The ALI mice [lipopolysaccharide (LPS) group] had the largest amount of Evans blue contents; human umbilical cord mesenchymal stem cell (HUC-MSC) treatment in ALI mice (LPS + MSC group) decreased the contents in the lung; B-H: LPS treatment in mice inhibited the expression of vascular endothelial-cadherin (B), zonula occludens-1 (C), and occludin (D) and raised the expression of Toll-like receptor 4 (TLR4) (E), myeloid differentiation factor 88 (F), p-nuclear factor kappa-B (NF-κB)/NF-κB (G), and p-inhibitor α of NF-κB (IκBα)/IκBα (H) (n = 3), while HUC-MSC treatment antagonized the effects of LPS; I: Representative western blot bands of the above proteins; J and K: Statistical results of immunohistochemistry and its representative images. It was showed that TLR4 was highly expressed in the lung tissue of ALI mice and HUC-MSC treatment could decrease its expression (n = 3). aP < 0.05, bP < 0.01. LPS: Lipopolysaccharide; MSC: Mesenchymal stem cell; LPS: Lipopolysaccharide; VE: Vascular endothelial; ZO-1: Zonula occludens-1; TLR4: Toll-like receptor 4; Myd88: Myeloid differentiation factor 88; NF-κB: Nuclear factor kappa-B; IκBα: Inhibitor α of nuclear factor kappa-B.
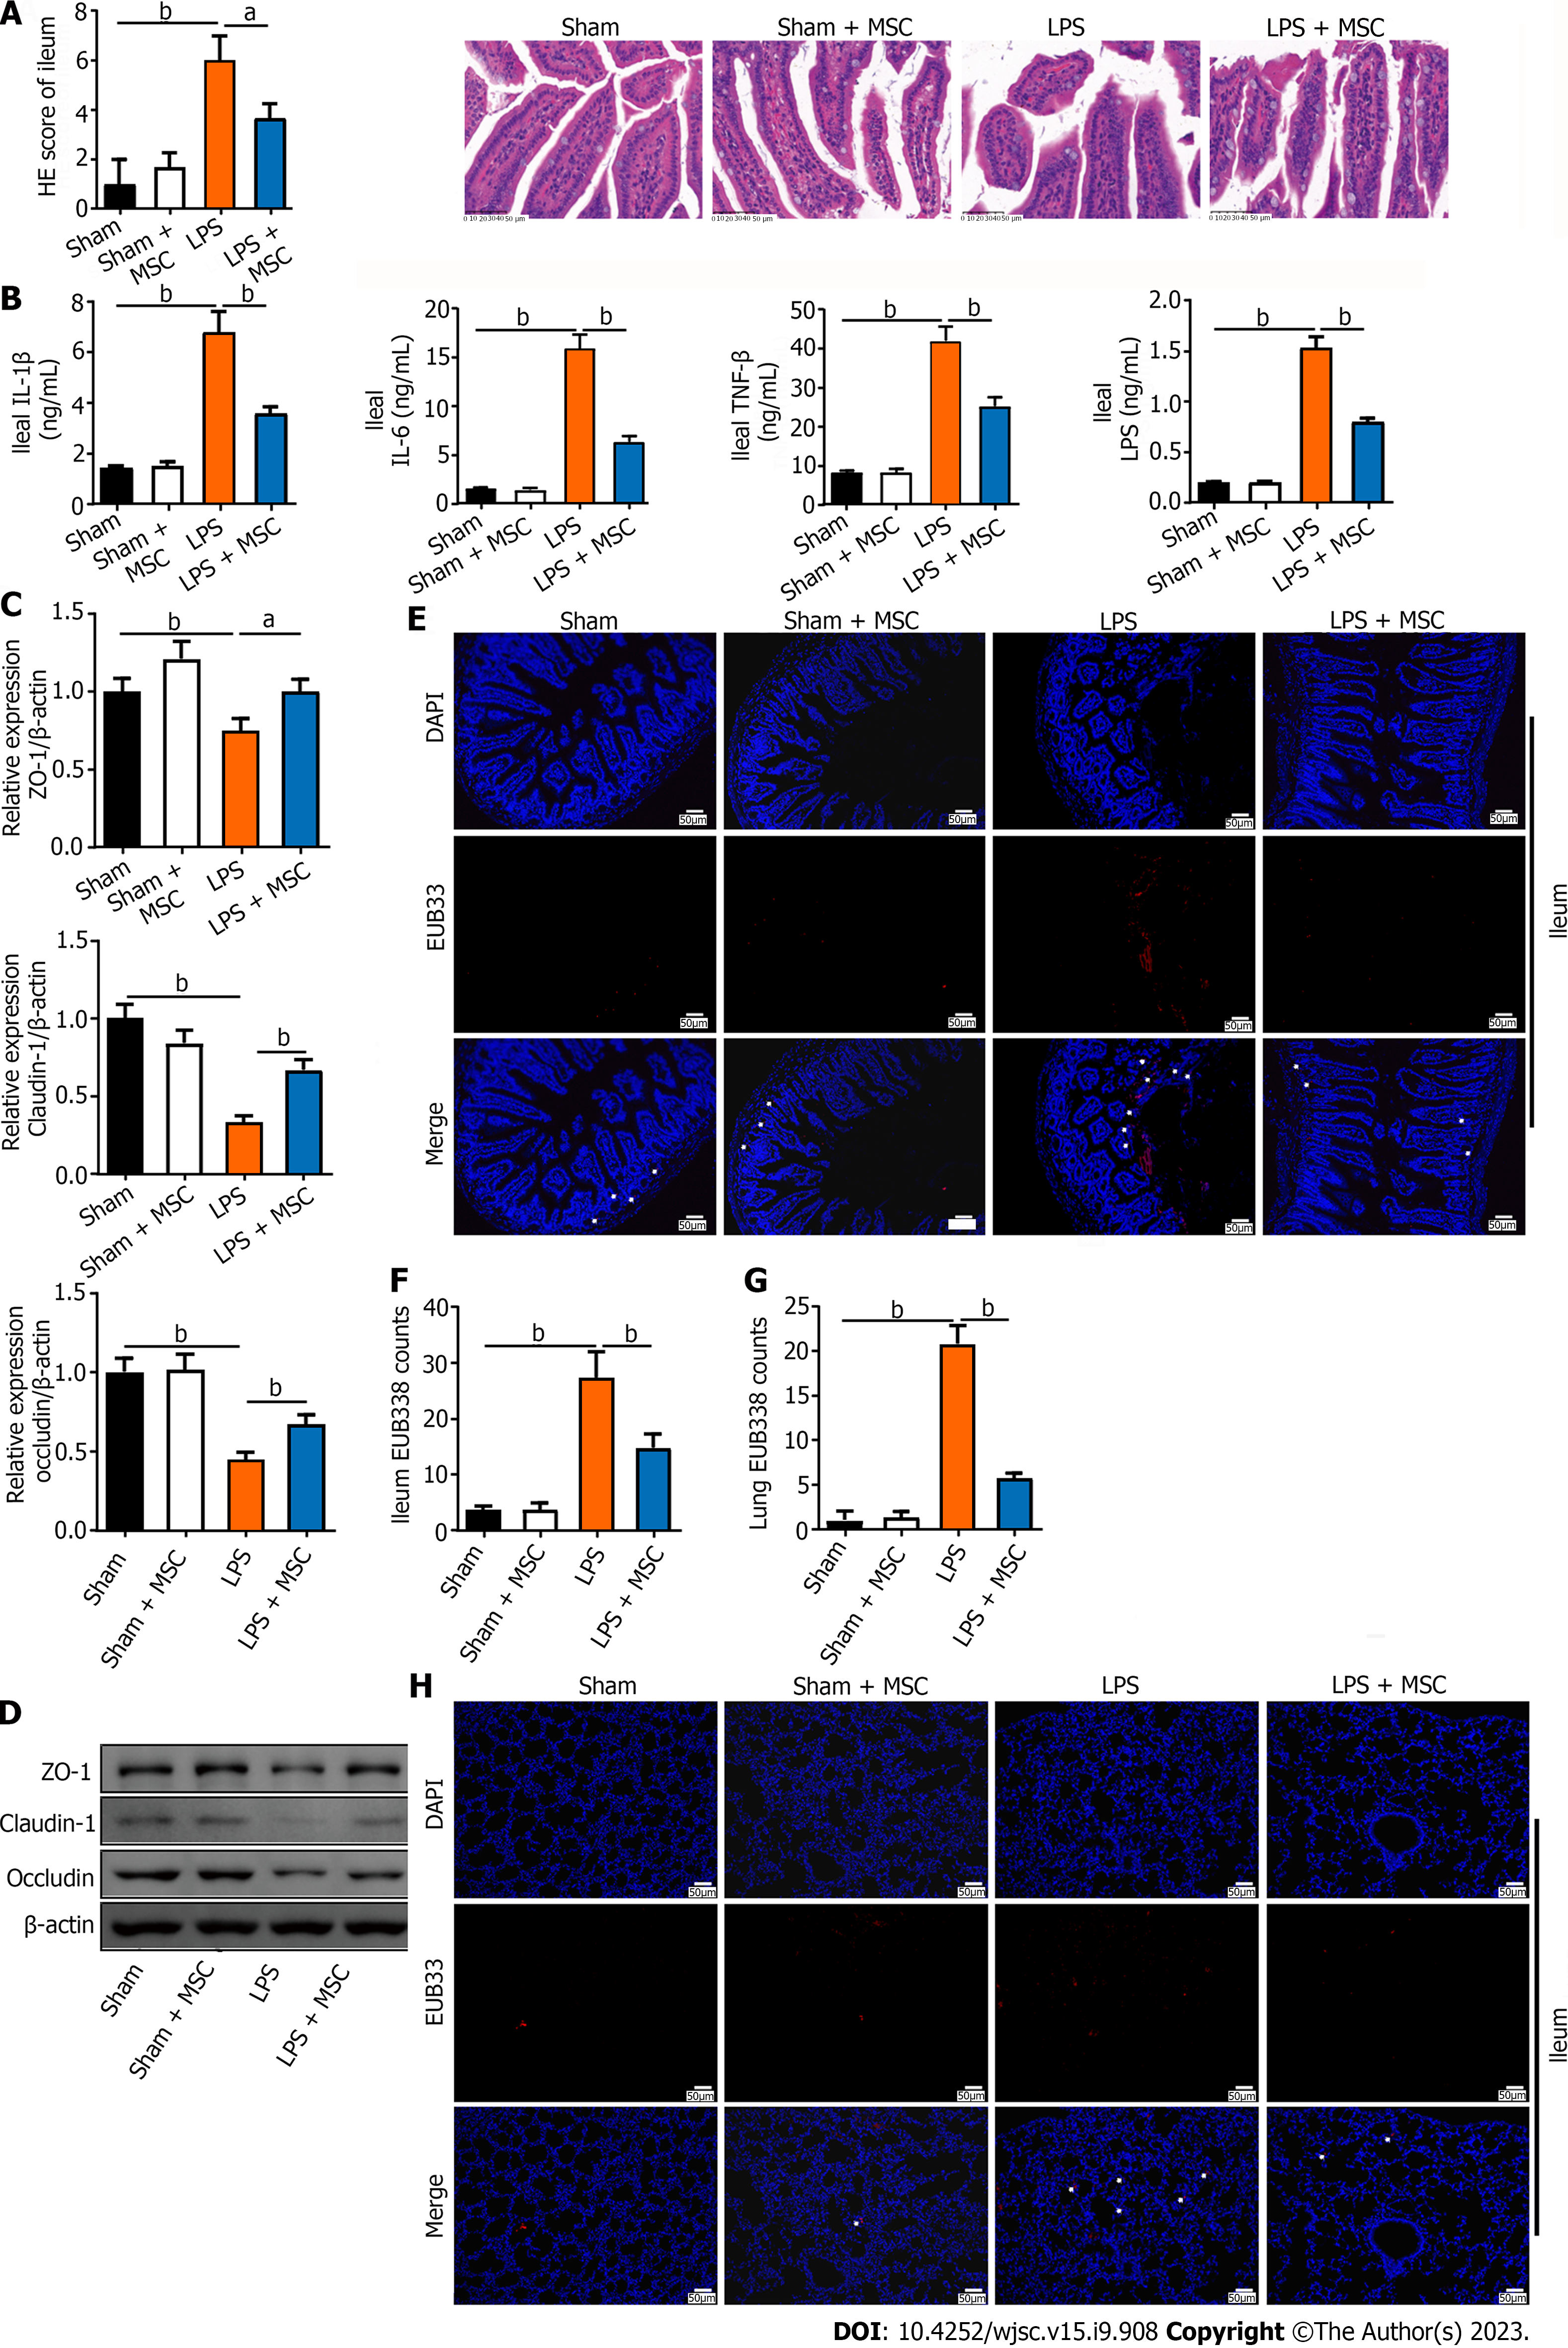
Figure 3 Human umbilical cord mesenchymal stem cells improve histopathology, inflammation, and endothelial barrier integrity of the ileum in acute lung injury mice.
A: Ileum tissue injury in acute lung injury (ALI) mice was observed after hematoxylin-eosin staining. ALI mice had severe ileum tissue injury while human umbilical cord mesenchymal stem cell (HUC-MSC) treatment improved such injury (n = 3); B: Tumor necrosis factor (TNF)-α, interleukin (IL)-1β, IL-6, and lipopolysaccharide (LPS) levels in the ileum were measured by ELISA (n = 12), and ALI mice had higher levels of TNF-α, IL-1β, IL-6, and LPS compared to sham mice, while HUC-MSC treatment decreased the levels of these factors; C: Zonula occludens-1 (ZO-1), claudin-1, and occludin levels were measured to observe the integrity of the ileum barrier (n = 3); D: Representative western blot bands of ZO-1, claudin-1, and occludin; E-H: Bacterial translocation was determined by fluorescence in situ hybridization, and the EUB338 counts in the ileum epithelium and lung per field were quantified (n = 3). aP < 0.05, bP < 0.01. MSC: Mesenchymal stem cell; LPS: Lipopolysaccharide; ZO-1: Zonula occludens-1; HE: Hematoxylin-eosin; IL: Interleukin; TNF: Tumor necrosis factor.
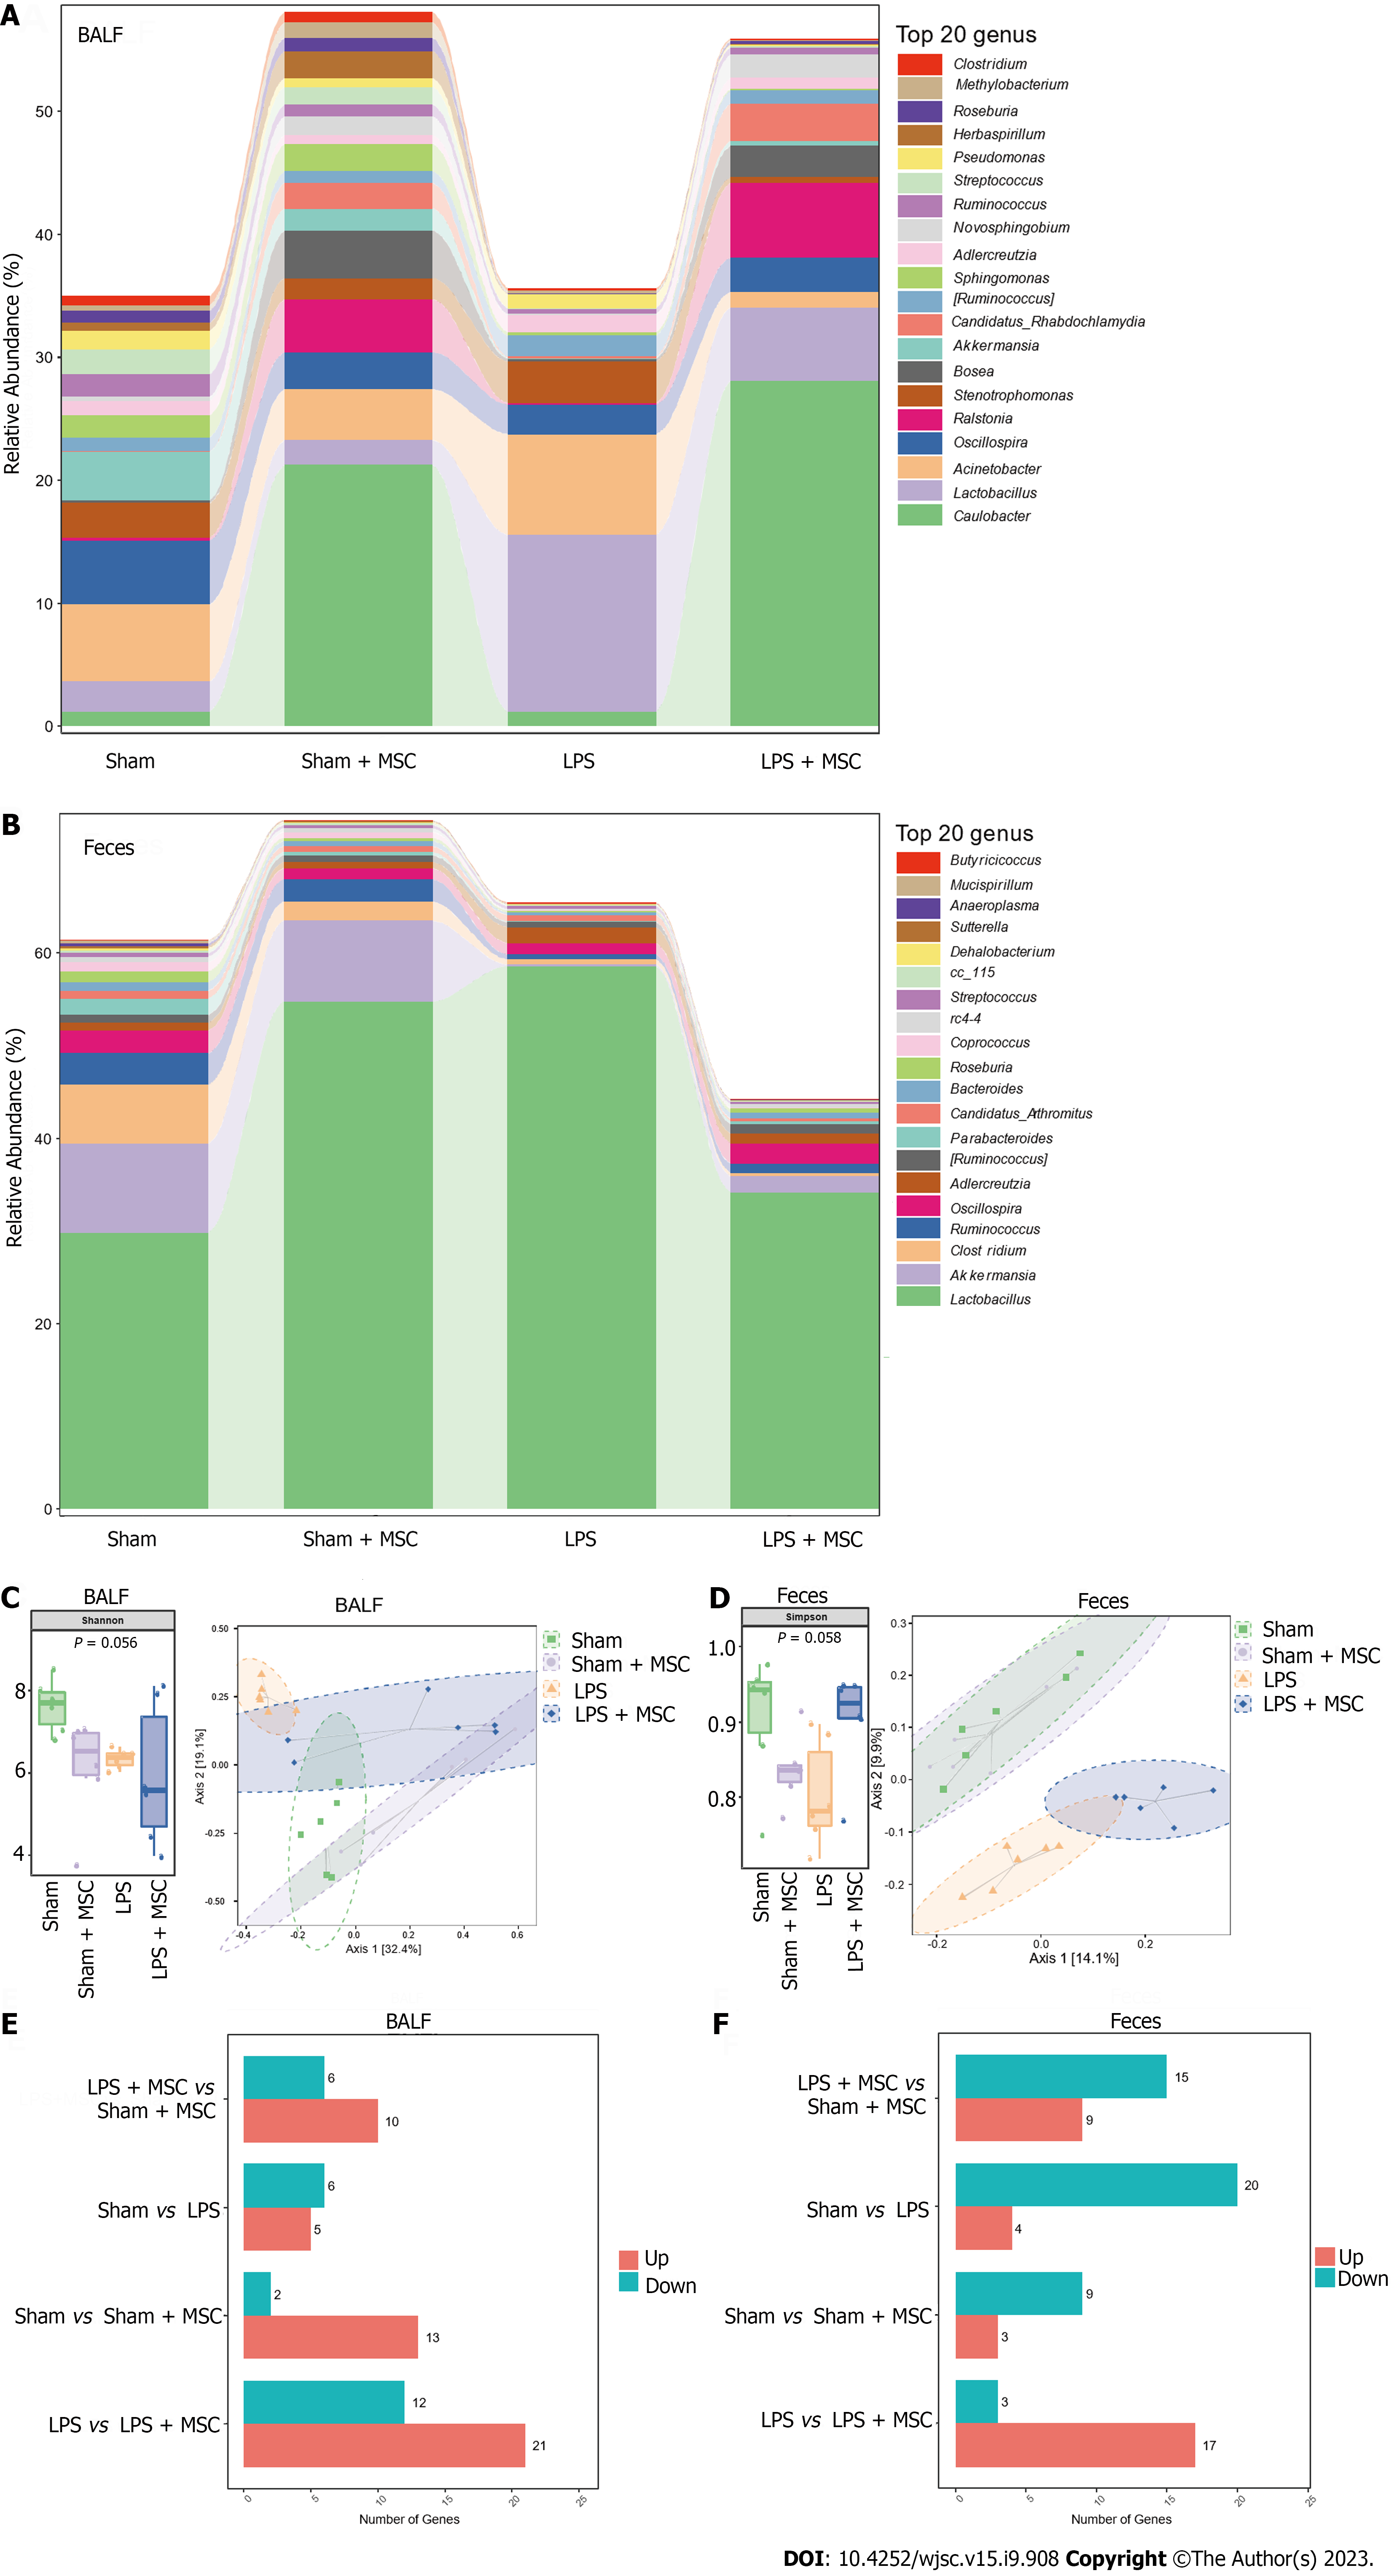
Figure 4 Microflora homeostasis in bronchoalveolar lavage fluid and feces of acute lung injury mice (n = 6).
A and B: Relative abundance of top 20 genera of microflora in bronchoalveolar lavage fluid (BALF) and feces; C and D: The within-sample richness and evenness (alpha diversity) were statistically analyzed by Shannon index, Simpson index, and the bray-Curtis based principal coordinates analysis of similarity coefficients in the BALF and feces of different groups (beta diversity); E and F: The Wilcoxon rank sum test was used to explore microflorae with a significant difference in abundance on OmicShare Tools. The number of differential microflorae in lipopolysaccharide (LPS) + mesenchymal stem cells (MSCs) group vs sham + MSC group, sham group vs LPS group, sham group vs sham + MSC group, and LPS group vs LPS + MSCs group is presented. The length of the red bar indicates the number of up-regulated microflorae and the length of the blue-green bar indicates the number of down-regulated microflorae. LPS: Lipopolysaccharide; MSC: Mesenchymal stem cell; BALF: Bronchoalveolar lavage fluid.
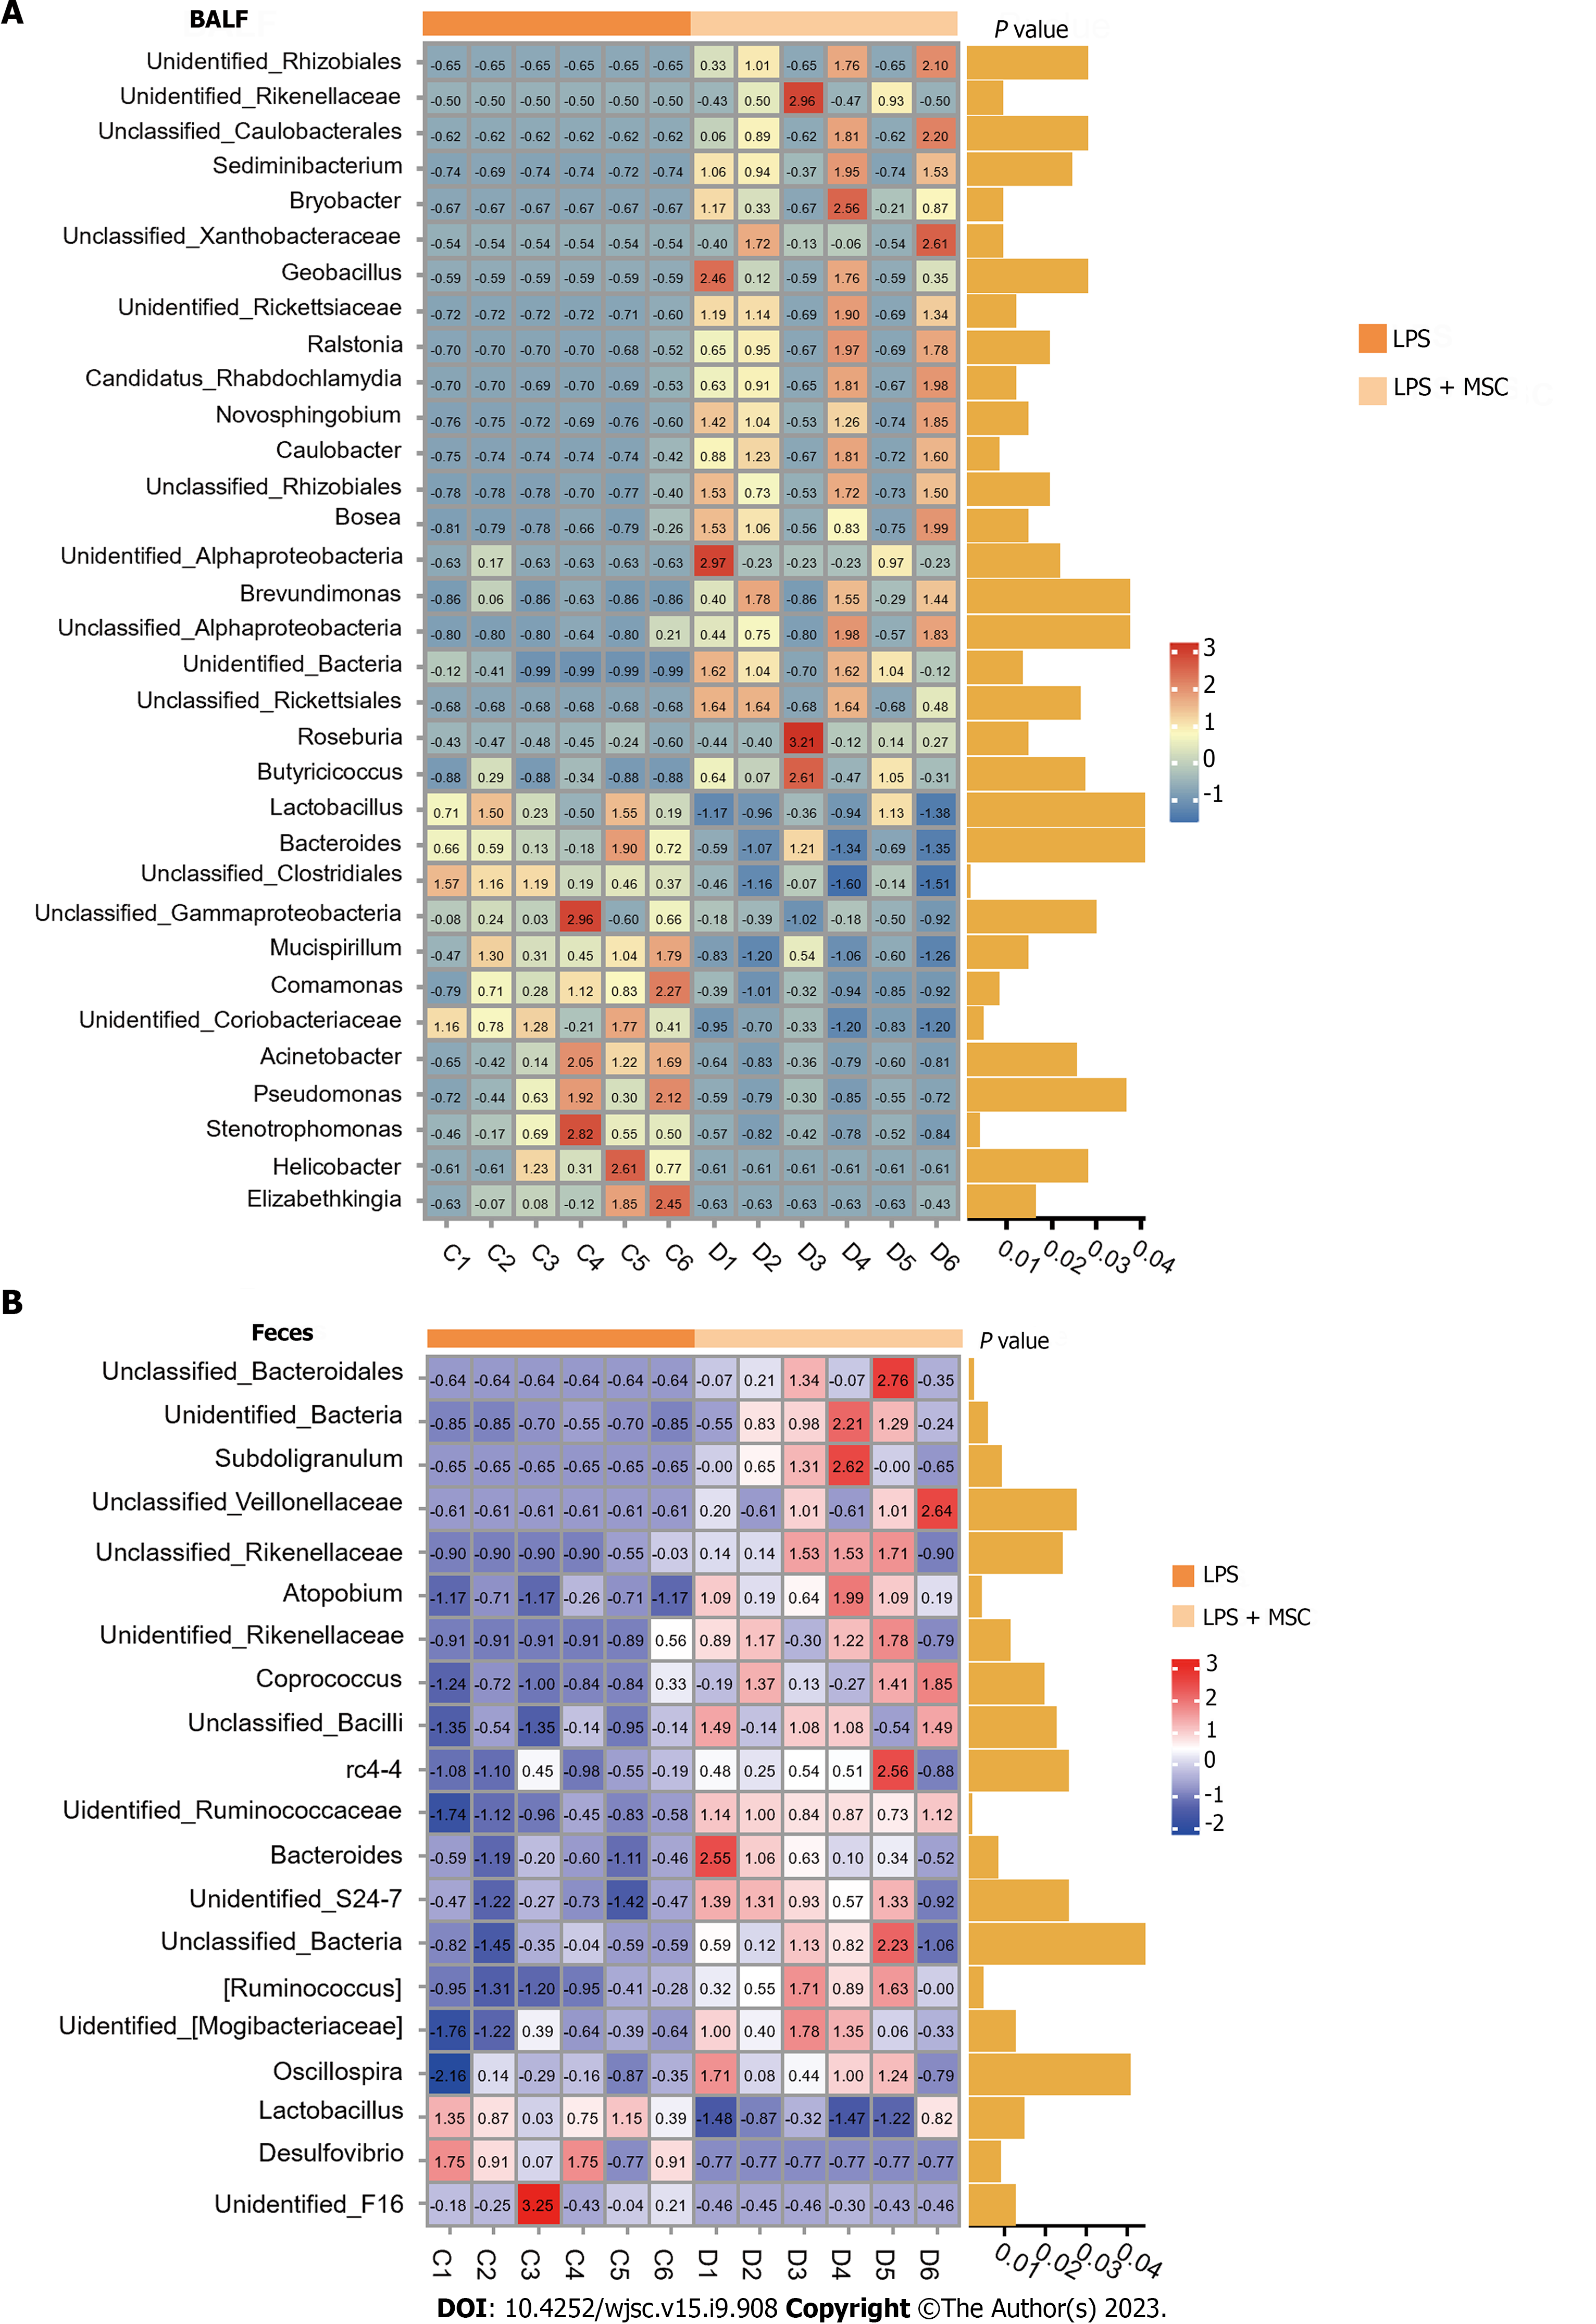
Figure 5 Differences in genus abundance of different microflorae in bronchoalveolar lavage fluid and feces of acute lung injury mice treated with human umbilical cord mesenchymal stem cells (n = 6).
A and B: Heatmaps showing the differences in the genus abundance of different microflorae in bronchoalveolar lavage fluid and feces. Red represents the genus that is more highly abundant; blue/purple represents the genus that is less abundant; white/yellow indicates no difference in expression between groups. Abundance is homogenized by Z-score. The value displayed in the middle of the grid is log2 (fold change). LPS: Lipopolysaccharide; MSC: Mesenchymal stem cell; BALF: Bronchoalveolar lavage fluid.
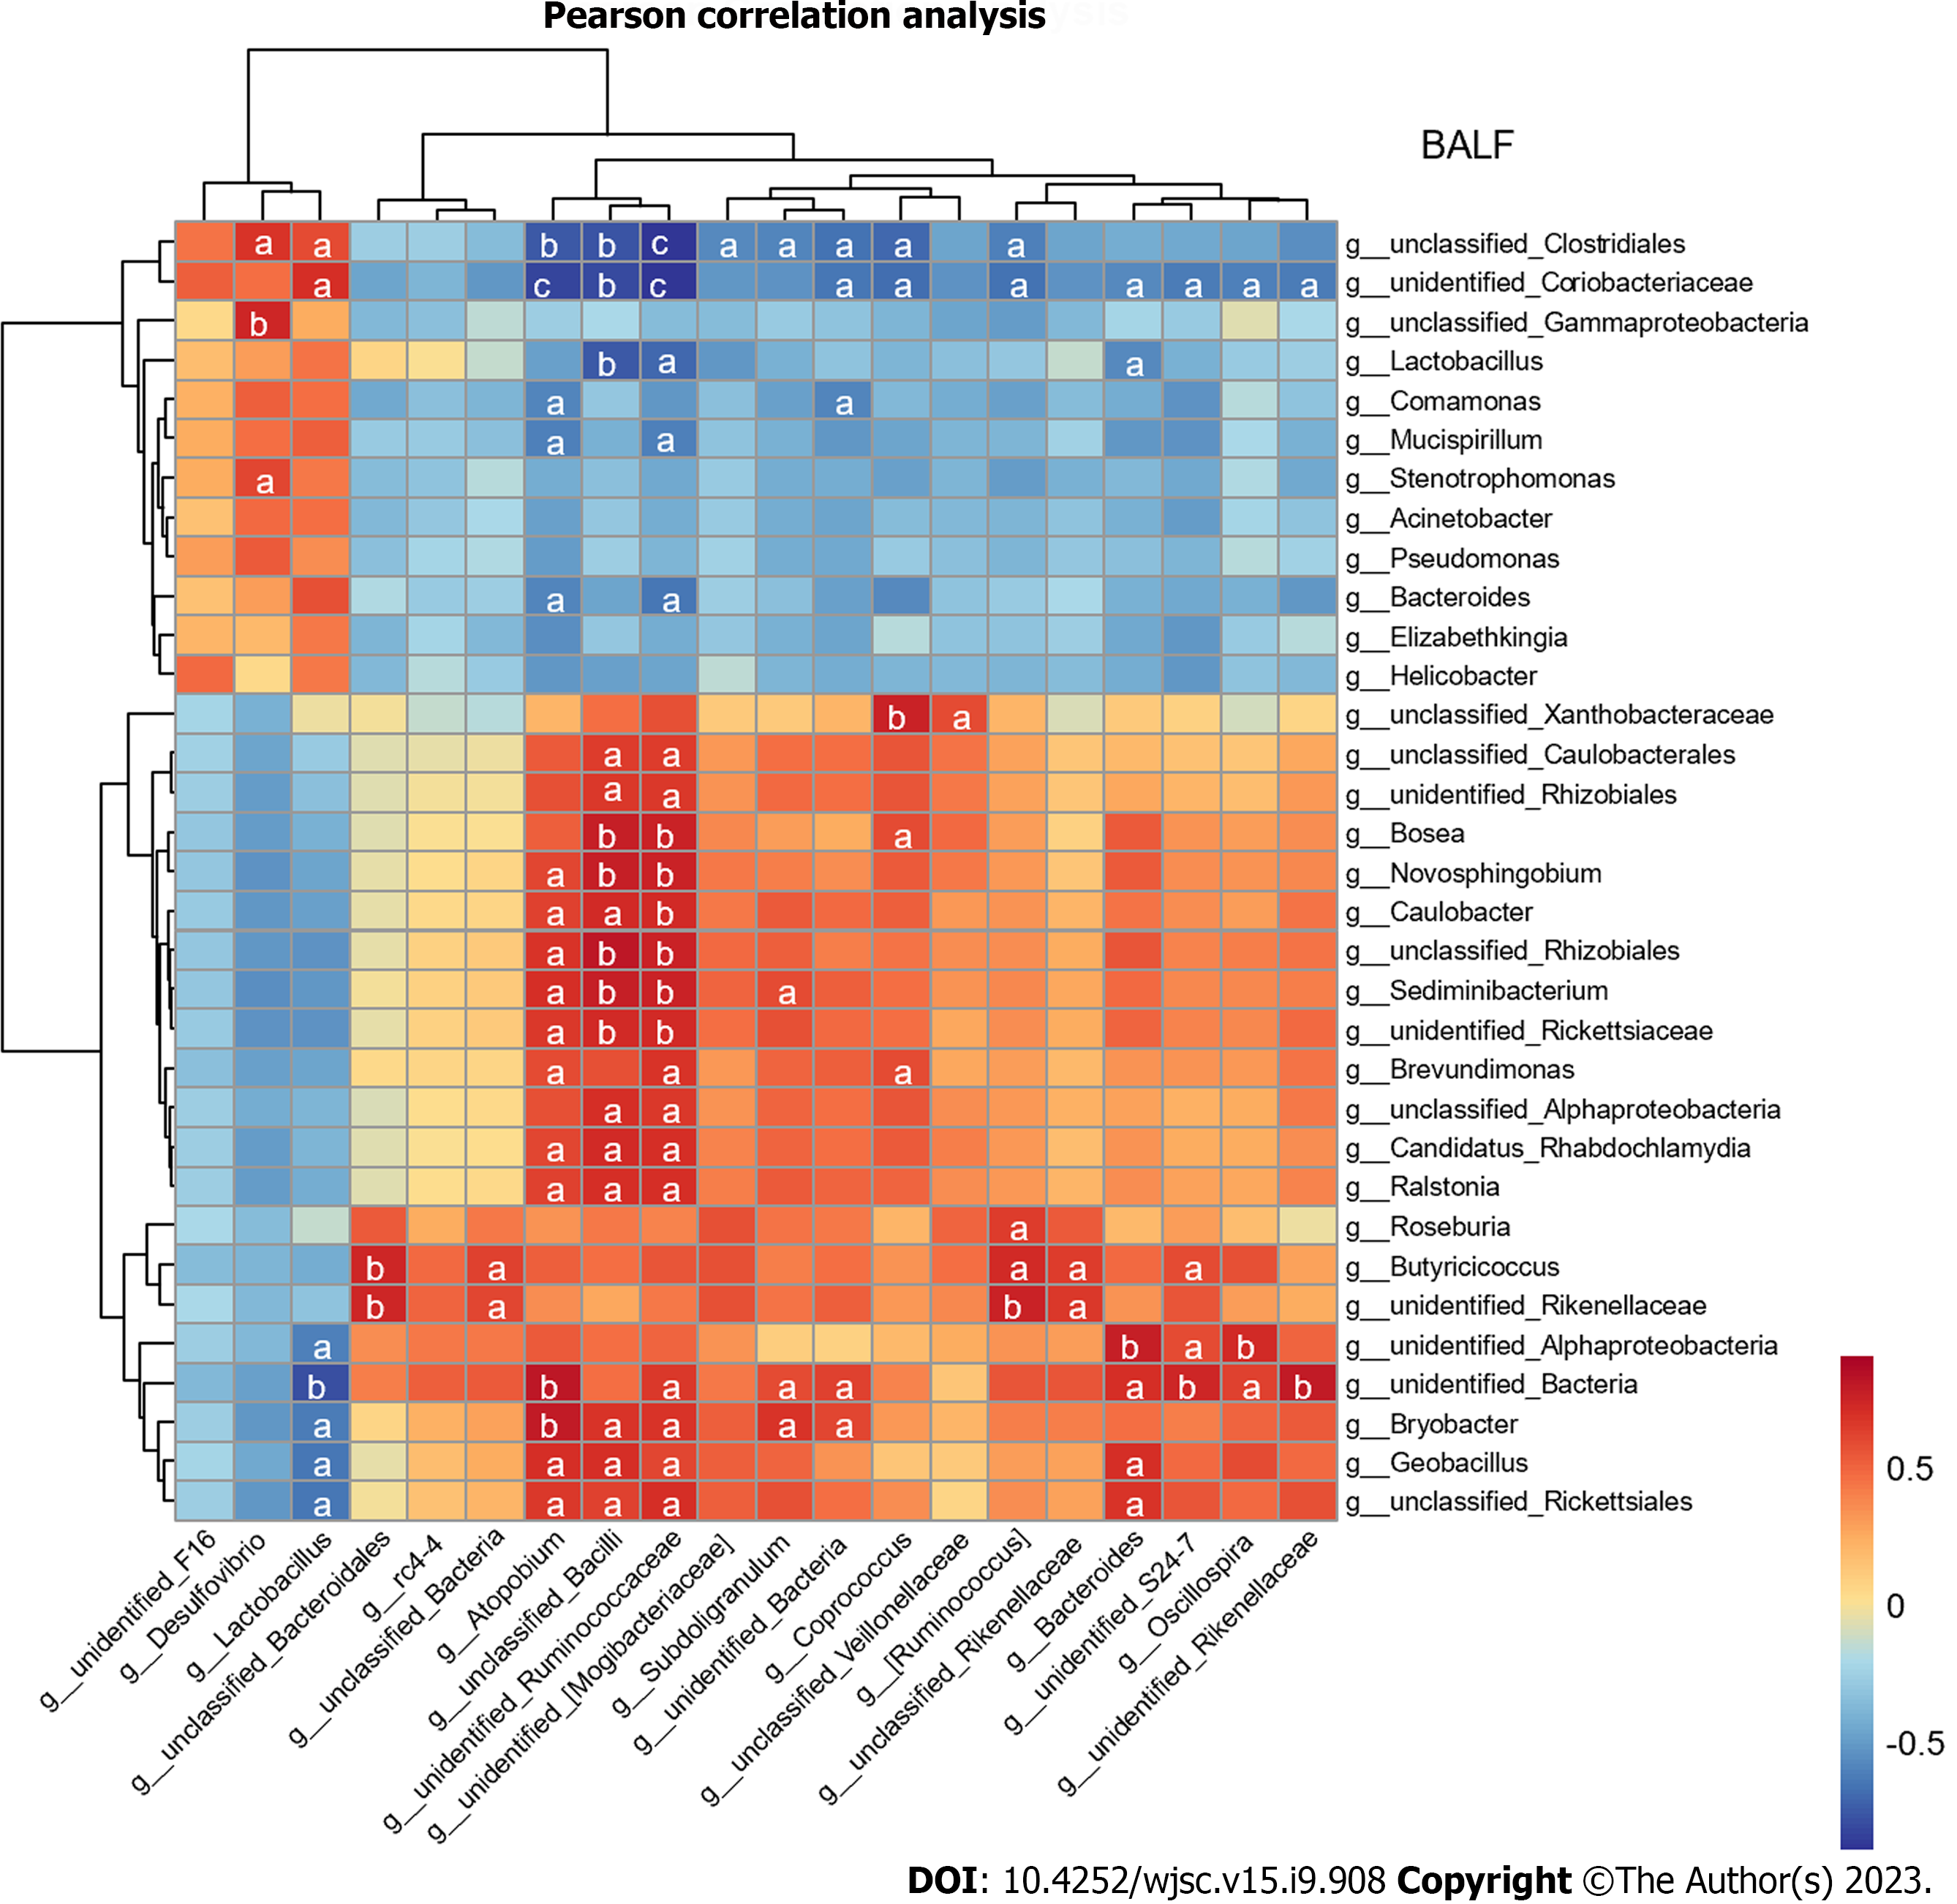
Figure 6 Correlation analysis between gut and lung microflorae.
Person correlation analysis was used to analyze the correlation between marked microflorae of the gut and lung with OmicsStudio Tools. Red indicates positive correlation and blue indicates negative correlation. aP < 0.05, bP < 0.01, and cP < 0.001 vs lipopolysaccharide group. BALF: Bronchoalveolar lavage fluid.
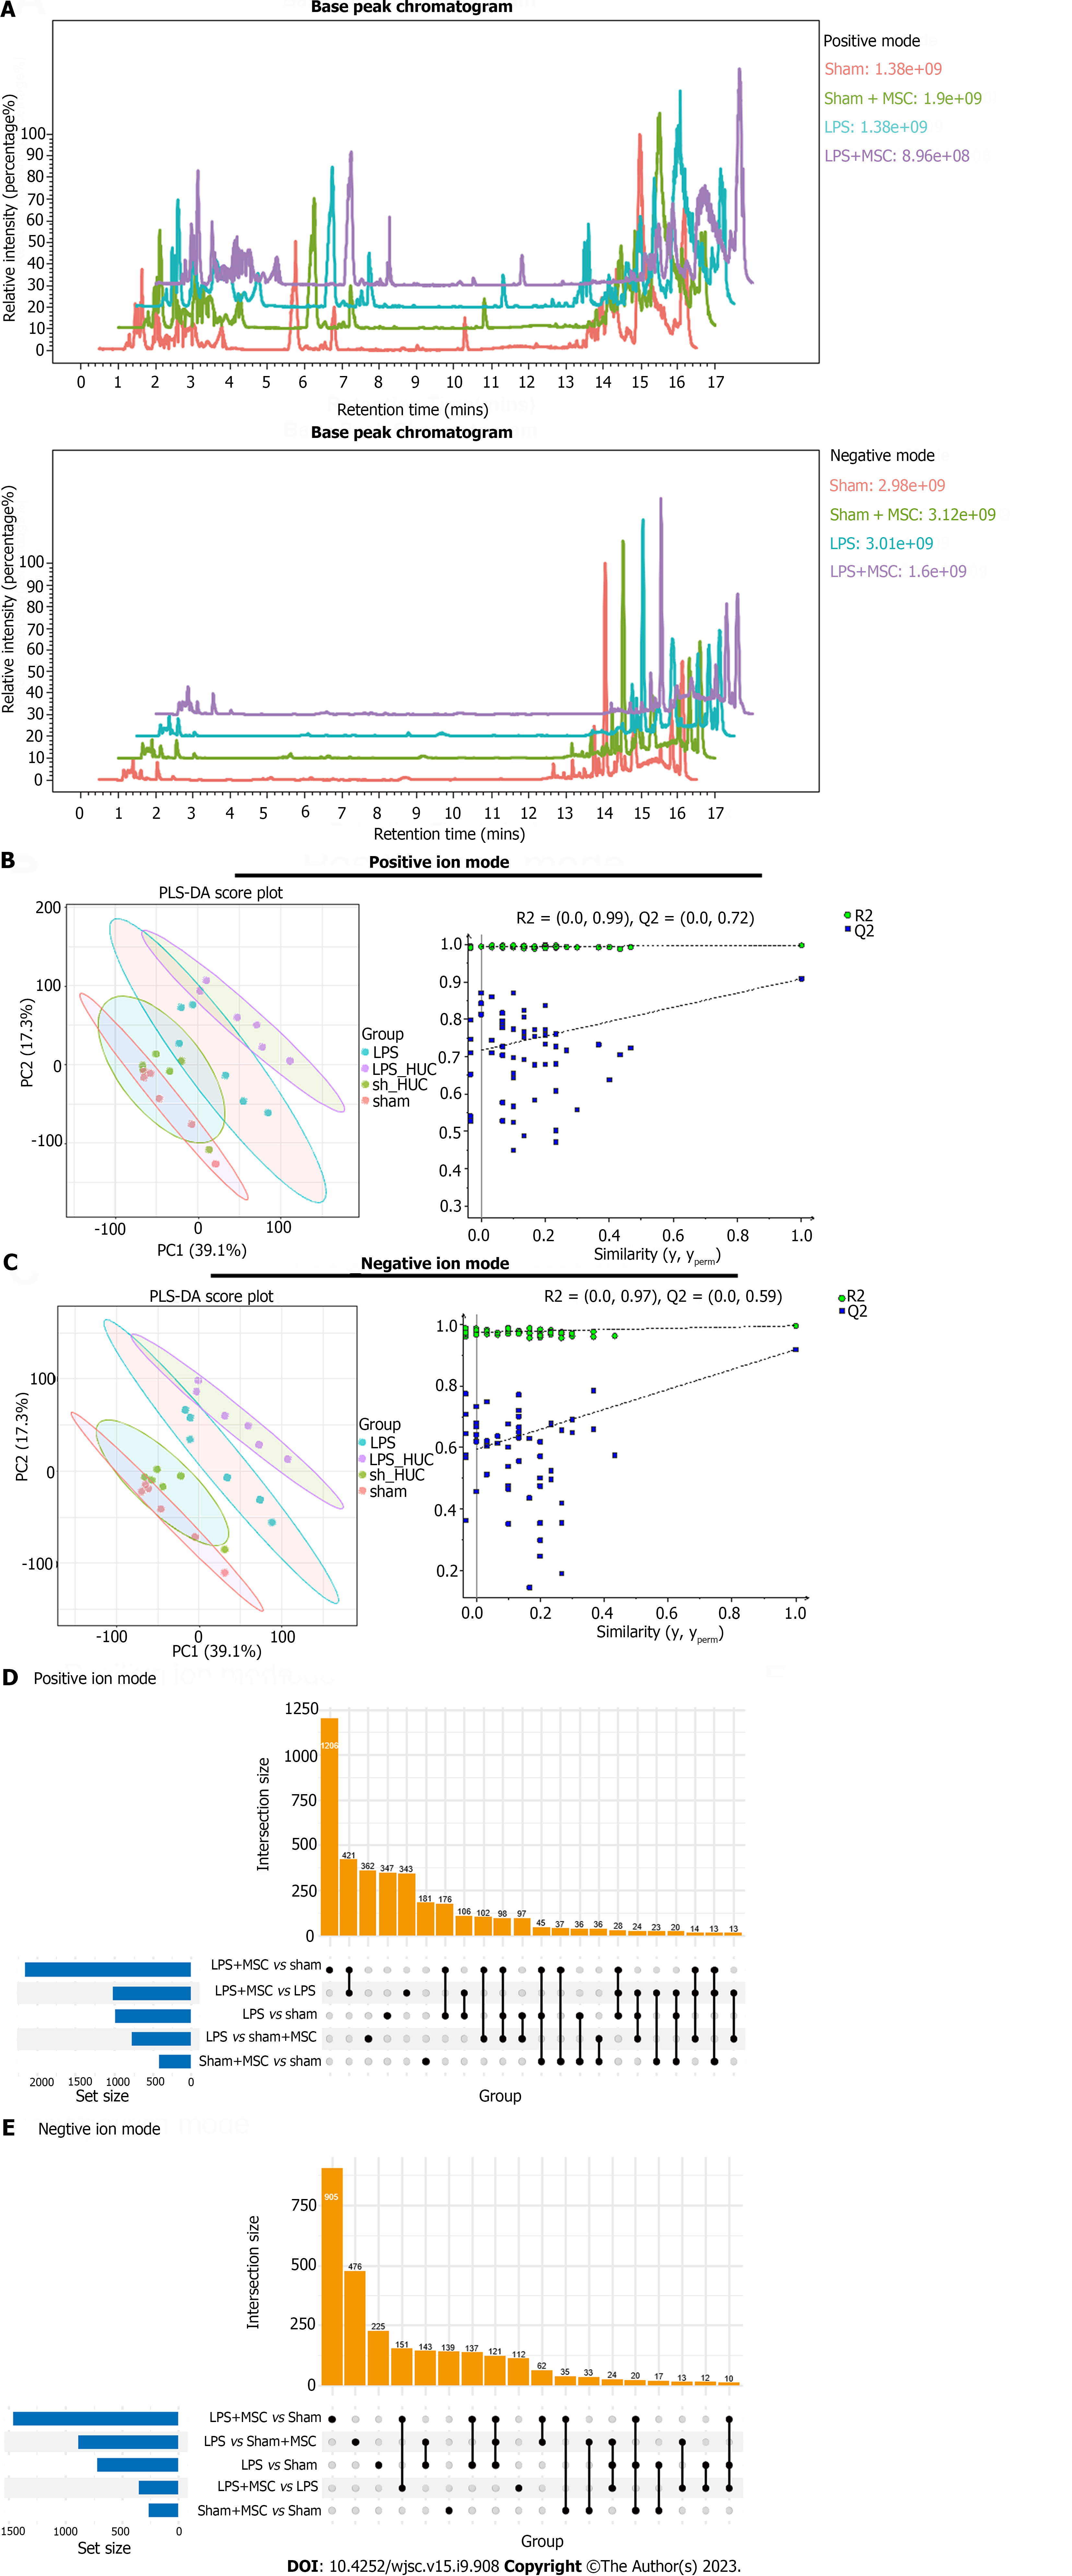
Figure 7 Metabolomics for the lung (n = 6).
A: Base peak chromatogram in positive/negative mode; B and C: The Partial Least Squares-Discriminant Analysis was used to distinguish metabolite differences between groups in positive/negative mode; D and E: Upset Venn diagrams were used to count the number of common and unique differential metabolites in different groups. The bar chart at the bottom left represents the total number of differential metabolites between two groups. The bar chart above shows common metabolites. The results are based on mass spectrum analysis data. LPS: Lipopolysaccharide; MSC: Mesenchymal stem cell.
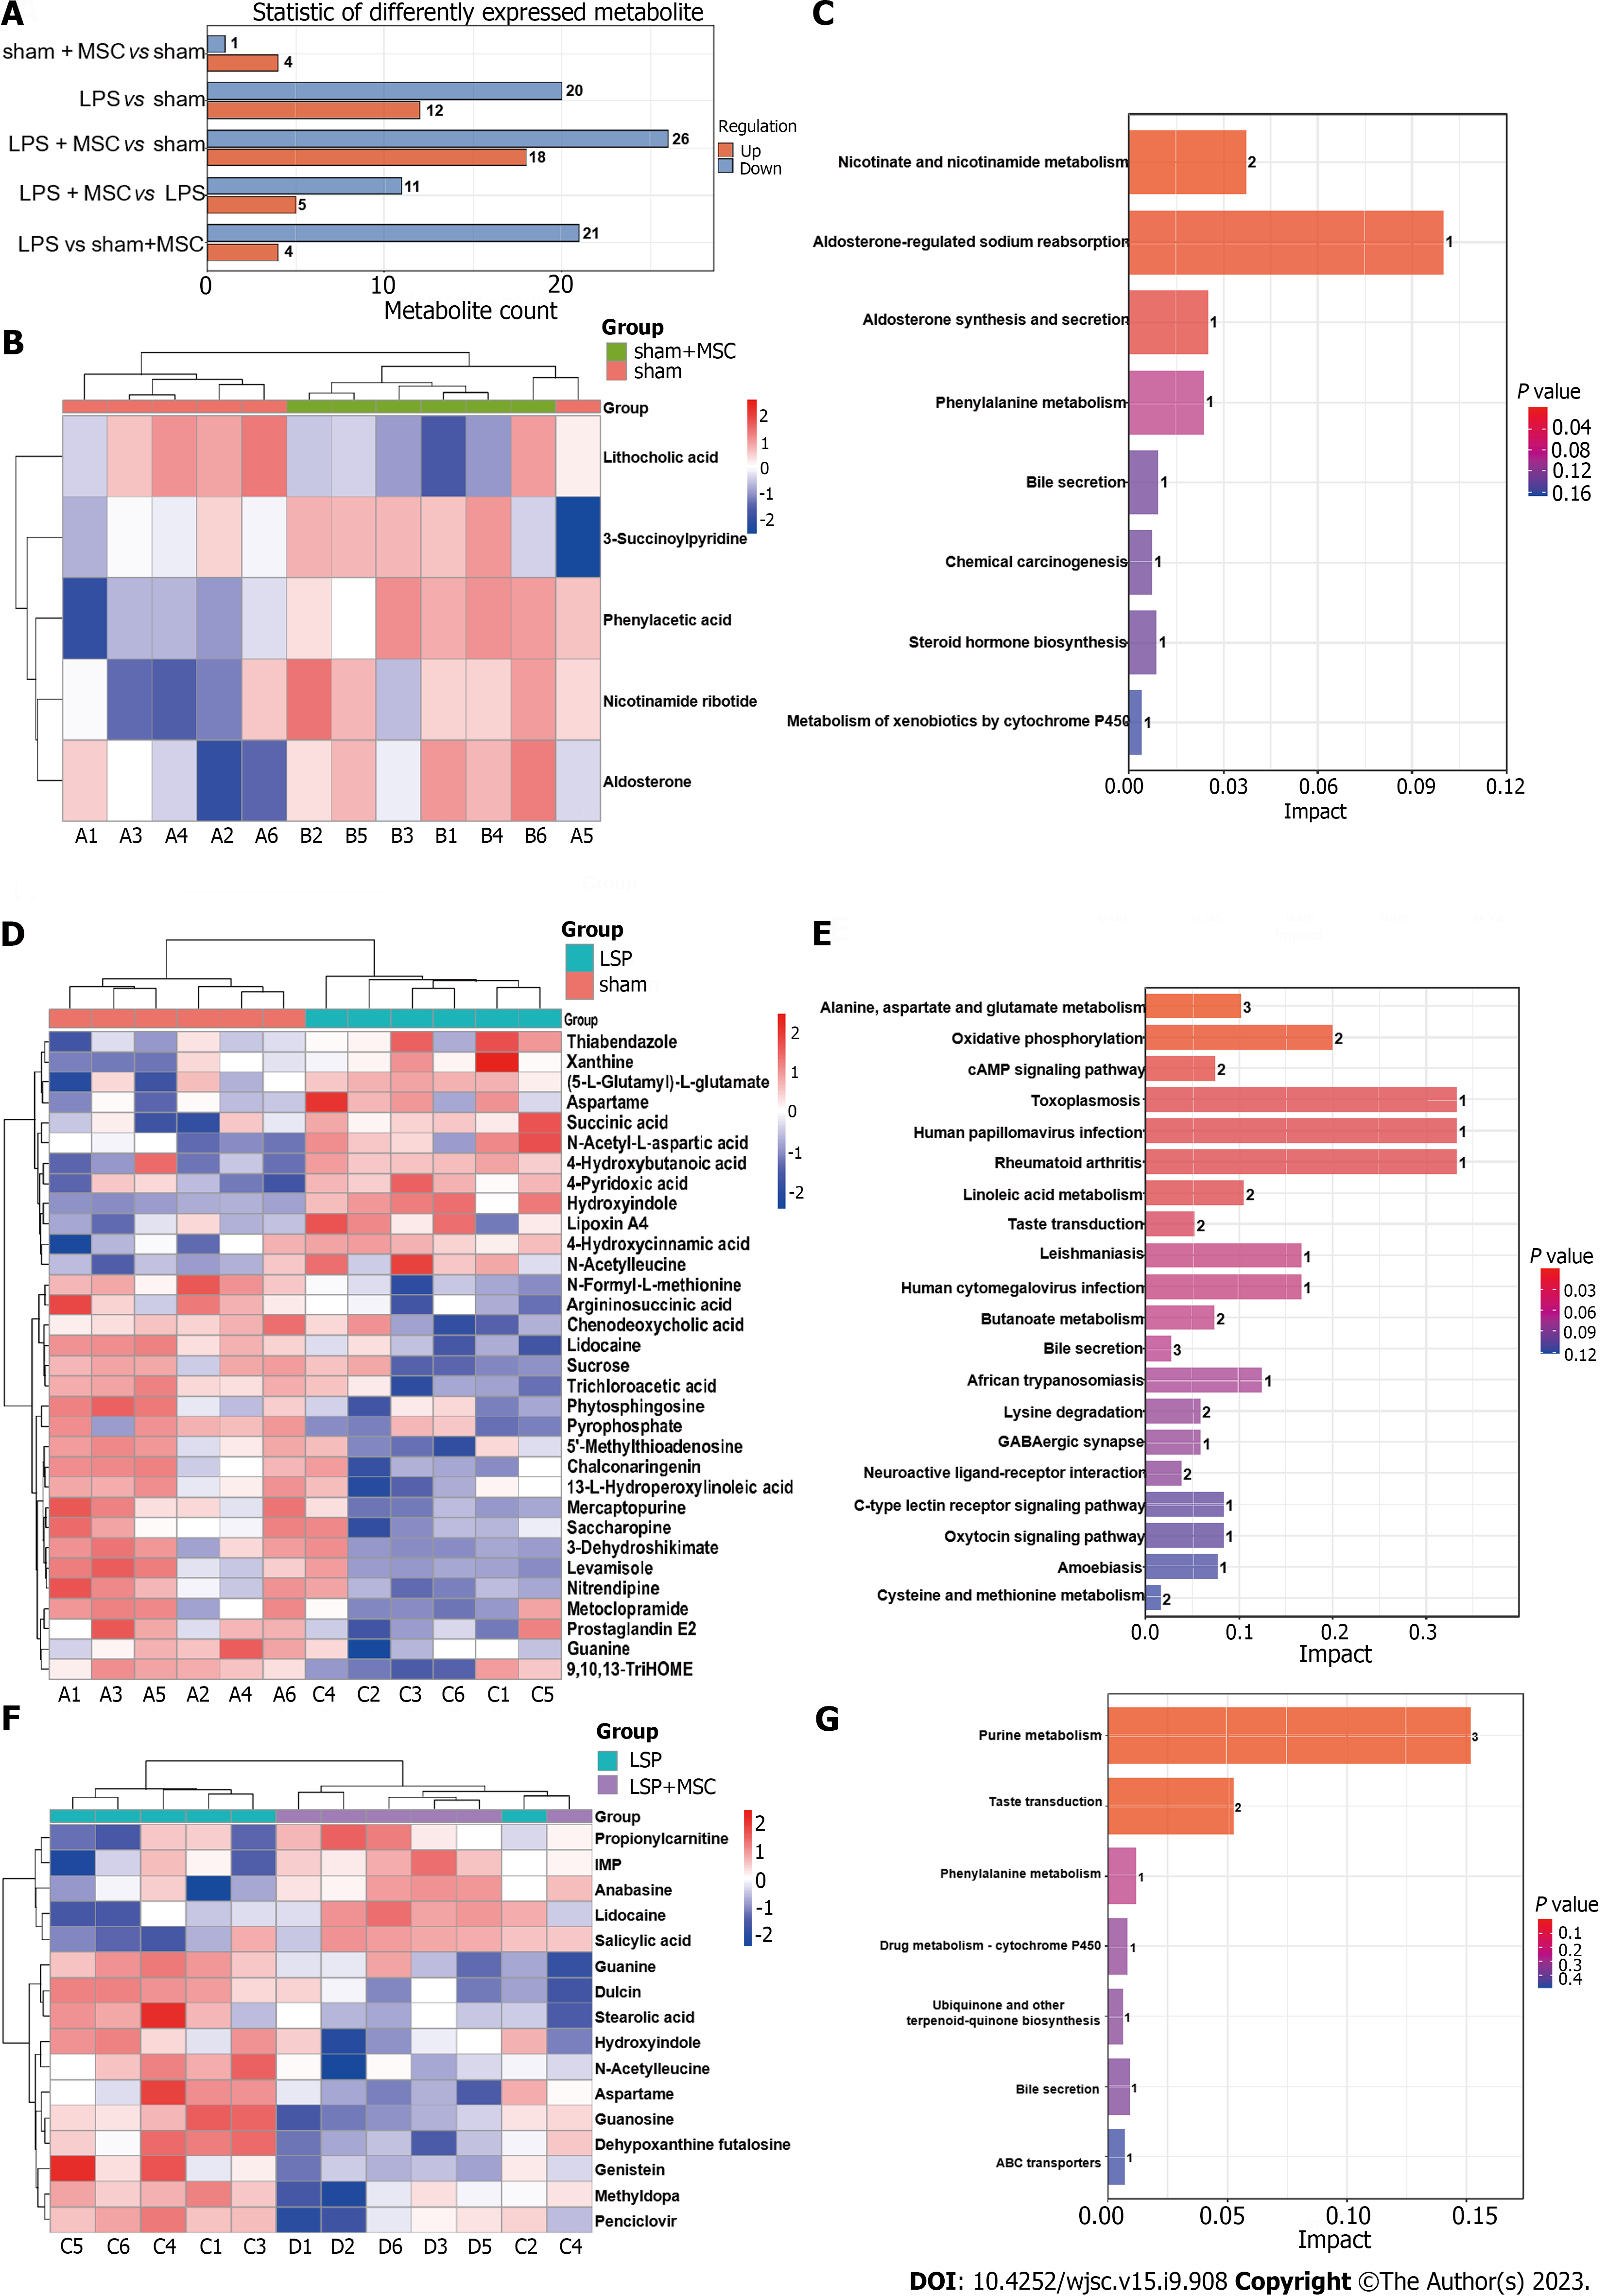
Figure 8 Screening of differently expressed metabolites in acute lung injury mice treated with human umbilical cord mesenchymal stem cells (n = 6).
A: Statistic of differently expressed metabolites under liquid chromatography-tandem mass spectrometry mode; B: Heatmaps of sham + mesenchymal stem cells (MSCs) group vs sham group; C: Kyoto Encyclopedia of Genes and Genomes (KEGG) pathways enriched by differently expressed metabolites of sham + MSC group vs sham group; D: The lipopolysaccharide (LPS) group vs sham group were used to analyze and display differently expressed metabolites; E: KEGG pathway enriched by differently expressed metabolites of LPS group vs sham group; F: Heatmaps of LPS group vs LPS + MSC group; G: KEGG pathways enriched by differently expressed metabolites of sham + MSC group vs sham group. LPS: Lipopolysaccharide; MSC: Mesenchymal stem cell.
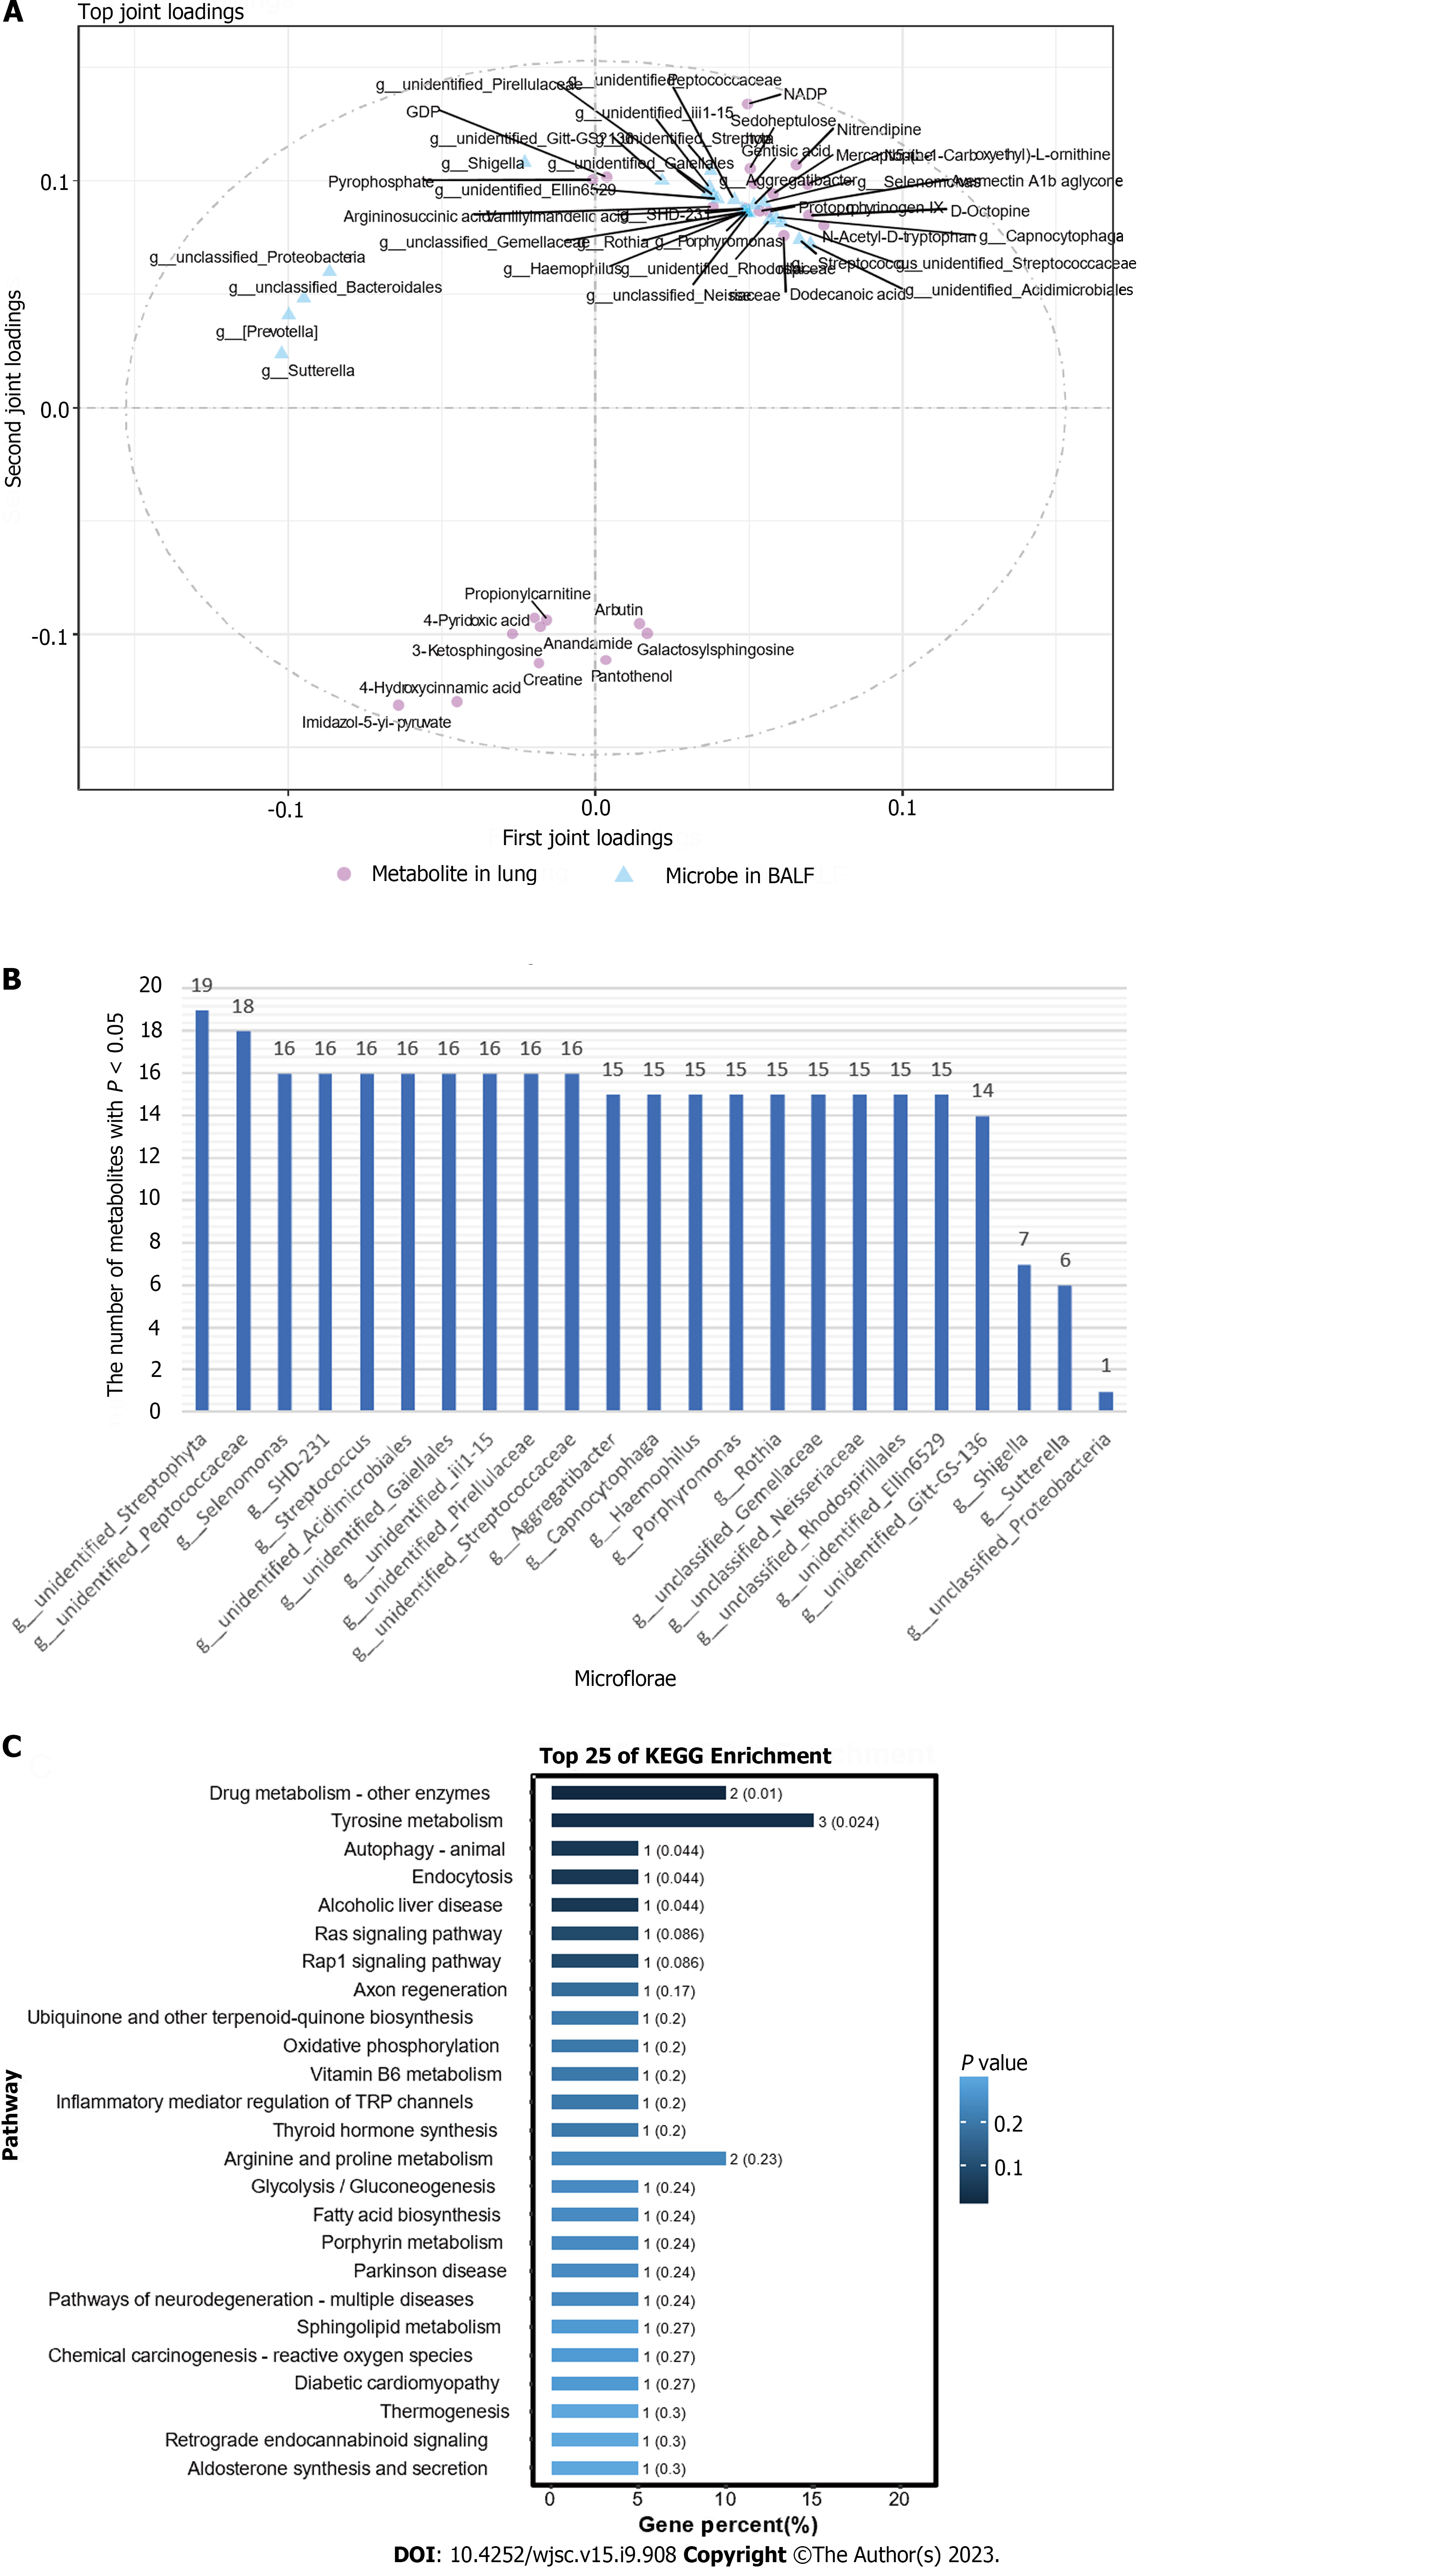
Figure 9 Extent of correlation between lung metabolites and bronchoalveolar lavage fluid microflorae.
A: Top 25 lung metabolites and top 25 bronchoalveolar lavage fluid (BALF) microflorae were analyzed by the two-way Orthogonal Partial Least Squares analysis. A larger absolute value in a coordinate indicates a greater degree of association. Circles represent metabolites in lung tissues and squares represent microflora in BALF; B: The number of lung metabolites which were related with BALF microflorae; C: Kyoto Encyclopedia of Genes and Genomes enrichment analysis of top 25 BALF microflorae with strong association. KEGG: Kyoto Encyclopedia of Genes and Genomes; BALF: Bronchoalveolar lavage fluid.
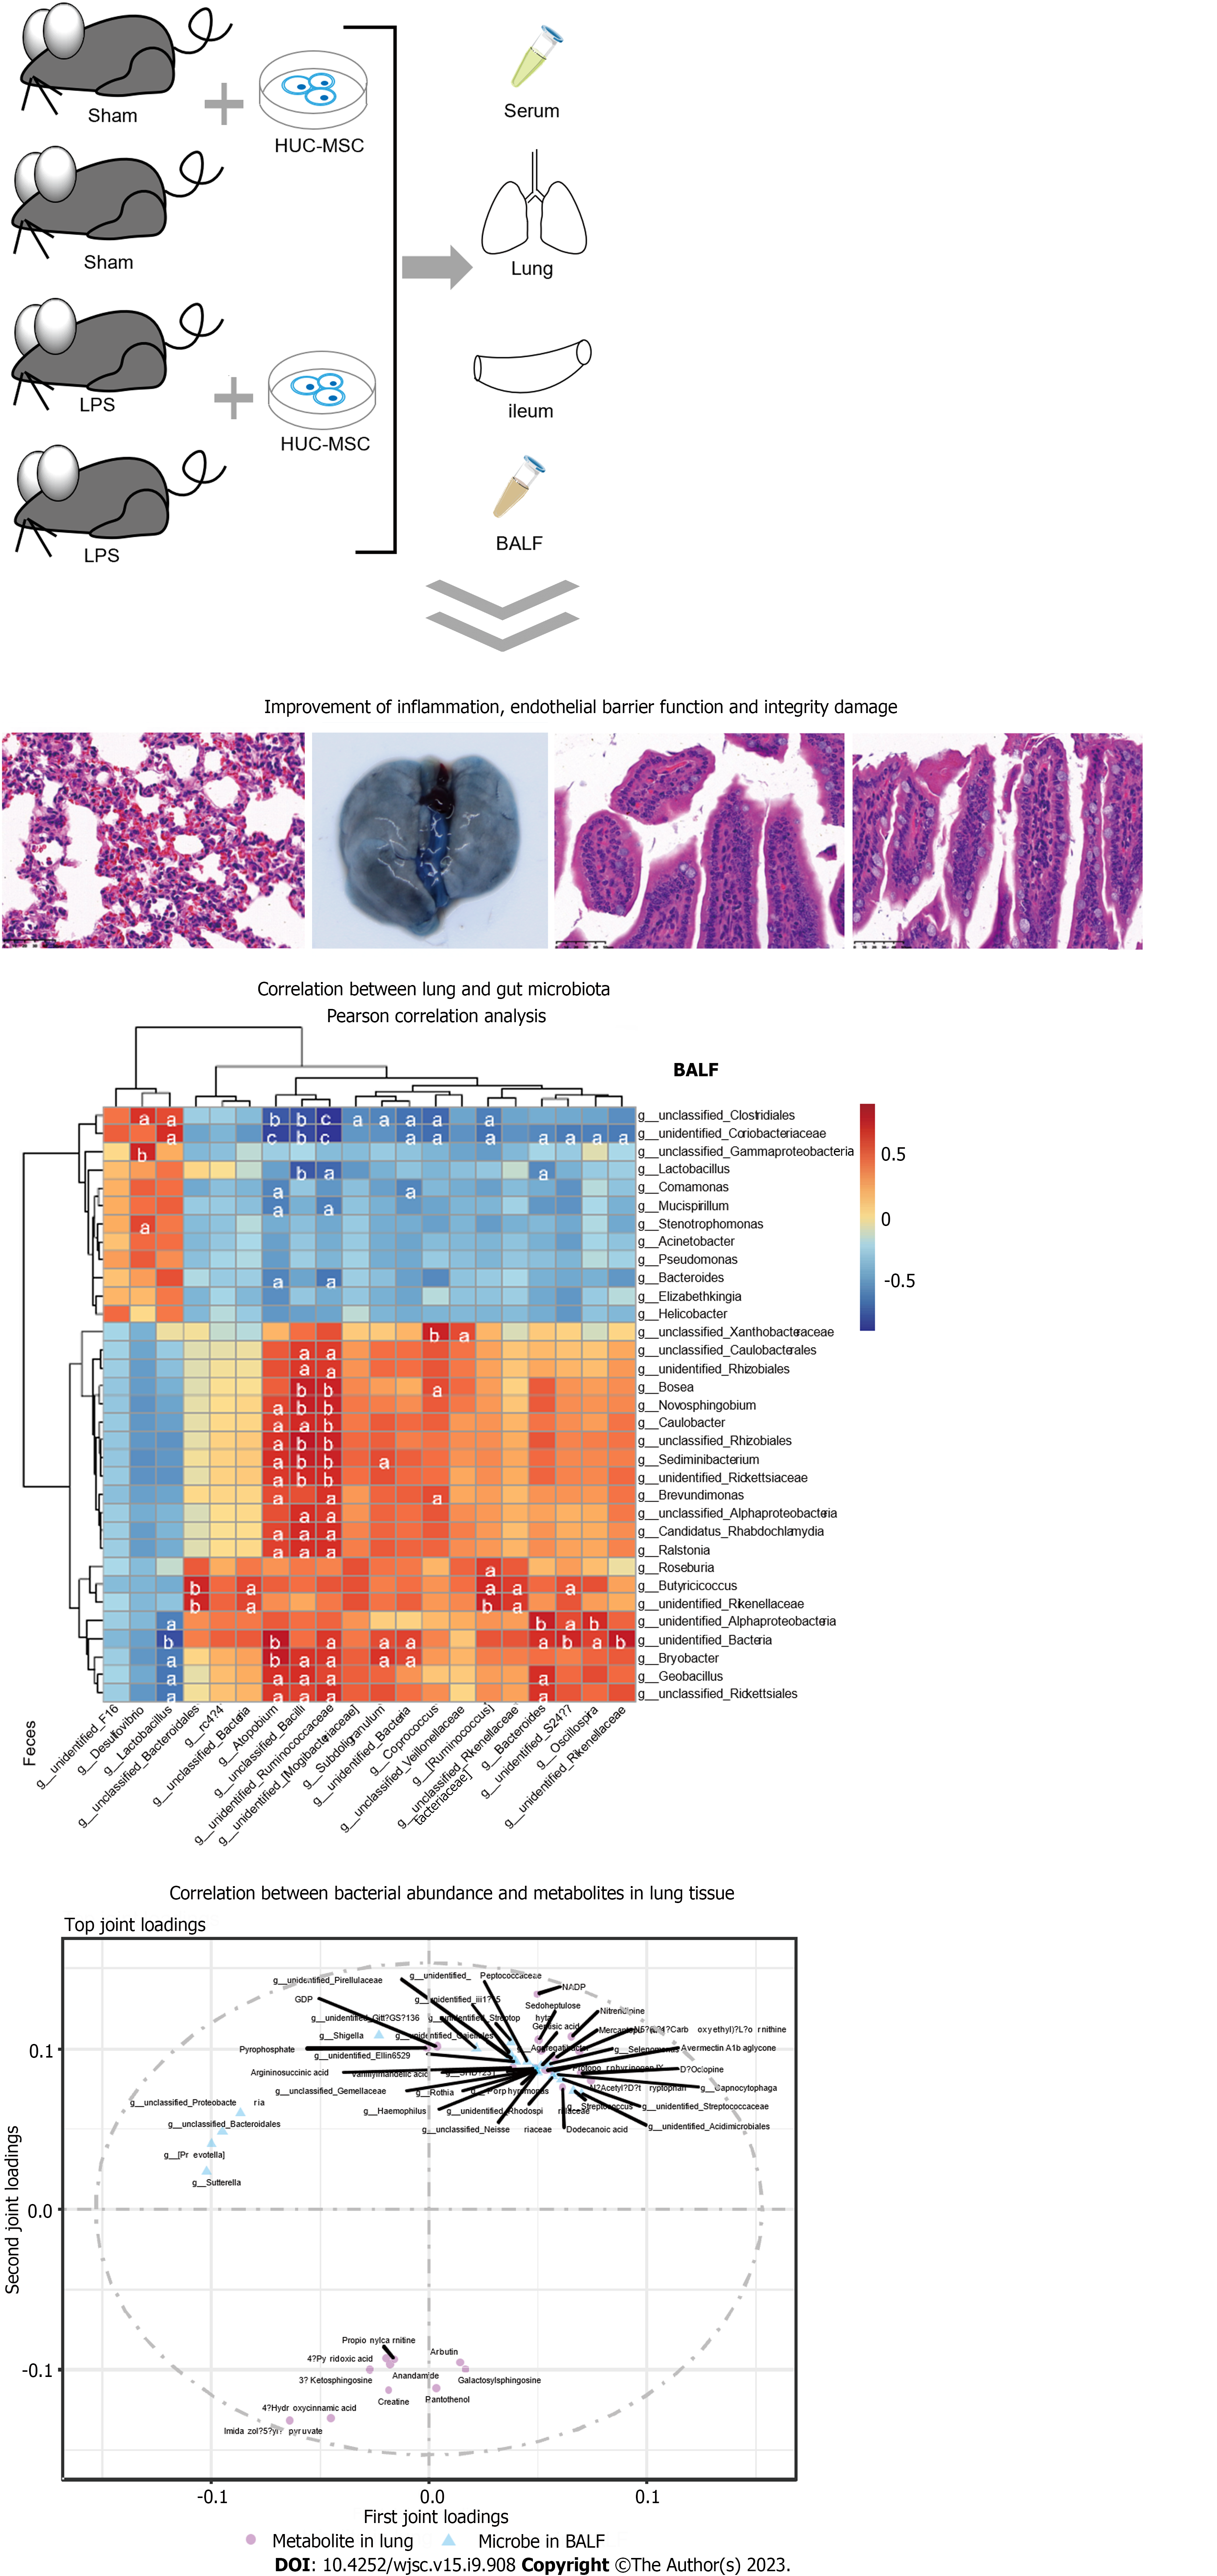
Figure 10 Graphical abstract.
LPS: Lipopolysaccharide; MSC: Mesenchymal stem cell; BALF: Bronchoalveolar lavage fluid.
- Citation: Lv L, Cui EH, Wang B, Li LQ, Hua F, Lu HD, Chen N, Chen WY. Multiomics reveal human umbilical cord mesenchymal stem cells improving acute lung injury via the lung-gut axis. World J Stem Cells 2023; 15(9): 908-930
- URL: https://www.wjgnet.com/1948-0210/full/v15/i9/908.htm
- DOI: https://dx.doi.org/10.4252/wjsc.v15.i9.908


