©The Author(s) 2023.
World J Stem Cells. Mar 26, 2023; 15(3): 90-104
Published online Mar 26, 2023. doi: 10.4252/wjsc.v15.i3.90
Published online Mar 26, 2023. doi: 10.4252/wjsc.v15.i3.90
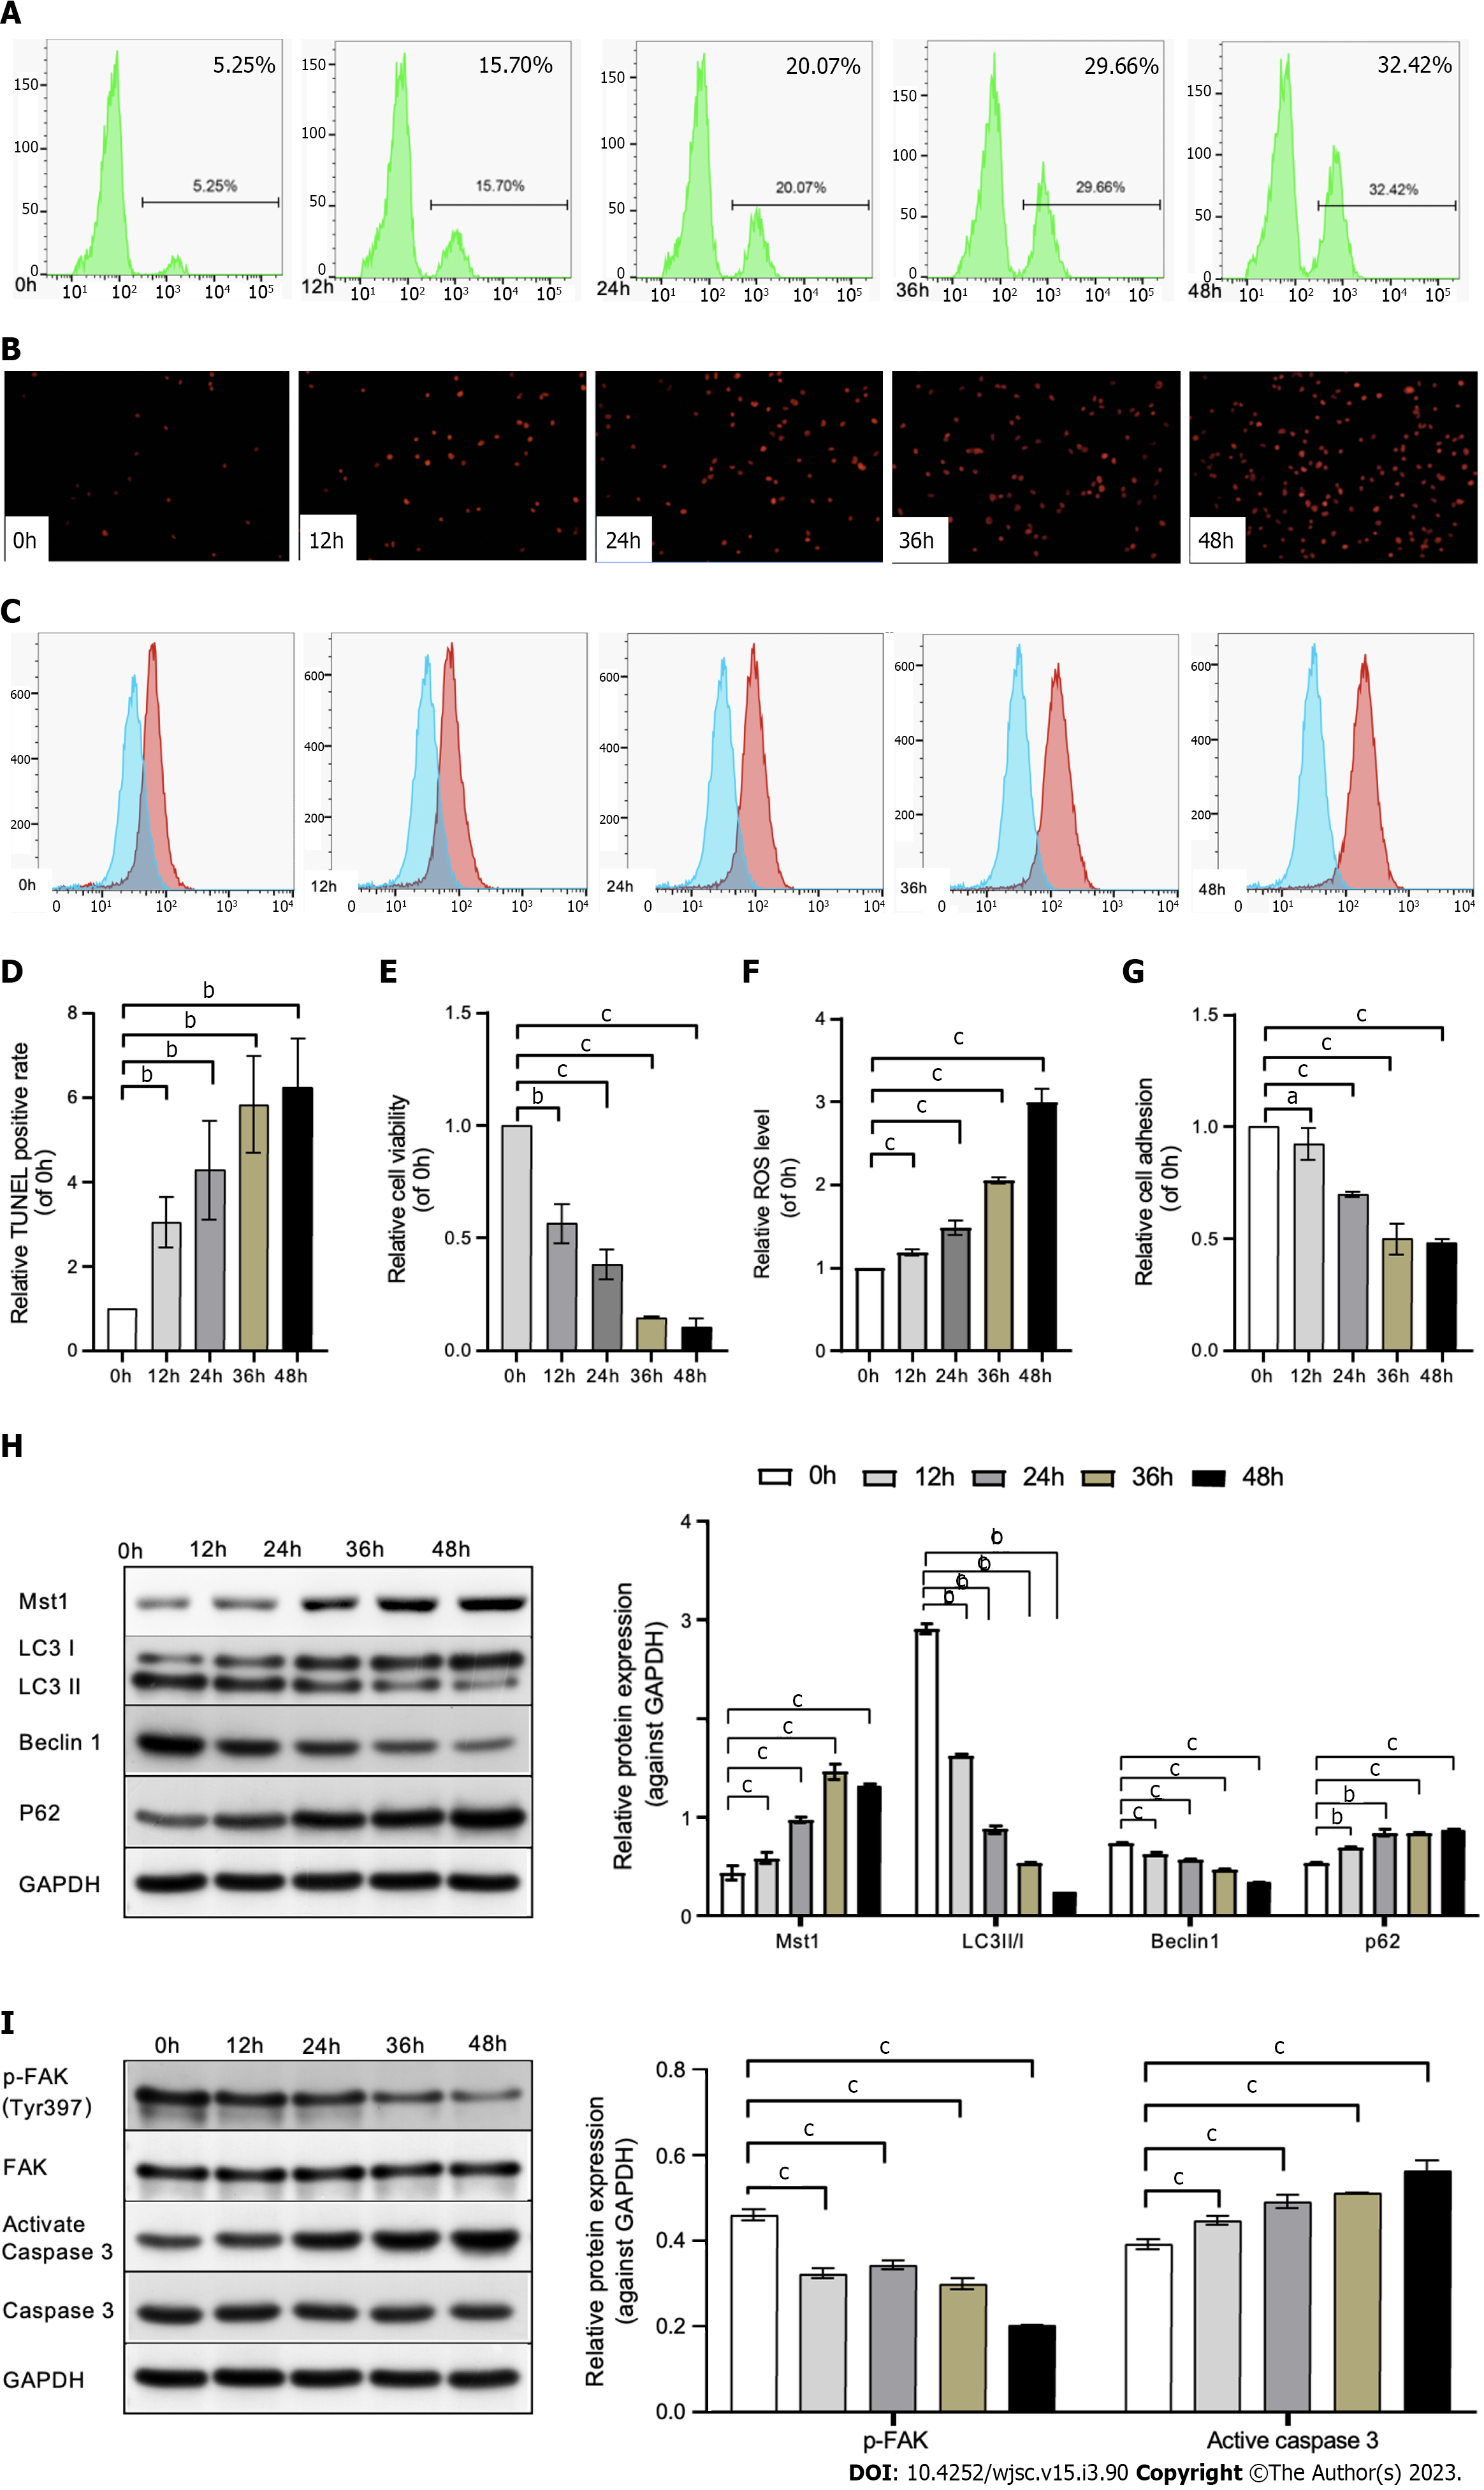
Figure 1 Mouse bone marrow mesenchymal stem cells exhibit susceptibility to anoikis under detachment conditions.
A: Terminal-deoxynucleoitidyl Transferase Mediated Nick End Labeling (TUNEL)-positive cells (apoptotic cells) of mouse bone marrow mesenchymal stem cells (mBMSCs) cultured in precoated Poly-2-hydroxyethyl methacrylate conditions for 0 h, 12 h, 24 h, 36 h and 48 h using flow cytometry; B: Fluorescence staining images of dead cells; C: Reactive oxygen species (ROS) levels were measured using the ROS probe 2,7-Dichlorodihydrofluorescein diacetate by flow cytometry at 0 h, 12 h, 24 h, 36 h and 48 h; D: Quantitative analysis of the rate of TUNEL-positive cells; E: Quantification of live cells using a thiazolyl blue tetrazolium bromide assay; F: Quantitative analysis of the intracellular ROS level; G: Cell adhesion was expressed as fold changes between 0 h groups; H and I: Mammalian Ste20-like kinase 1 (Mst1), microtubules associated protein 1 light chain 3 II/I, p62, Beclin1, phospho-focal adhesion kinase, and activated caspase 3 expression levels at 0 h, 12 h, 24 h, 36 h and 48 h were evaluated by Western blot analysis; The expression of protein was expressed as the fold change relative to glyceraldehyde-3-phosphate dehydrogenase. Values are the mean ± SD of three independent experiments in each case. TUNEL: Terminal-deoxynucleoitidyl Transferase Mediated Nick End Labeling; ROS: Reactive oxygen species; Mst1: Mammalian Ste20-like kinase 1; LC3-II/I: Microtubules associated protein 1 light chain 3 II/I; p-FAK: Phospho-focal adhesion kinase; GAPDH: Glyceraldehyde-3-phosphate dehydrogenase. cP < 0.01; bP < 0.05; aP > 0.05.
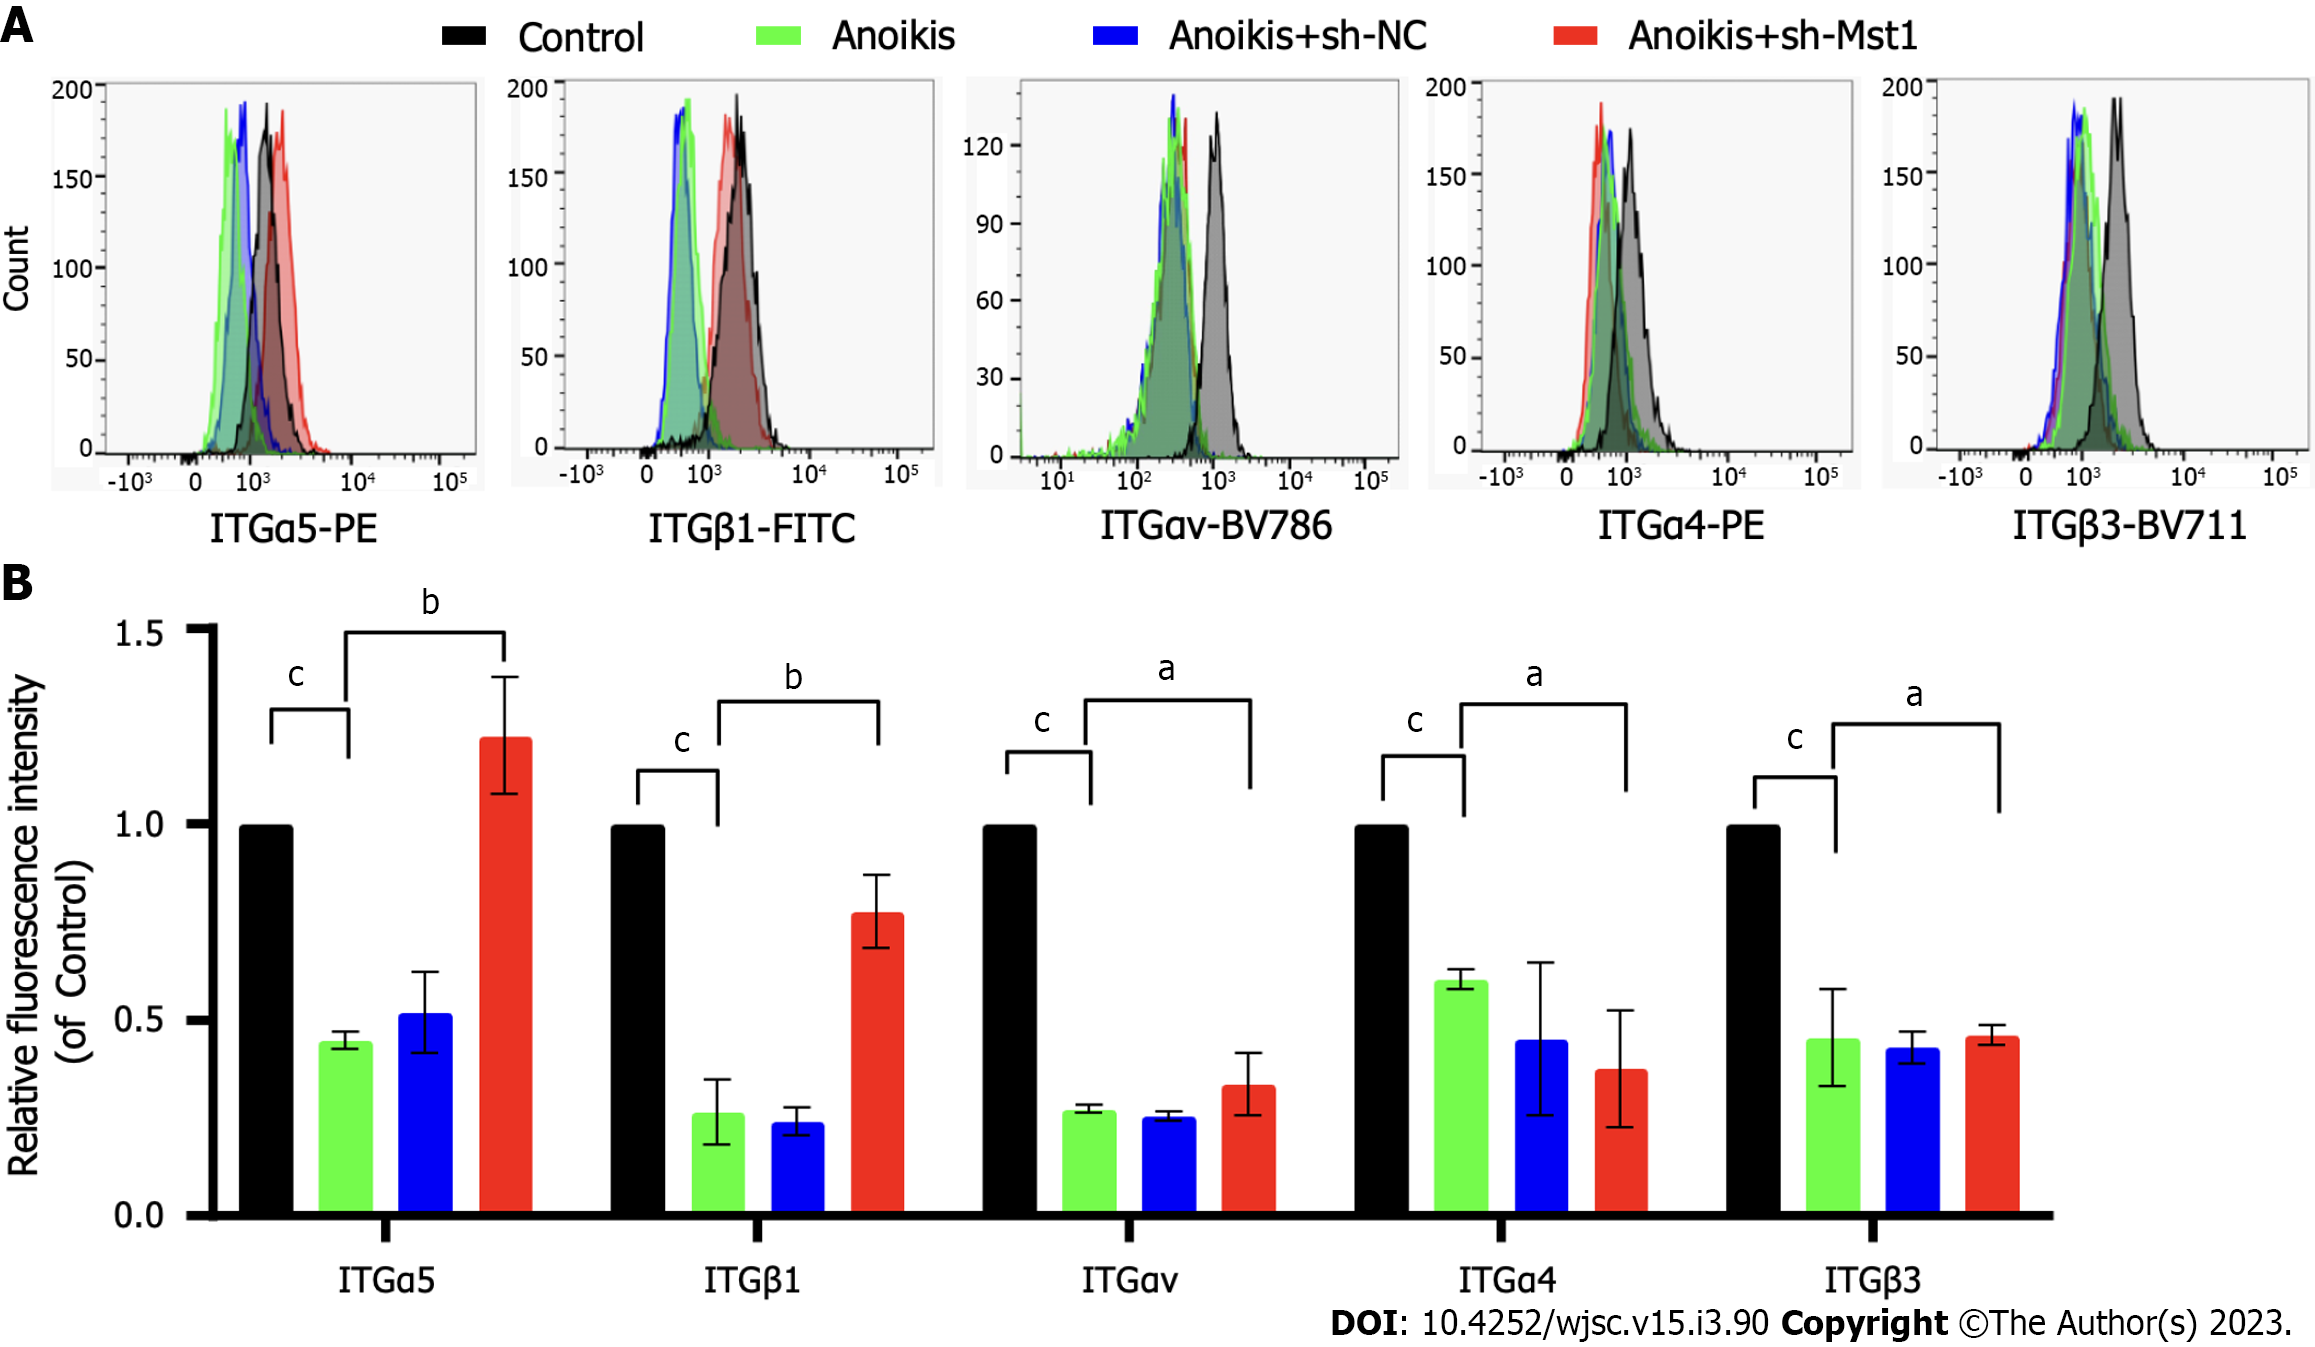
Figure 2 Changes in integrin protein expression in detached mouse bone marrow mesenchymal stem cells/sh-Mammalian Ste20-like kinase 1.
Cells were cultured in detached conditions for 36 h. A: Flow cytometry analysis investigating the expression of integrinα5 (ITGα5), ITGαv, ITGα4, ITGβ1 and ITGβ3; B: Data are expressed as the fold change compared to the control groups. Values are expressed as the mean ± SD, n = 3. ITG: Integrin. cP < 0.01; bP < 0.05; aP > 0.05.
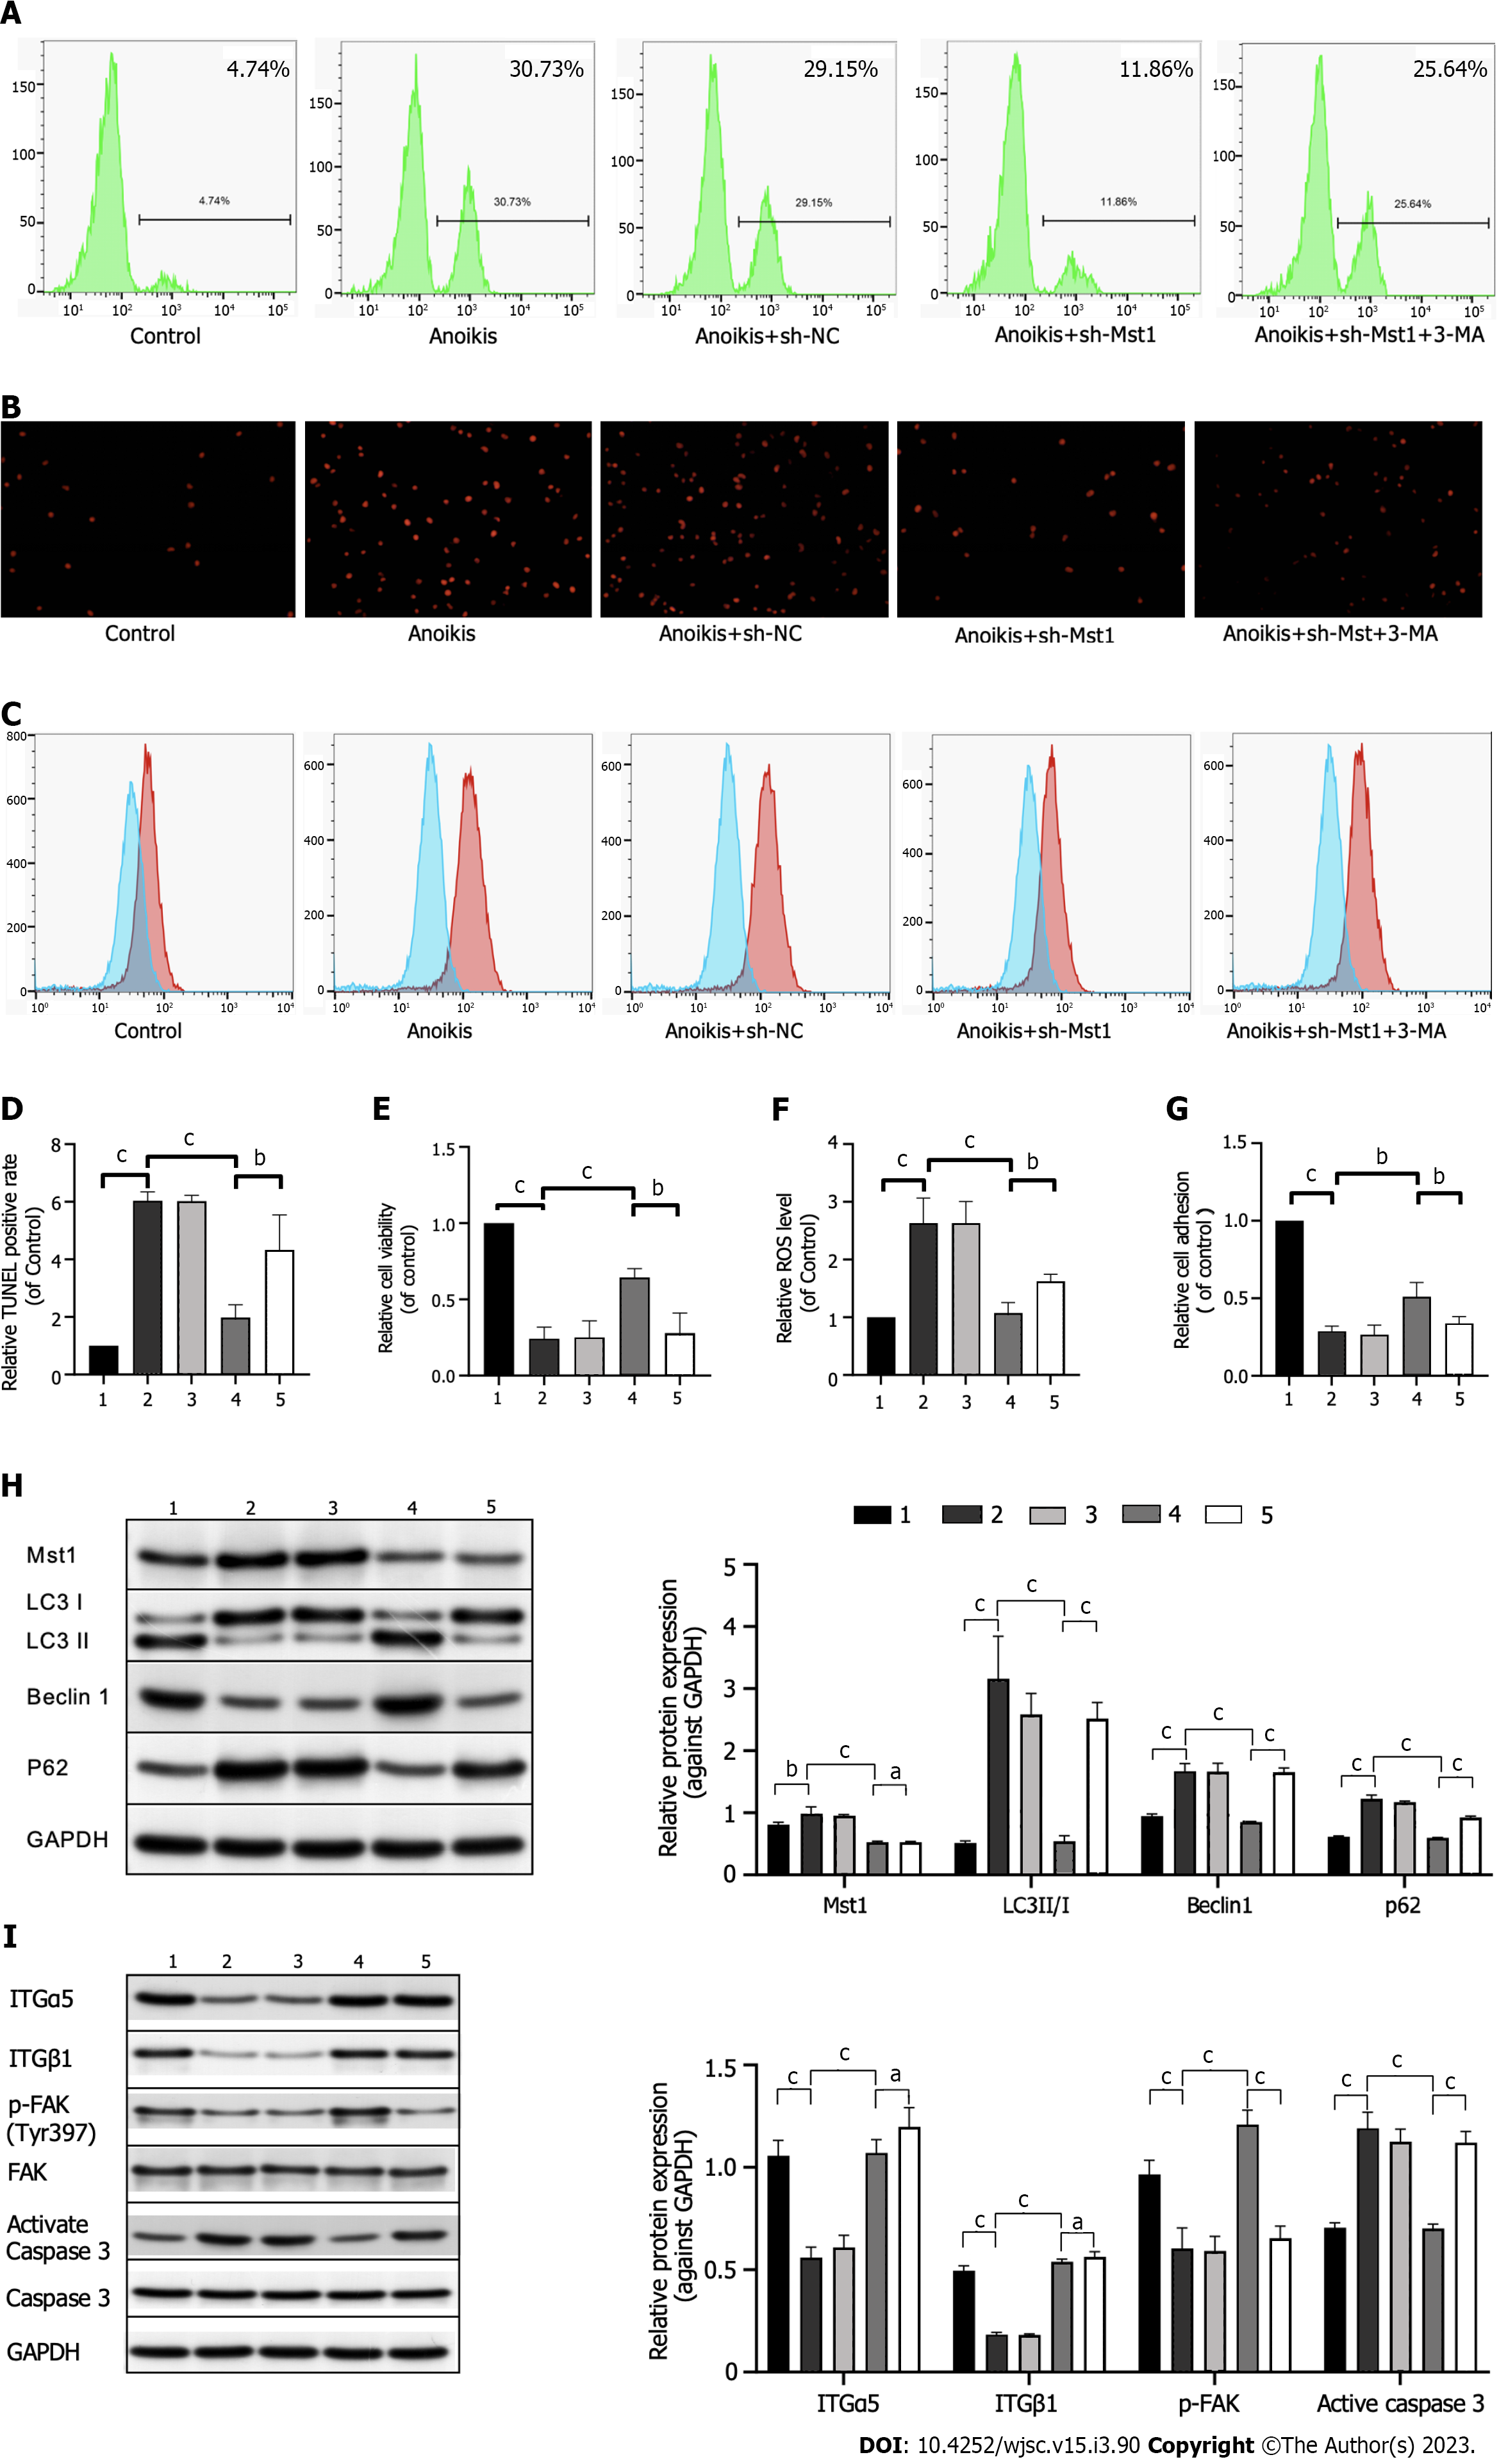
Figure 3 Mammalian Ste20-like kinase 1 inhibition-induced autophagy reduced cell apoptosis in detached mouse bone marrow mesenchymal stem cells.
A: Terminal-deoxynucleoitidyl Transferase Mediated Nick End Labeling (TUNEL)-positive cells analysed by flow cytometry; B: Representative images and quantification of fluorescence staining of dead cells; C: Reactive oxygen species (ROS) levels were measured using the ROS probe 2,7-Dichlorodihydrofluorescein diacetate by flow cytometry. D: Quantitative analysis of the rate of TUNEL-positive cells. E: Quantification of live cells using a thiazolyl blue tetrazolium bromide assay. F: Quantitative analysis of the intracellular ROS level. G: Cell adhesion was evaluated as the fold change compared back to the control groups; H and I: Mammalian Ste20-like kinase 1 (Mst1), microtubules associated protein 1 light chain 3 II/I, p62, Beclin1, phospho-focal adhesion kinase, and activated caspase 3 expression were evaluated by Western blot analysis. glyceraldehyde-3-phosphate dehydrogenase served as a control. Values are the mean ± SD, and experiments were completed in triplicate. 3-MA: 3-methyladenine; TUNEL: Terminal-deoxynucleoitidyl Transferase Mediated Nick End Labeling; ROS: Reactive oxygen species; Mst1: Mammalian Ste20-like kinase 1; LC3-II/I: Microtubules associated protein 1 light chain 3 II/I; p-FAK: Phospho-focal adhesion kinase; GAPDH: Glyceraldehyde-3-phosphate dehydrogenase. 1. Control group; 2. Anoikis group; 3. Anoikis + sh-NC group; 4. Anoikis + sh-Mst1 group; 5. Anoikis + sh-Mst1 + 3-MA group. cP < 0.01; bP < 0.05; aP > 0.05.
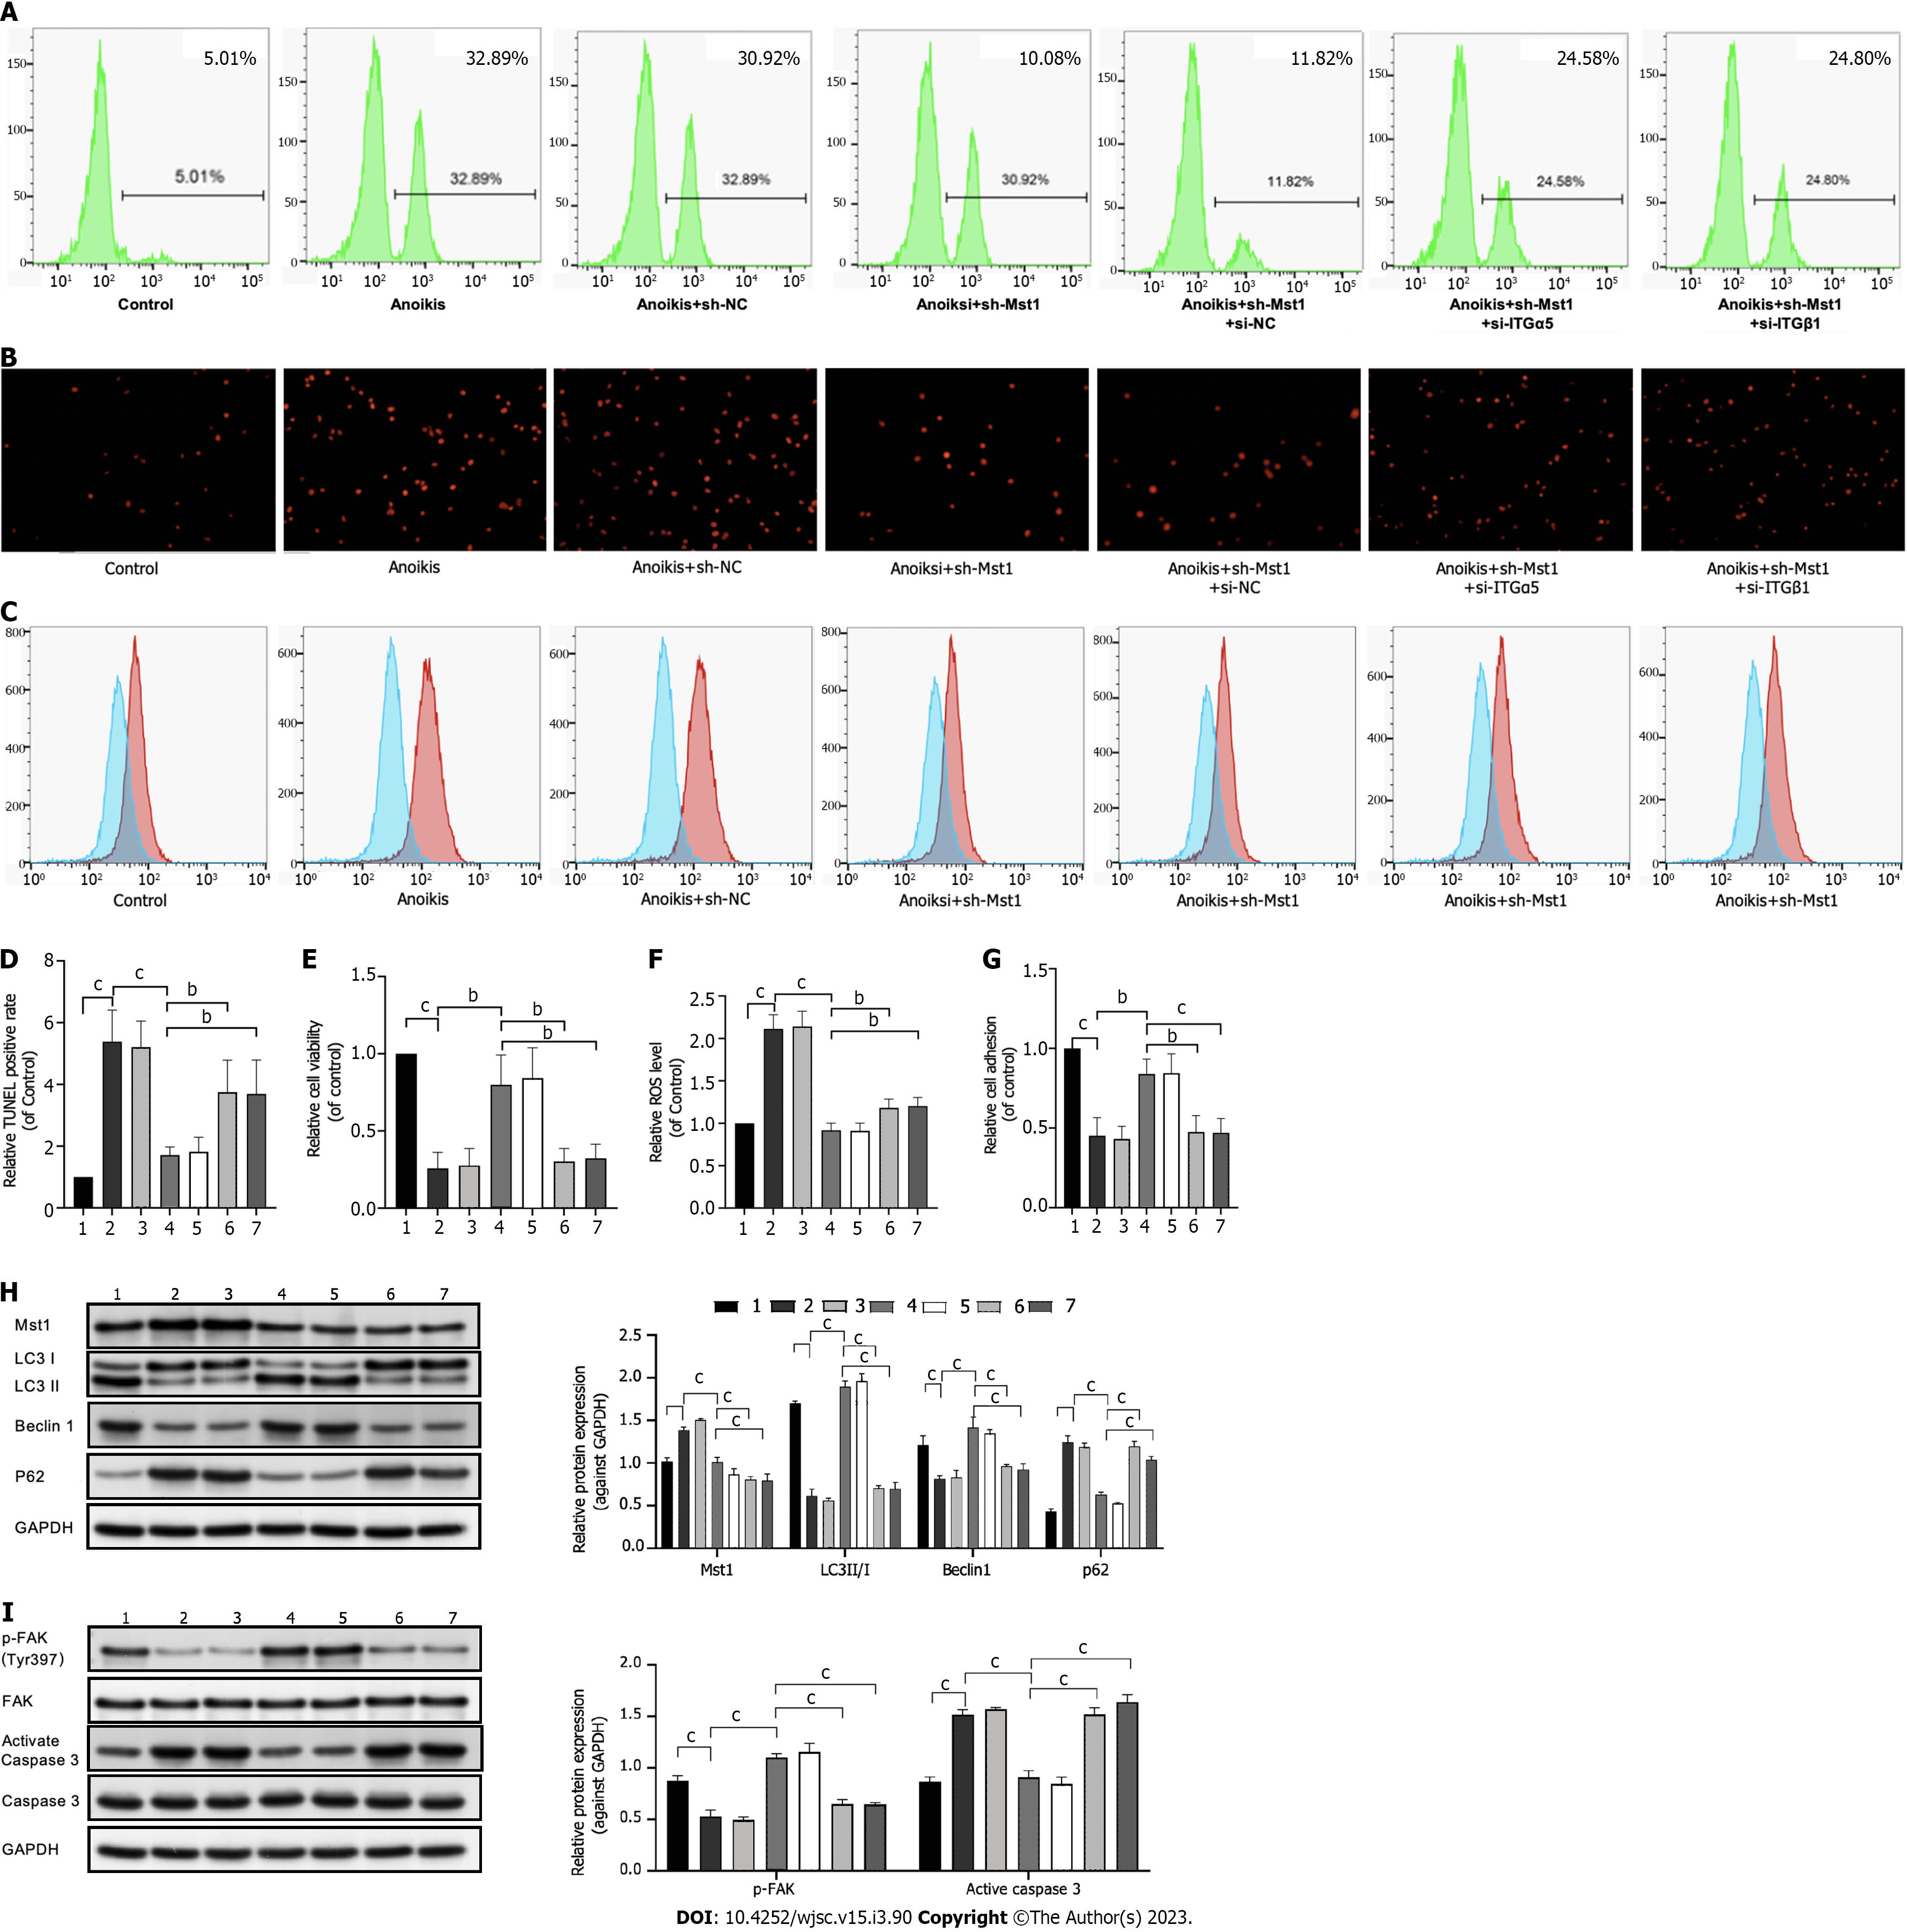
Figure 4 Upregulated integrinα5β1 expression triggered by Mammalian Ste20-like kinase 1 inhibition protected mouse bone marrow mesenchymal stem cells from anoikis.
A: Terminal-deoxynucleoitidyl Transferase Mediated Nick End Labeling (TUNEL)-positive cells analysed by flow cytometry; B: Representative images and quantification of fluorescence staining of dead cells; C: Reactive oxygen species (ROS) levels were measured by flow cytometry; D: Quantitative analysis of the rate of TUNEL-positive cells; E: Quantification of live cells using a thiazolyl blue tetrazolium bromide assay; F: Quantitative analysis of the intracellular ROS level; G: Cell adhesion was evaluated as the fold change compared back to the control groups; H and I: Western blotting was used to measure the expression levels of Mammalian Ste20-like kinase 1 (Mst1), microtubules associated protein 1 light chain 3 II/I, p62, Beclin1, phospho-focal adhesion kinase, and activated caspase 3. glyceraldehyde-3-phosphate dehydrogenase was used as the loading control. Values are expressed as the mean ± SD. Measurements were performed in three replicates. 3-MA: 3-methyladenine; TUNEL: Terminal-deoxynucleoitidyl Transferase Mediated Nick End Labeling; ROS: Reactive oxygen species; Mst1: Mammalian Ste20-like kinase 1; LC3-II/I: Microtubules associated protein 1 light chain 3 II/I; p-FAK: Phospho-focal adhesion kinase; GAPDH: Glyceraldehyde-3-phosphate dehydrogenase. 1. Control group; 2. Anoikis group; 3. Anoikis + sh-NC group; 4. Anoikis + sh-Mst1 group; 5. Anoikis + sh-Mst1 + si-NC group; 6. Anoikis + sh-Mst1 + si-ITGα5; 7. Anoikis + sh-Mst1 + si-ITGβ1. cP < 0.01; bP < 0.05; aP > 0.05.
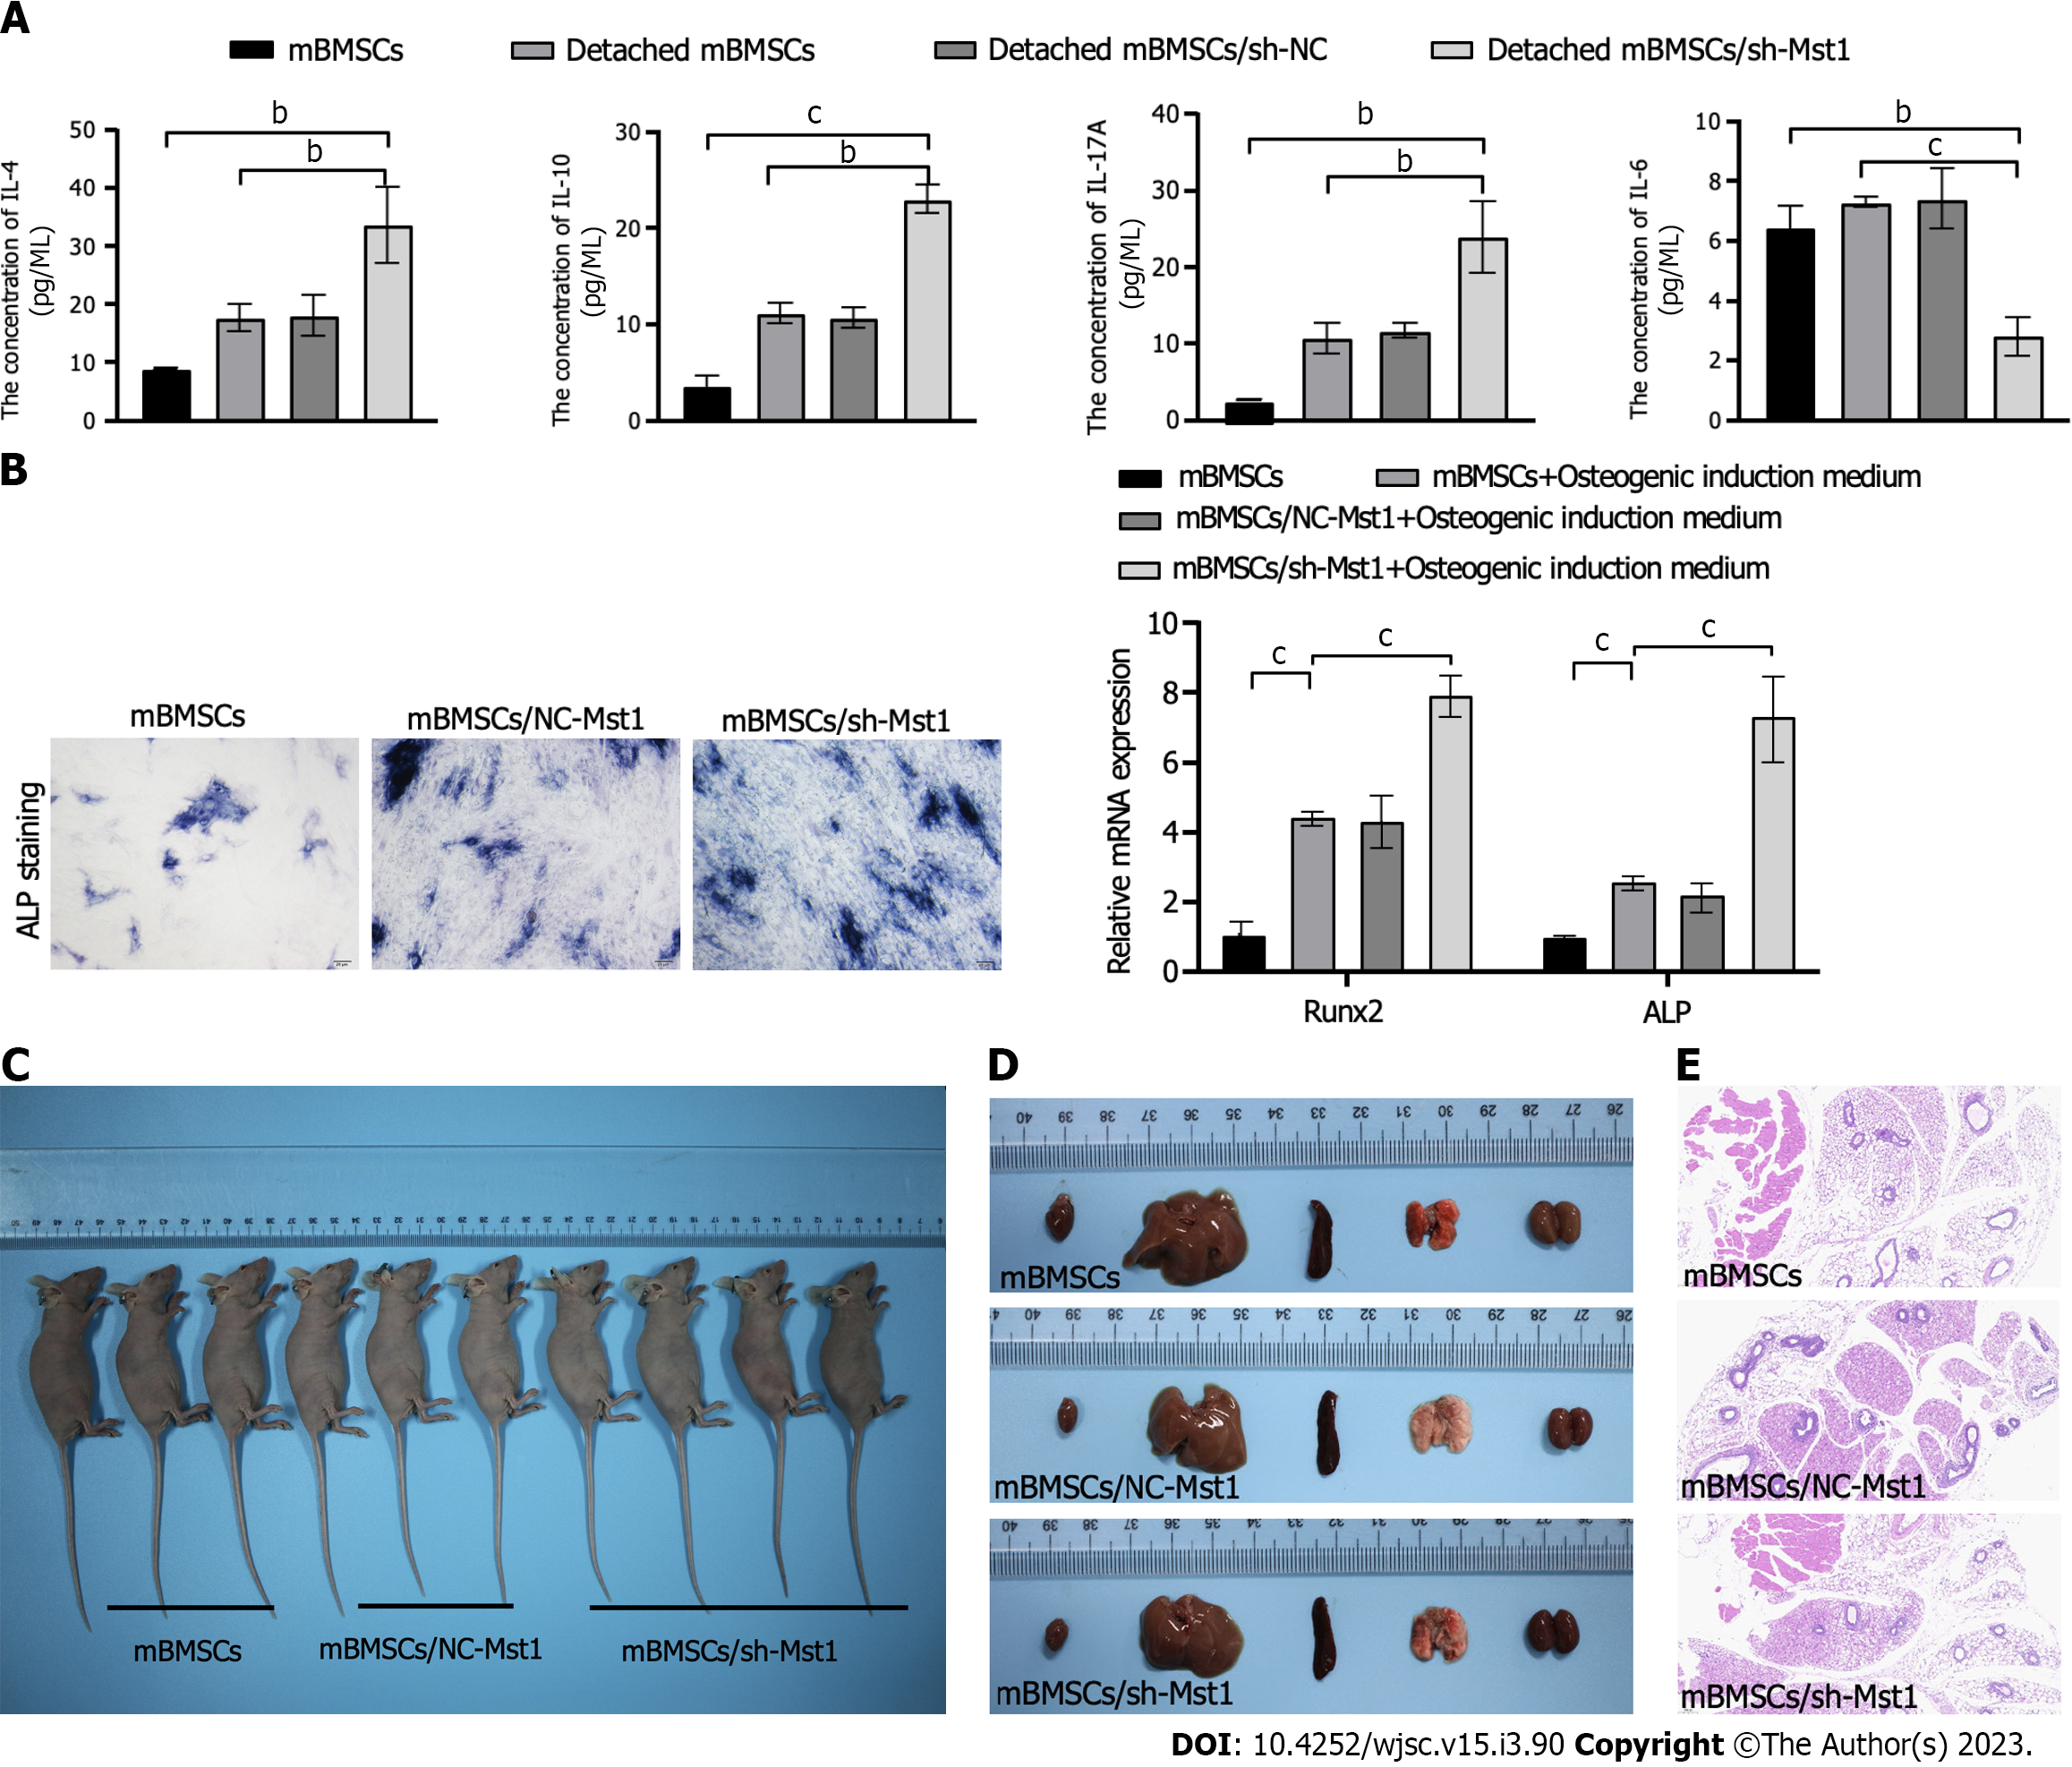
Figure 5 The properties and biological safety of mouse bone marrow mesenchymal stem cells/sh-Mammalian Ste20-like kinase 1.
A: The levels of interleukin-4 (IL-4), IL-10, IL-17A and IL-6 were measured using a Cytometric Bead Array Cytokine Kit in detached mouse bone marrow mesenchymal stem cells (mBMSCs); B: Representative images of alkaline phosphatase (ALP) staining of mBMSCs after culture in osteogenesis induction medium for 21 d; C: Quantitative real-time polymerase chain reaction analysis of the relative mRNA expression levels of runt-related transcription factor 2 (Runx2) and ALP in mBMSCs cultured in adipogenesis induction medium for 21 d; D: Nude mice were subcutaneously implanted with mBMSCs (n = 3), mBMSCs/NC-Mst1 (n = 3), and mBMSCs/sh-Mst1 (n = 4). Representative images of the heart, liver, spleen, lung and kidney in each group 60 d postinjection; E. Paraffin-embedded subcutaneous sections derived from cell-injection sites were stained with haematoxylin and eosin. Data are the mean ± SD of three technical replicates. mBMSCs: Mouse bone marrow mesenchymal stem cells; Mst1: Mammalian Ste20-like kinase 1; IL: Interleukin; Runx2: Runt-related transcription factor 2; ALP: Alkaline phosphatase. cP < 0.01; bP < 0.05; aP > 0.05.
- Citation: Zhang T, Zhang Q, Yu WC. Mammalian Ste20-like kinase 1 inhibition as a cellular mediator of anoikis in mouse bone marrow mesenchymal stem cells. World J Stem Cells 2023; 15(3): 90-104
- URL: https://www.wjgnet.com/1948-0210/full/v15/i3/90.htm
- DOI: https://dx.doi.org/10.4252/wjsc.v15.i3.90


