©The Author(s) 2020.
World J Stem Cells. Feb 26, 2020; 12(2): 139-151
Published online Feb 26, 2020. doi: 10.4252/wjsc.v12.i2.139
Published online Feb 26, 2020. doi: 10.4252/wjsc.v12.i2.139
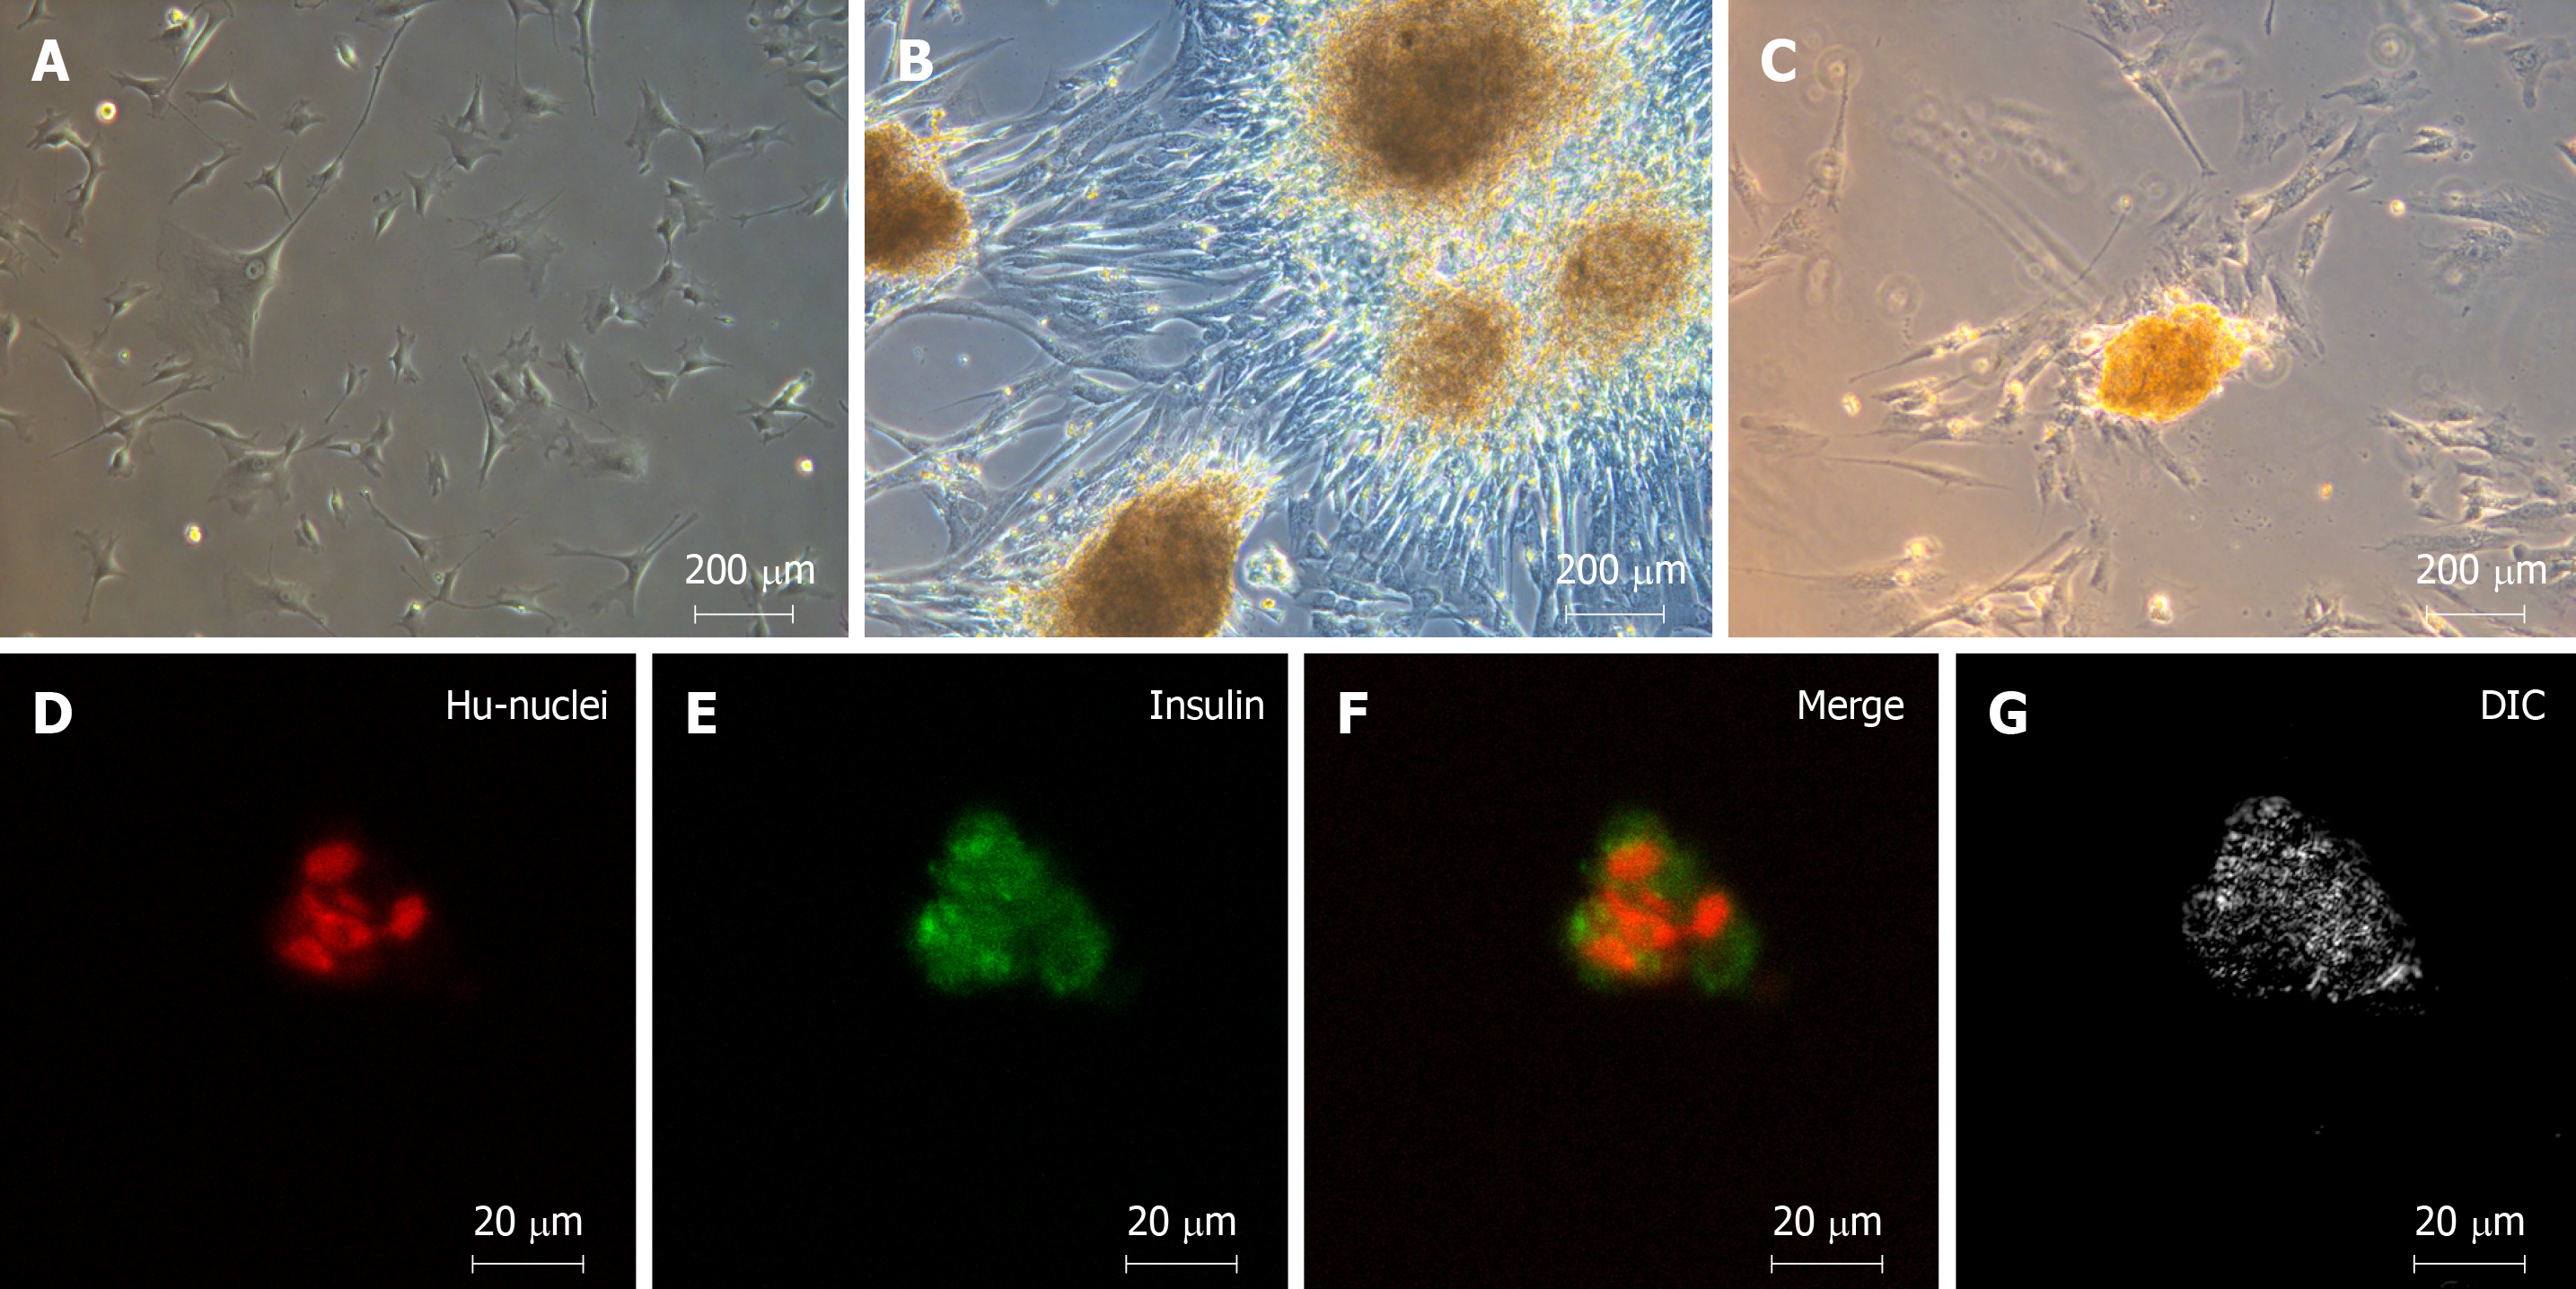
Figure 1 Morphology of undifferentiated human Wharton's jelly mesenchymal stem cells and islet-like clusters differentiated from human Wharton's jelly mesenchymal stem cells.
A: Undifferentiated spindle-shaped human Wharton's jelly mesenchymal stem cells (20 ×); B: Islet-like clusters after differentiation (20 ×); C: Dithizone-positive cells, which represent insulin-secreting cells (20 ×); D-G: Immunofluorescence staining with anti-insulin antibodies (green) and anti-human-nuclei antibodies (red) (40 ×).
Figure 2 Comparison of serum C-peptide concentration and insulin concentration between undifferentiated human Wharton's jelly mesenchymal stem cells and insulin-producing cells in response to glucose stimulation.
Differentiated insulin-producing cells (IPCs) secreted significant amounts of C-peptide and insulin, whereas undifferentiated human Wharton's jelly mesenchymal stem cells (MSCs) secreted lower amounts. aP < 0.05 when comparing the concentration of C-peptide and insulin by differentiated insulin-producing cells in response to the higher glucose (HG) and lower glucose (LG) environments.
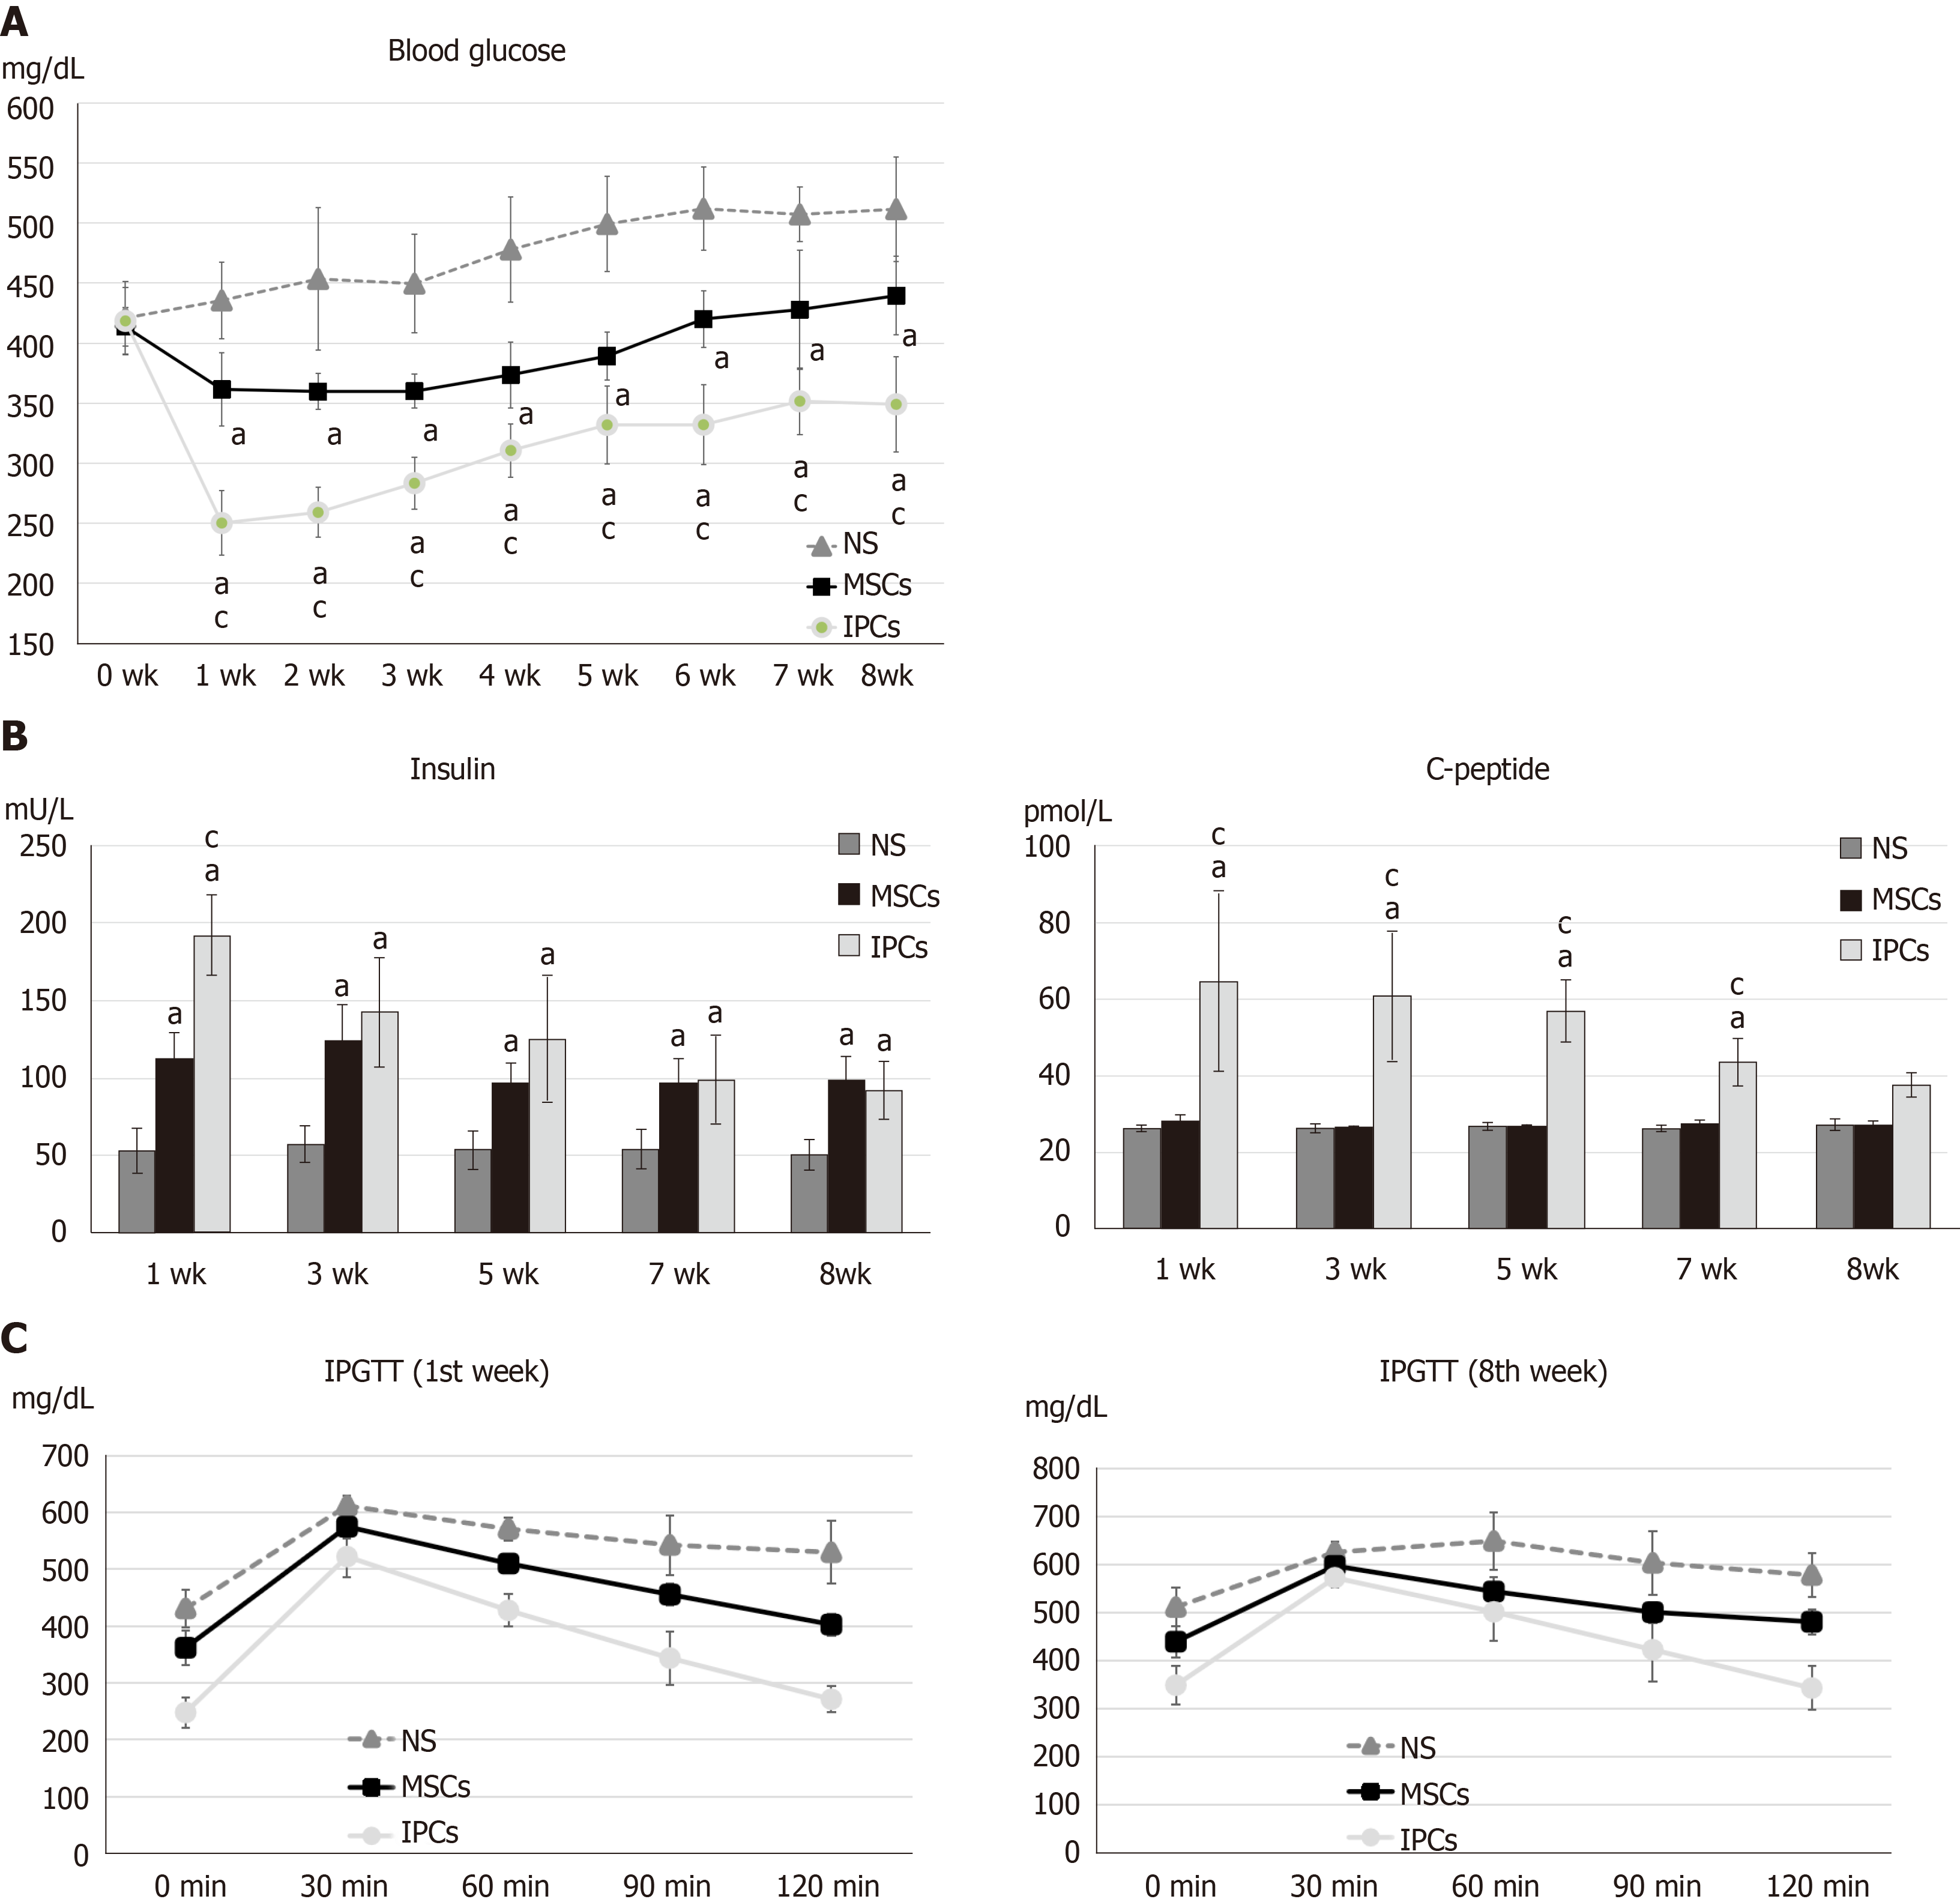
Figure 3 Comparison of differences in blood glucose, serum insulin, serum C-peptide, and intraperitoneal glucose tolerance test results between streptozotocin-induced diabetic rats treated with undifferentiated human Wharton's jelly mesenchymal stem cells and insulin-producing cells.
A: aP < 0.05, compared to the normal saline (NS) treatment group, the rats in the two treatment groups had significantly decreased blood glucose levels; cP < 0.05, blood glucose levels in rats in the insulin-producing cell (IPC) group were significantly lower than in rats from the undifferentiated human Wharton’s jelly mesenchymal stem cell (hWJ-MSC) group; B: aP < 0.05, compared to the NS treatment group, the rats in other two treatment groups had significantly higher serum insulin levels; cP < 0.05, serum insulin levels in rats from the IPC group were significantly higher than those in rats from the undifferentiated hWJ-MSC group; aP < 0.05, compared to the NS treatment group, rats in the IPC treatment group had significantly higher serum C-peptide levels; cP < 0.05, serum C-peptide level blood glucose level of rats from the IPC group was significantly higher than those in rats from the undifferentiated hWJ-MSC group; C: IPC and MSC treatment led to better improvement in the intraperitoneal glucose tolerance test (IPGTT) result than NS treatment in both the first and eighth weeks.
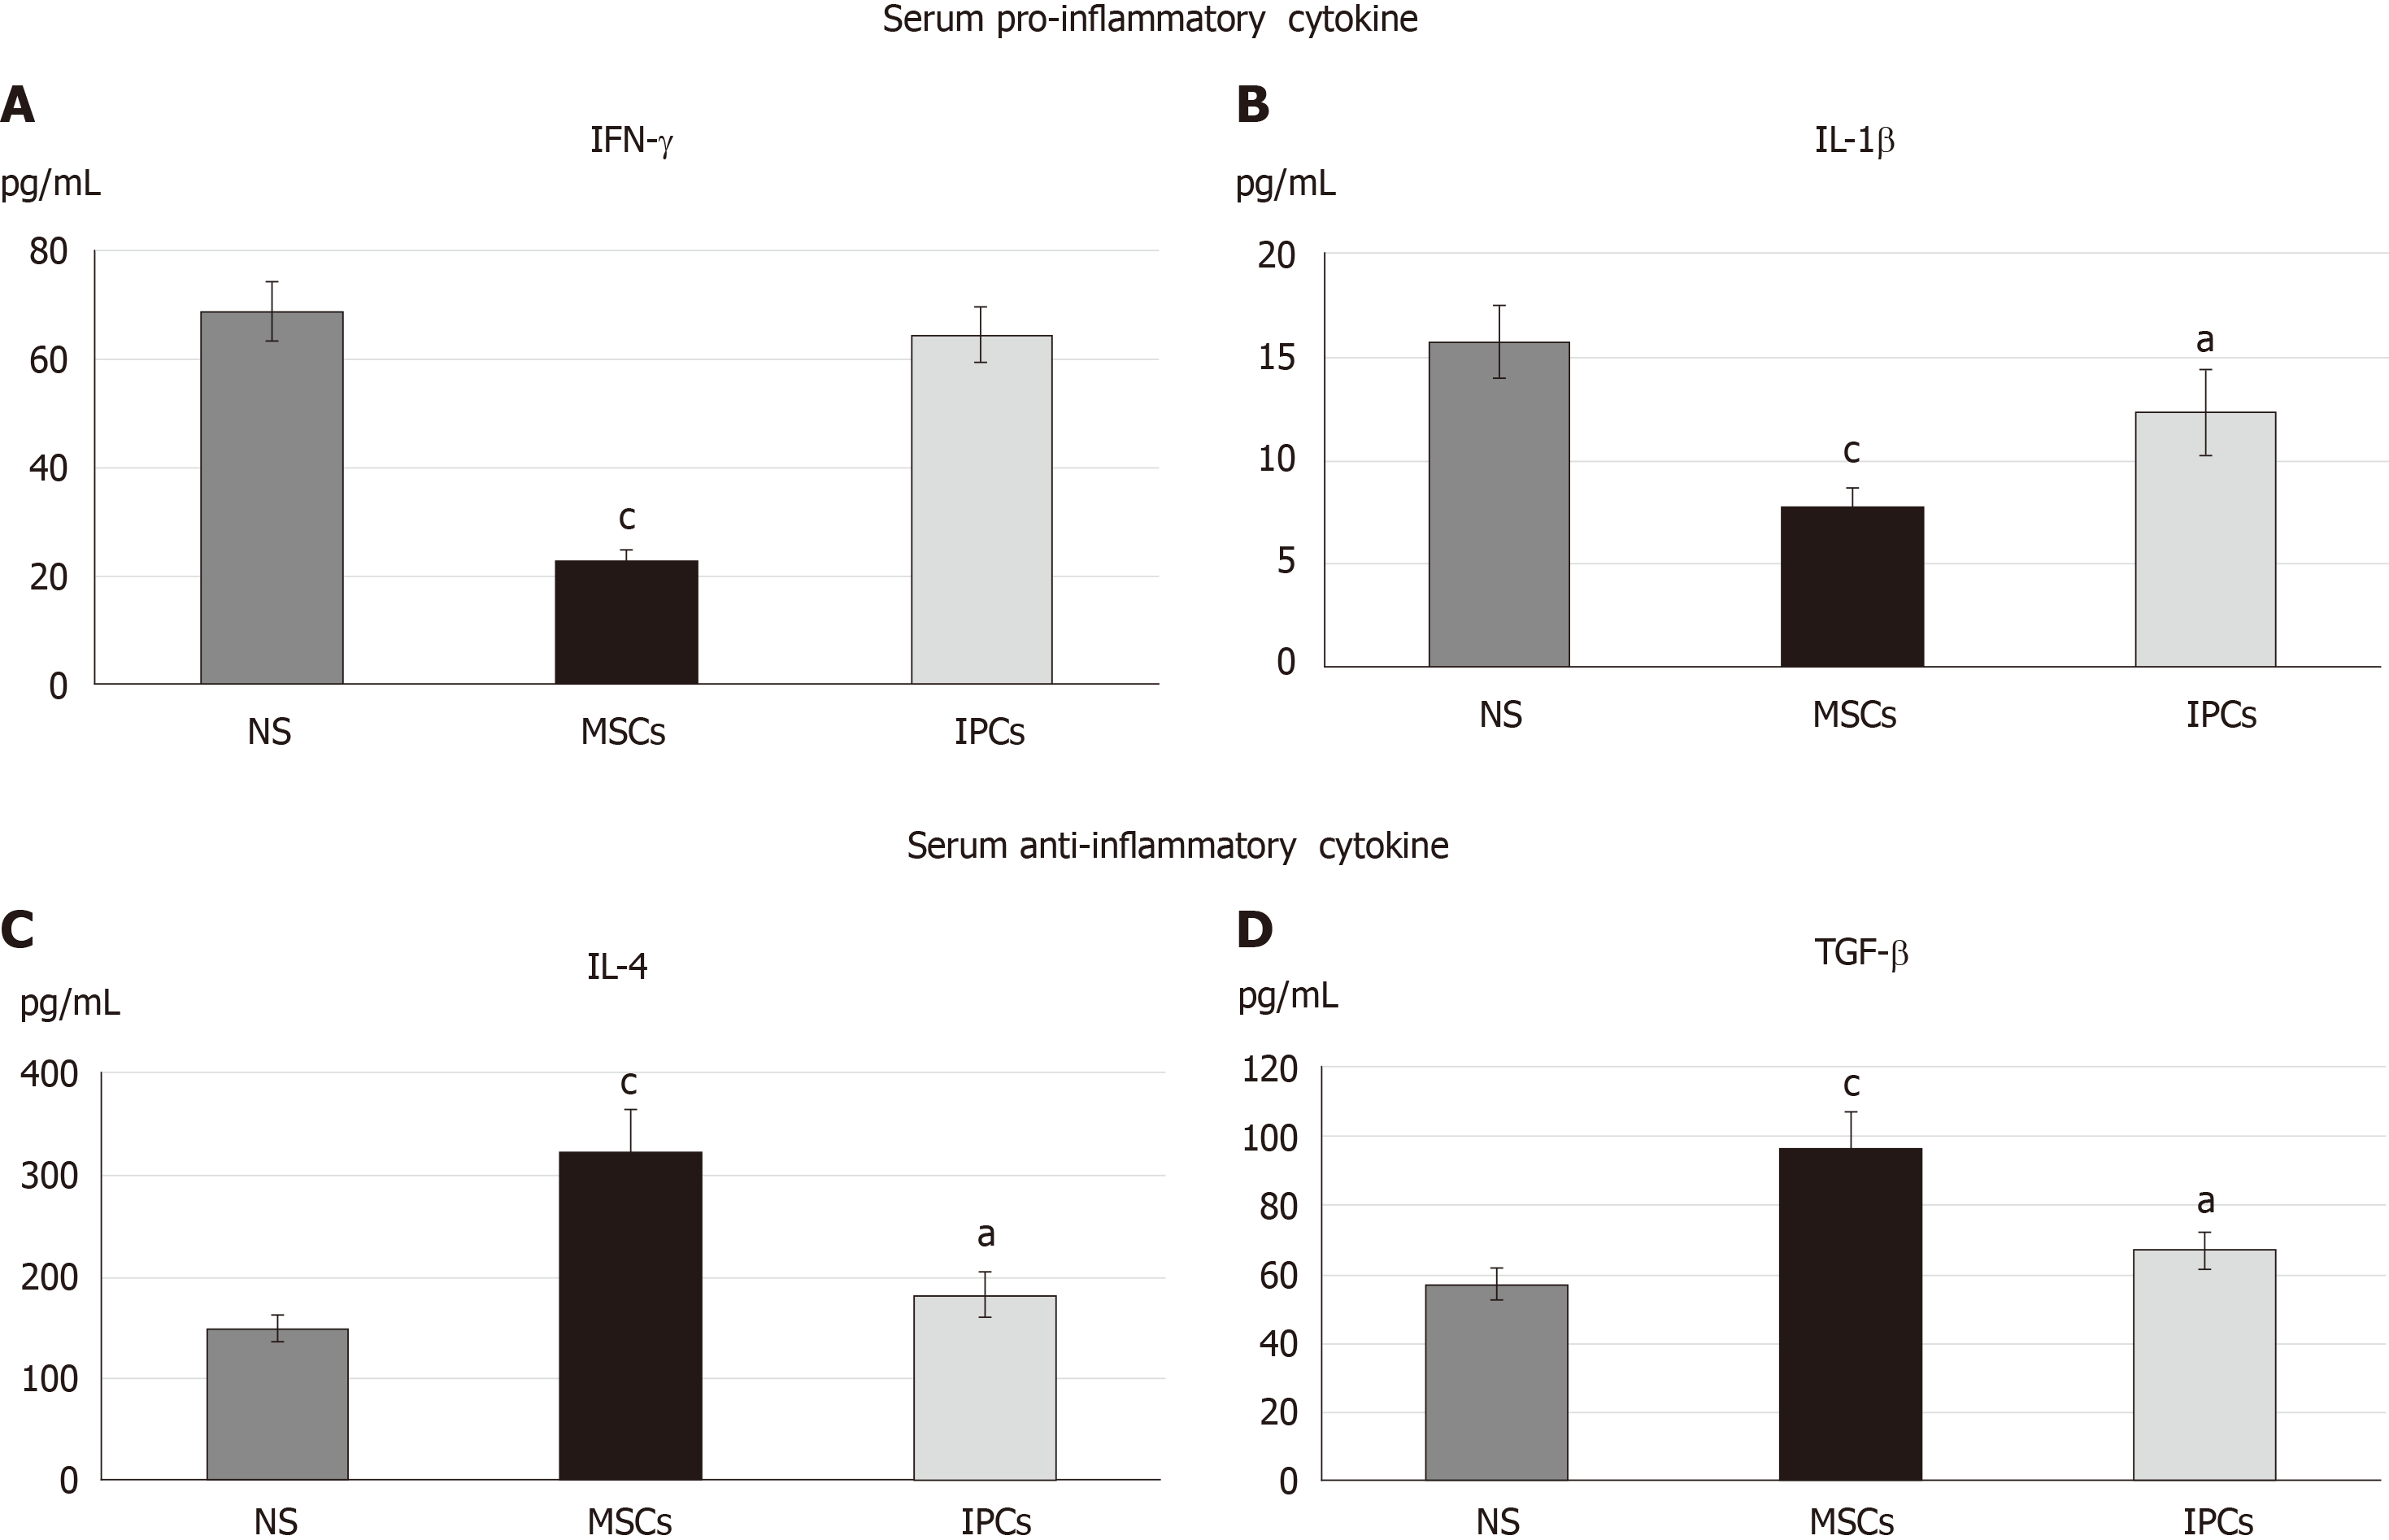
Figure 4 Comparison of the serum cytokine profile in the different treatment groups of diabetic rats.
aP < 0.05, P < 0.05 when compared with the serum concentration of the normal saline (NS) group. cP < 0.05, P < 0.05 when comparing the serum concentration between the mesenchymal stem cell (MSC) group and insulin-producing cell (IPC) group. NS: Normal saline treatment group; MSCs: Undifferentiated Wharton’s jelly mesenchymal stem cells treatment group; IPCs: Insulin-producing cells treatment group.
Figure 5 Comparison of pancreatic immunofluorescence staining in the different treatment groups of diabetic rats.
A: Pancreas of rats from the saline treatment group (20 ×); B: Pancreas of rats from the mesenchymal stem cell treatment group (10 ×); C: Pancreas of rats from the insulin-producing cell treatment group (10 ×). Red: Human cell nucleus; green: human insulin.
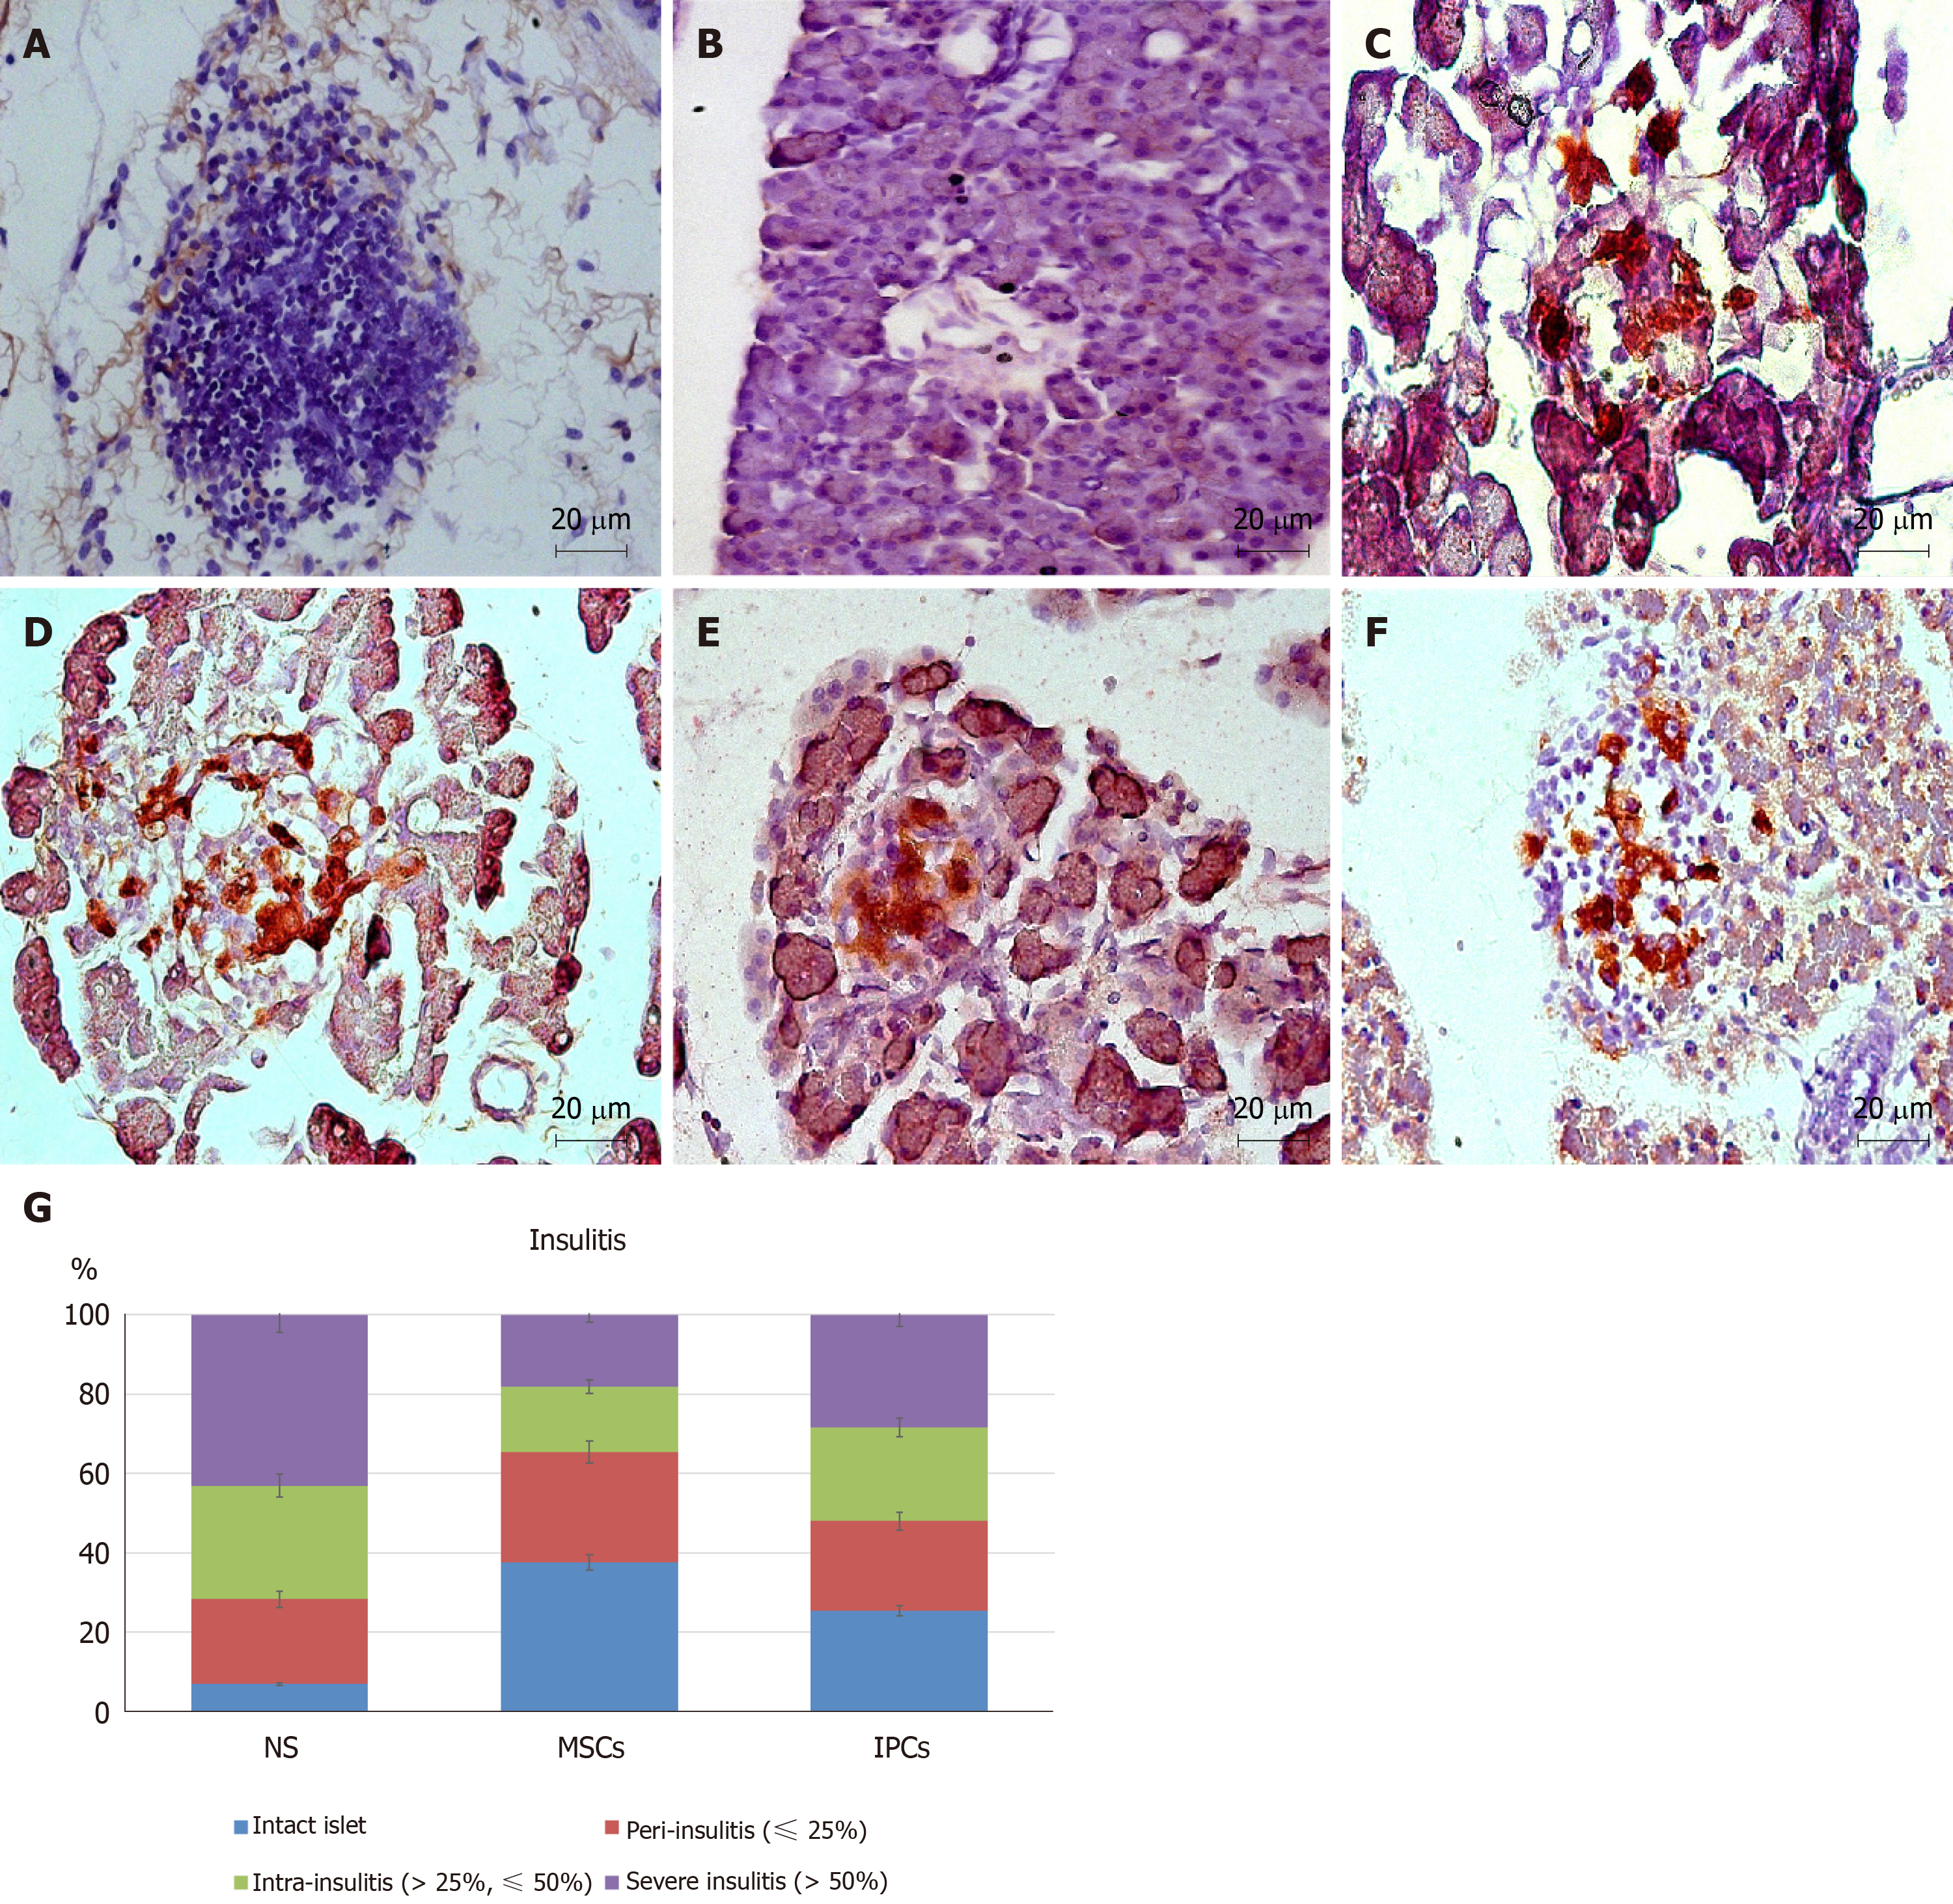
Figure 6 Comparison of pancreatic immunohistochemistry staining in the different treatment groups of diabetic rats.
A, B: Pancreas of rats from the normal saline (NS) treatment group (40 ×); C, D: Pancreas of rats from the mesenchymal stem cell (MSC) treatment group (40 ×); E, F: Pancreas of rats from the insulin-producing cell (IPC) treatment group (40 ×); G: Intact islets: 0% lymphocyte infiltration, peri-insulitis: < 25% lymphocyte infiltration, intra-insulitis: 25%-50% lymphocyte infiltration, severe insulitis: > 50% lymphocyte infiltration. The percentage of islets free from lymphocyte infiltration was about 7% in rats from the NS treatment group but was 38% in rats from the MSC treatment group (aP < 0.05). Only 18% of the islets from MSC-treated rats showed severe insulitis compared with 43% of rats from the NS treatment group (aP < 0.05). NS: normal saline treatment group; MSCs: Undifferentiated Wharton’s jelly-MSCs treatment group; IPCs: Insulin-producing cells treatment group; Red: Human cell nucleus; Brown: Human insulin.
- Citation: Hsiao CY, Chen TH, Huang BS, Chen PH, Su CH, Shyu JF, Tsai PJ. Comparison between the therapeutic effects of differentiated and undifferentiated Wharton's jelly mesenchymal stem cells in rats with streptozotocin-induced diabetes. World J Stem Cells 2020; 12(2): 139-151
- URL: https://www.wjgnet.com/1948-0210/full/v12/i2/139.htm
- DOI: https://dx.doi.org/10.4252/wjsc.v12.i2.139


