©The Author(s) 2019.
World J Stem Cells. Nov 26, 2019; 11(11): 990-1004
Published online Nov 26, 2019. doi: 10.4252/wjsc.v11.i11.990
Published online Nov 26, 2019. doi: 10.4252/wjsc.v11.i11.990
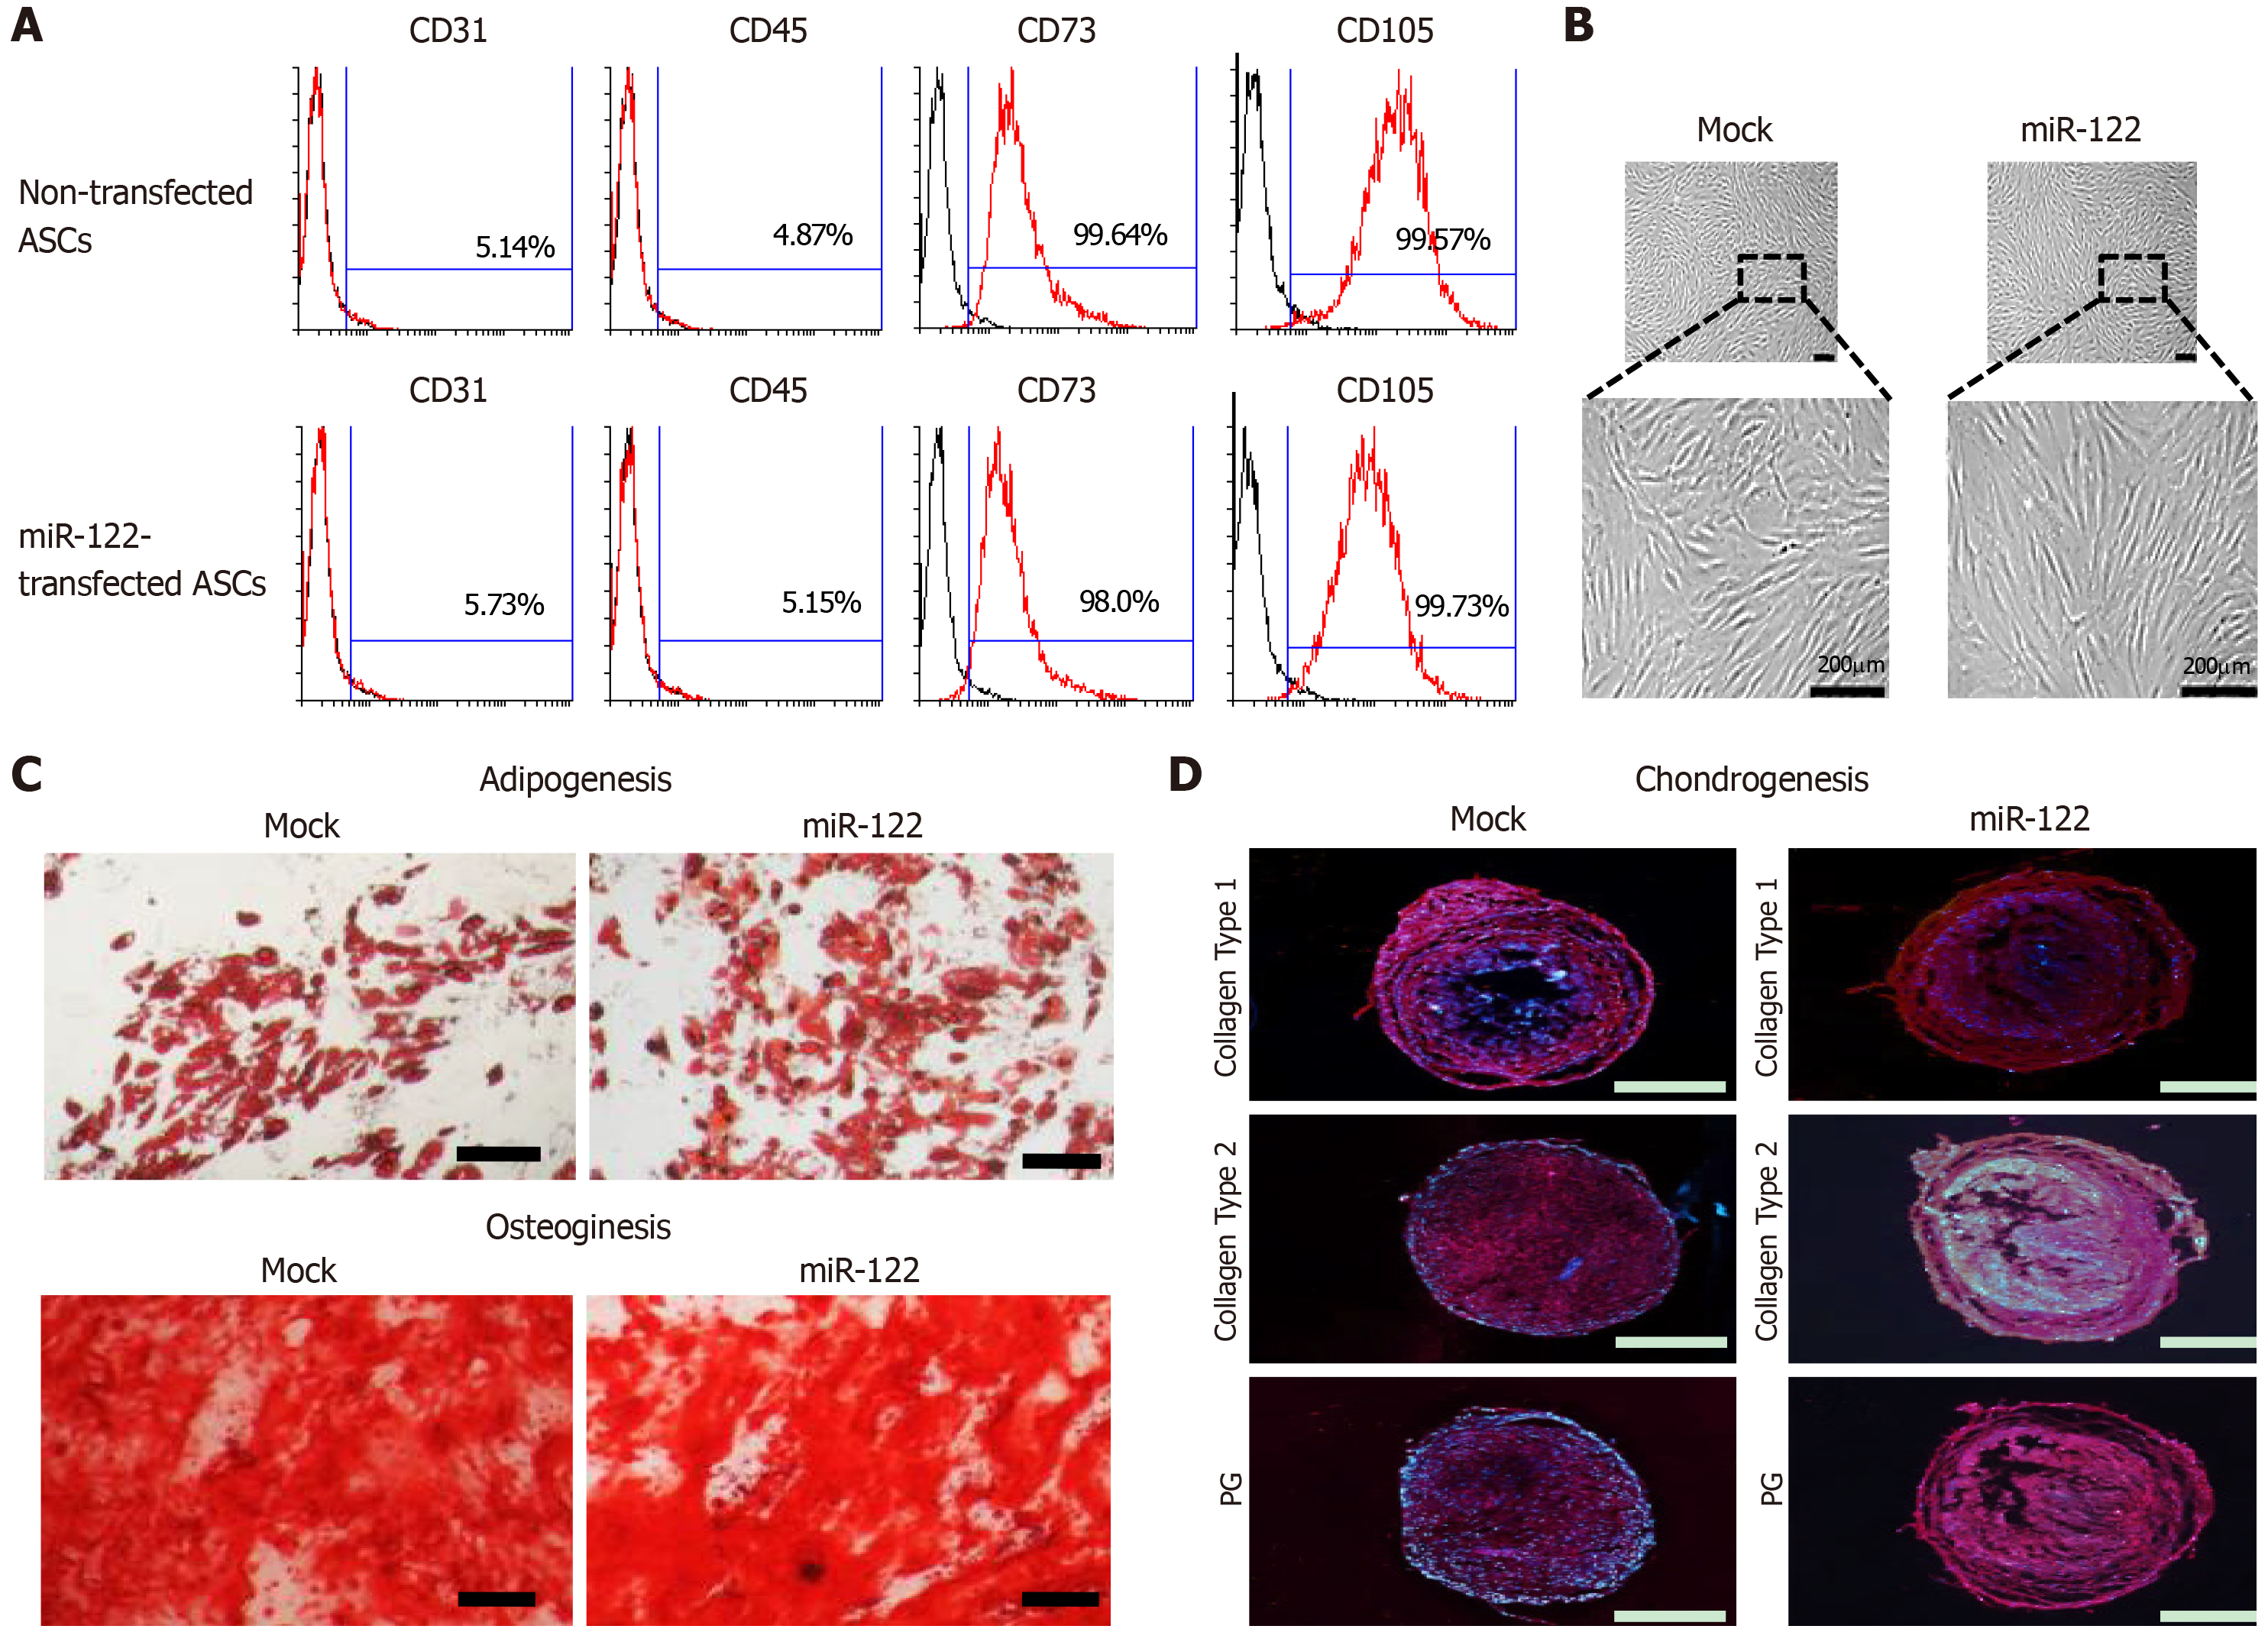
Figure 1 Assessment of multilineage differentiation potential of miR-122-transfected adipose-derived stem cells.
A: Flow cytometric analysis showing that miR-122 transfection did not alter the expression of surface markers of adipose-derived stem cells (ASCs). ASCs were negative for CD31 and CD45 (hematopoietic stem cell-associated markers) expression and positive for CD73 and CD105 (mesenchymal stem cell-associated markers) expression regardless of miR-122 transfection; B: Comparison of gross cell morphology between ASCs with/without miR-122 transfection. Cells appear to be identical regardless of miR-122 transfection; C, D: Photomicrographs showing successful differentiation of ASCs into adipocytes, osteocytes, and chondrocytes regardless of miR-122 transfection. The differentiated cells were identified using four distinct staining methods (Oil Red O, Alizarin Red, collagen type 1, and proteoglycan). Scale bars = 100 µm. Values are presented as mean ± standard deviation of three independent experiments. aP < 0.05. ASC: Adipose-derived stem cell; HSC: Hepatic stellate cell; PG: Proteoglycan.
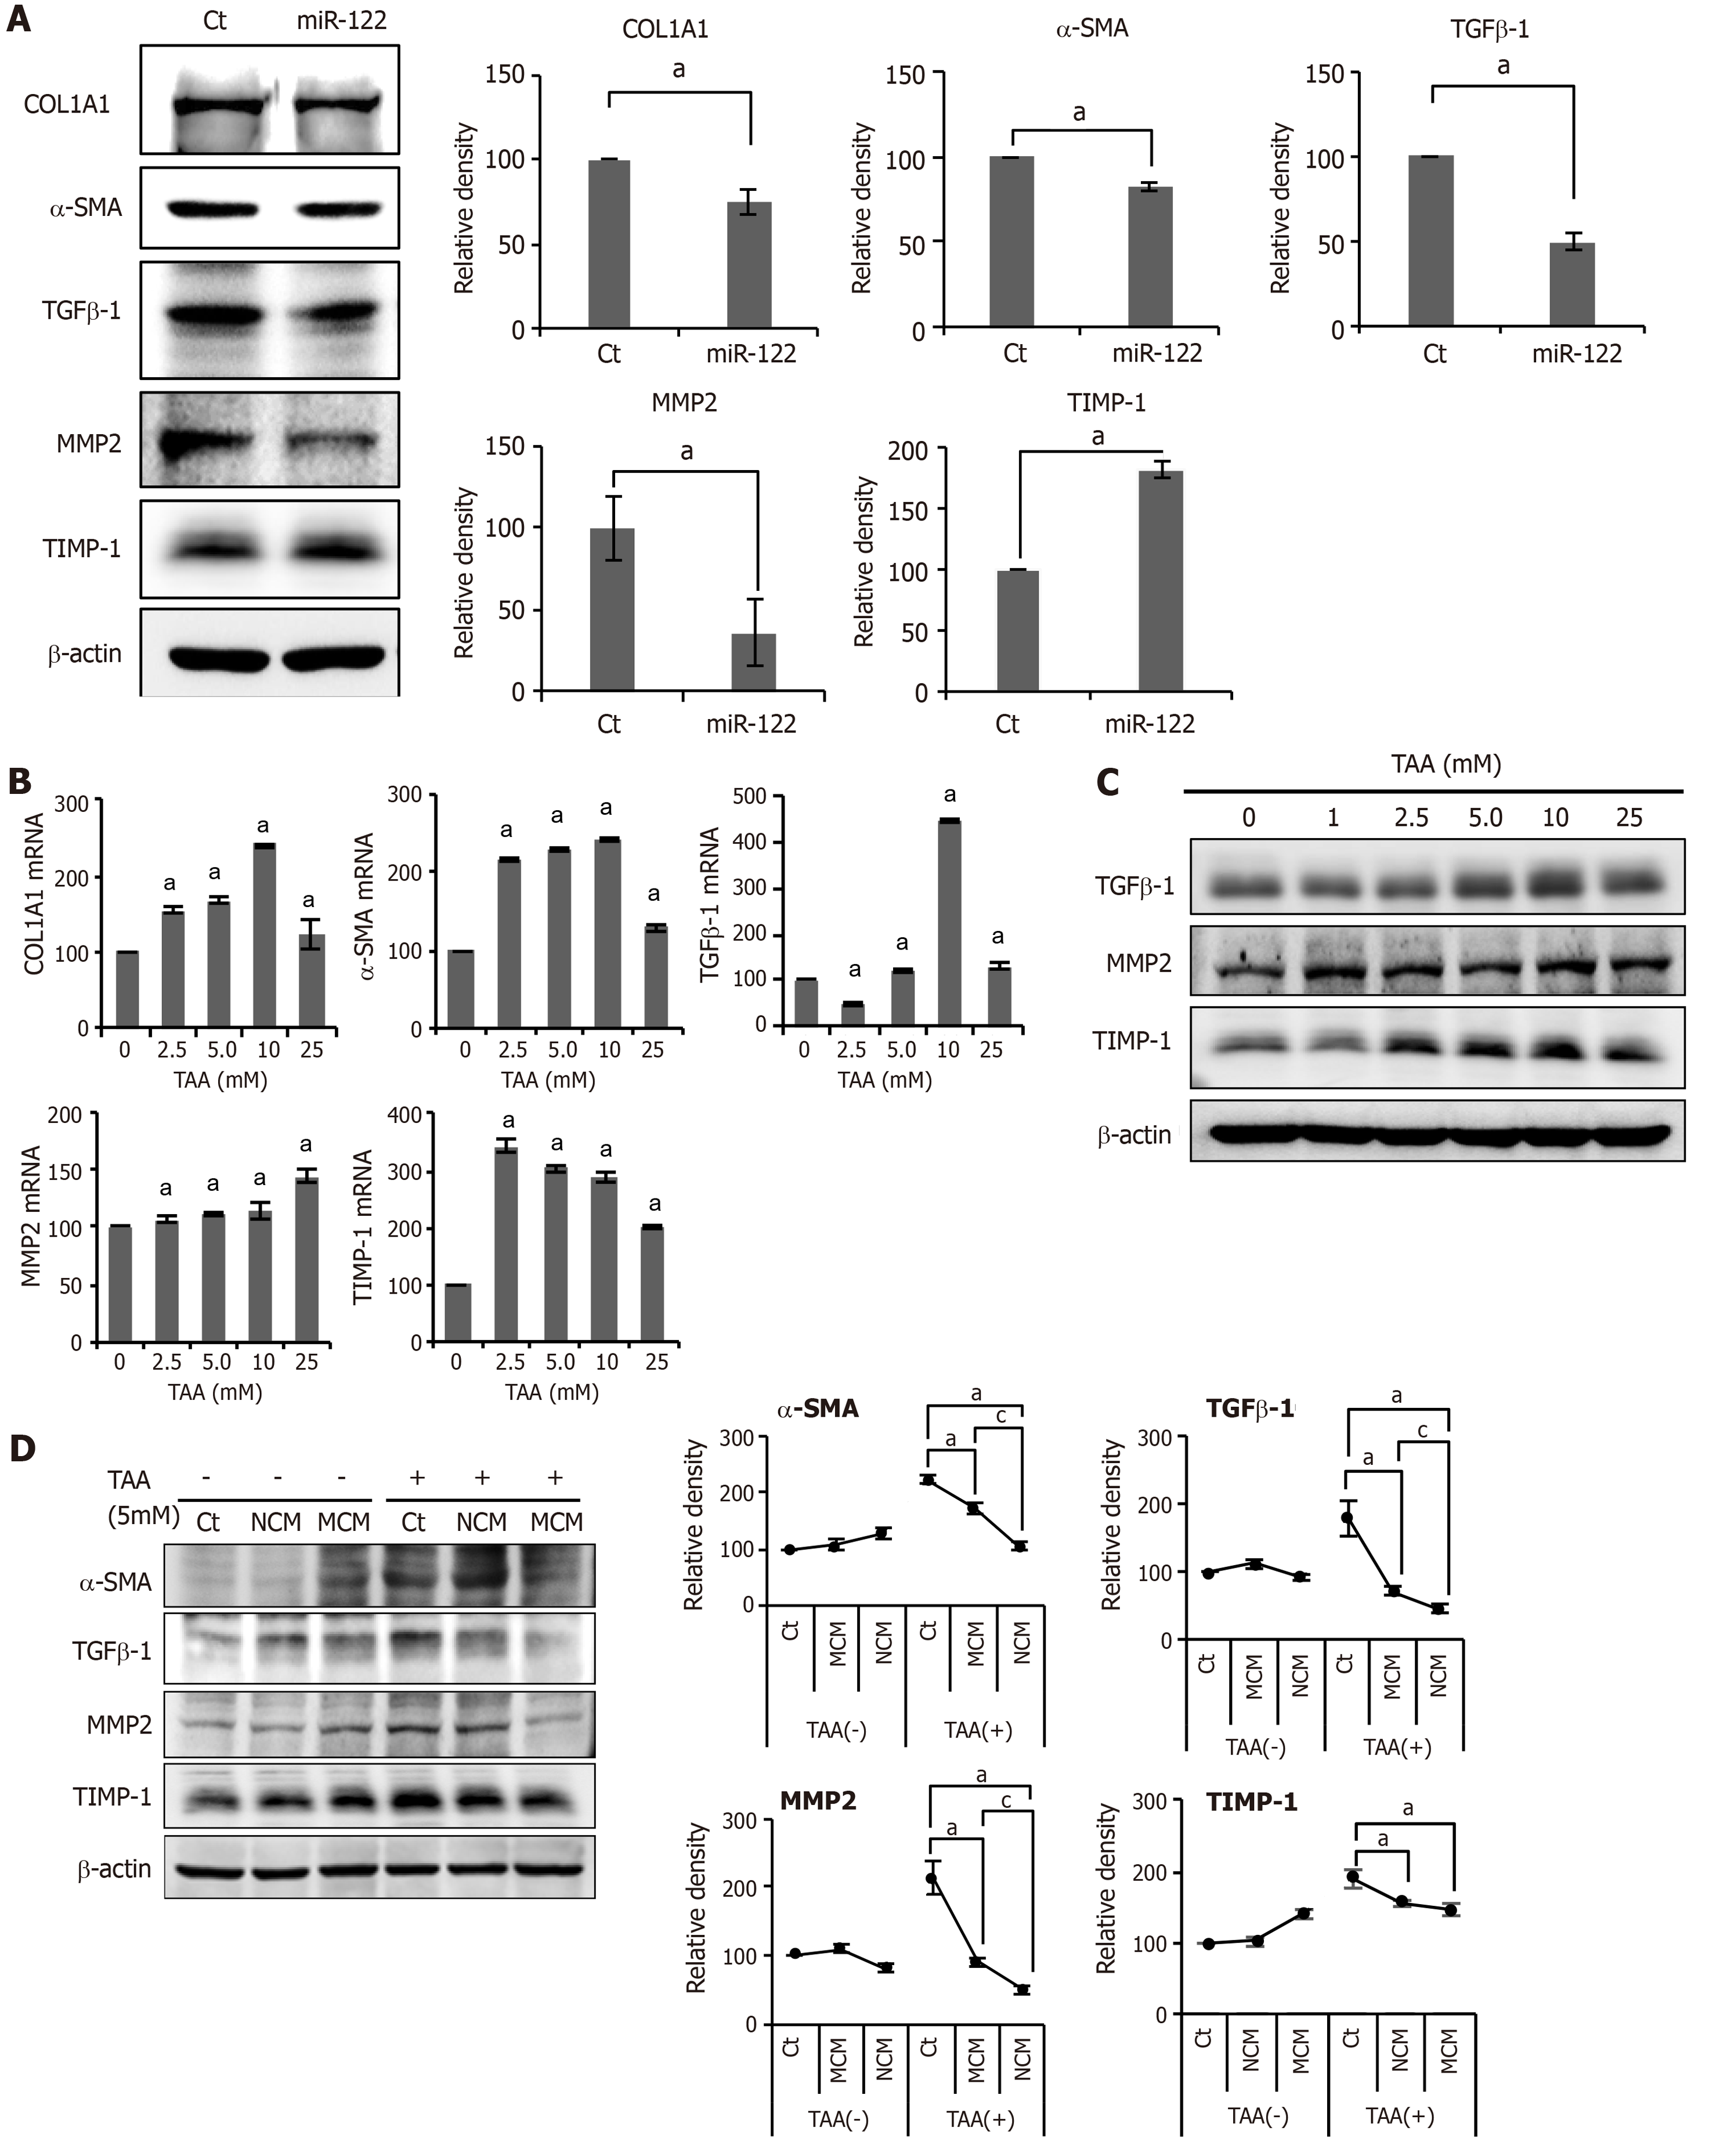
Figure 2 In vitro experiments validating the effects of miR-122 transfection into Adipose-derived stem cells.
A: Western blot analysis showing the expression of fibrotic and antifibrotic markers in miR-122-transfected adipose-derived stem cells (ASCs). miR-122-transfected ASCs showed decreased expression of fibrotic proteins (TGF β1, MMP2, and α-SMA) and increased expression of an antifibrotic protein (TIMP-1) than control ASCs. The graphs below microscopic figures show the relative densities of these markers; B, C: RT-PCR (left) and western blot analysis (right) of LX2 cells for the determination of the thioacetamide (TAA) concentration used for generating in vitro model of liver fibrosis. A TAA concentration of 2.5 mM was used for inducting LX2 cells into fibrosis; D: Effects of MCM in the in vitro model of liver fibrosis. The in vitro model of liver fibrosis was generated by treating human HSCs cells (LX2 cells) with a hepatotoxin (TAA). In western blot analysis (Left), MCM induced the lowest expression of fibrotic markers (MMP2, TGF-β1, and α-SMA) in the TAA-treated LX2 cells. Relative densities of fibrosis-related markers in each group (Right). Values are presented as mean ± standard deviation of three independent experiments. aP < 0.05 vs Ct. cP < 0.05 between NCM and MCM. α-SMA: Alpha-smooth muscle actin; COL1A1: Collagen type-1 alpha-1; Ct: Control; CM: The secretome obtained from ASCs after 48-h-incubation; MCM: The secretome released from miR-122-transfected ASCs; MMP-1: Metalloproteinases-1; TAA: Thioacetamide; TGF-β: Transforming growth factor-β; TIMP-1: Tissue inhibitor of metalloproteinases-1.
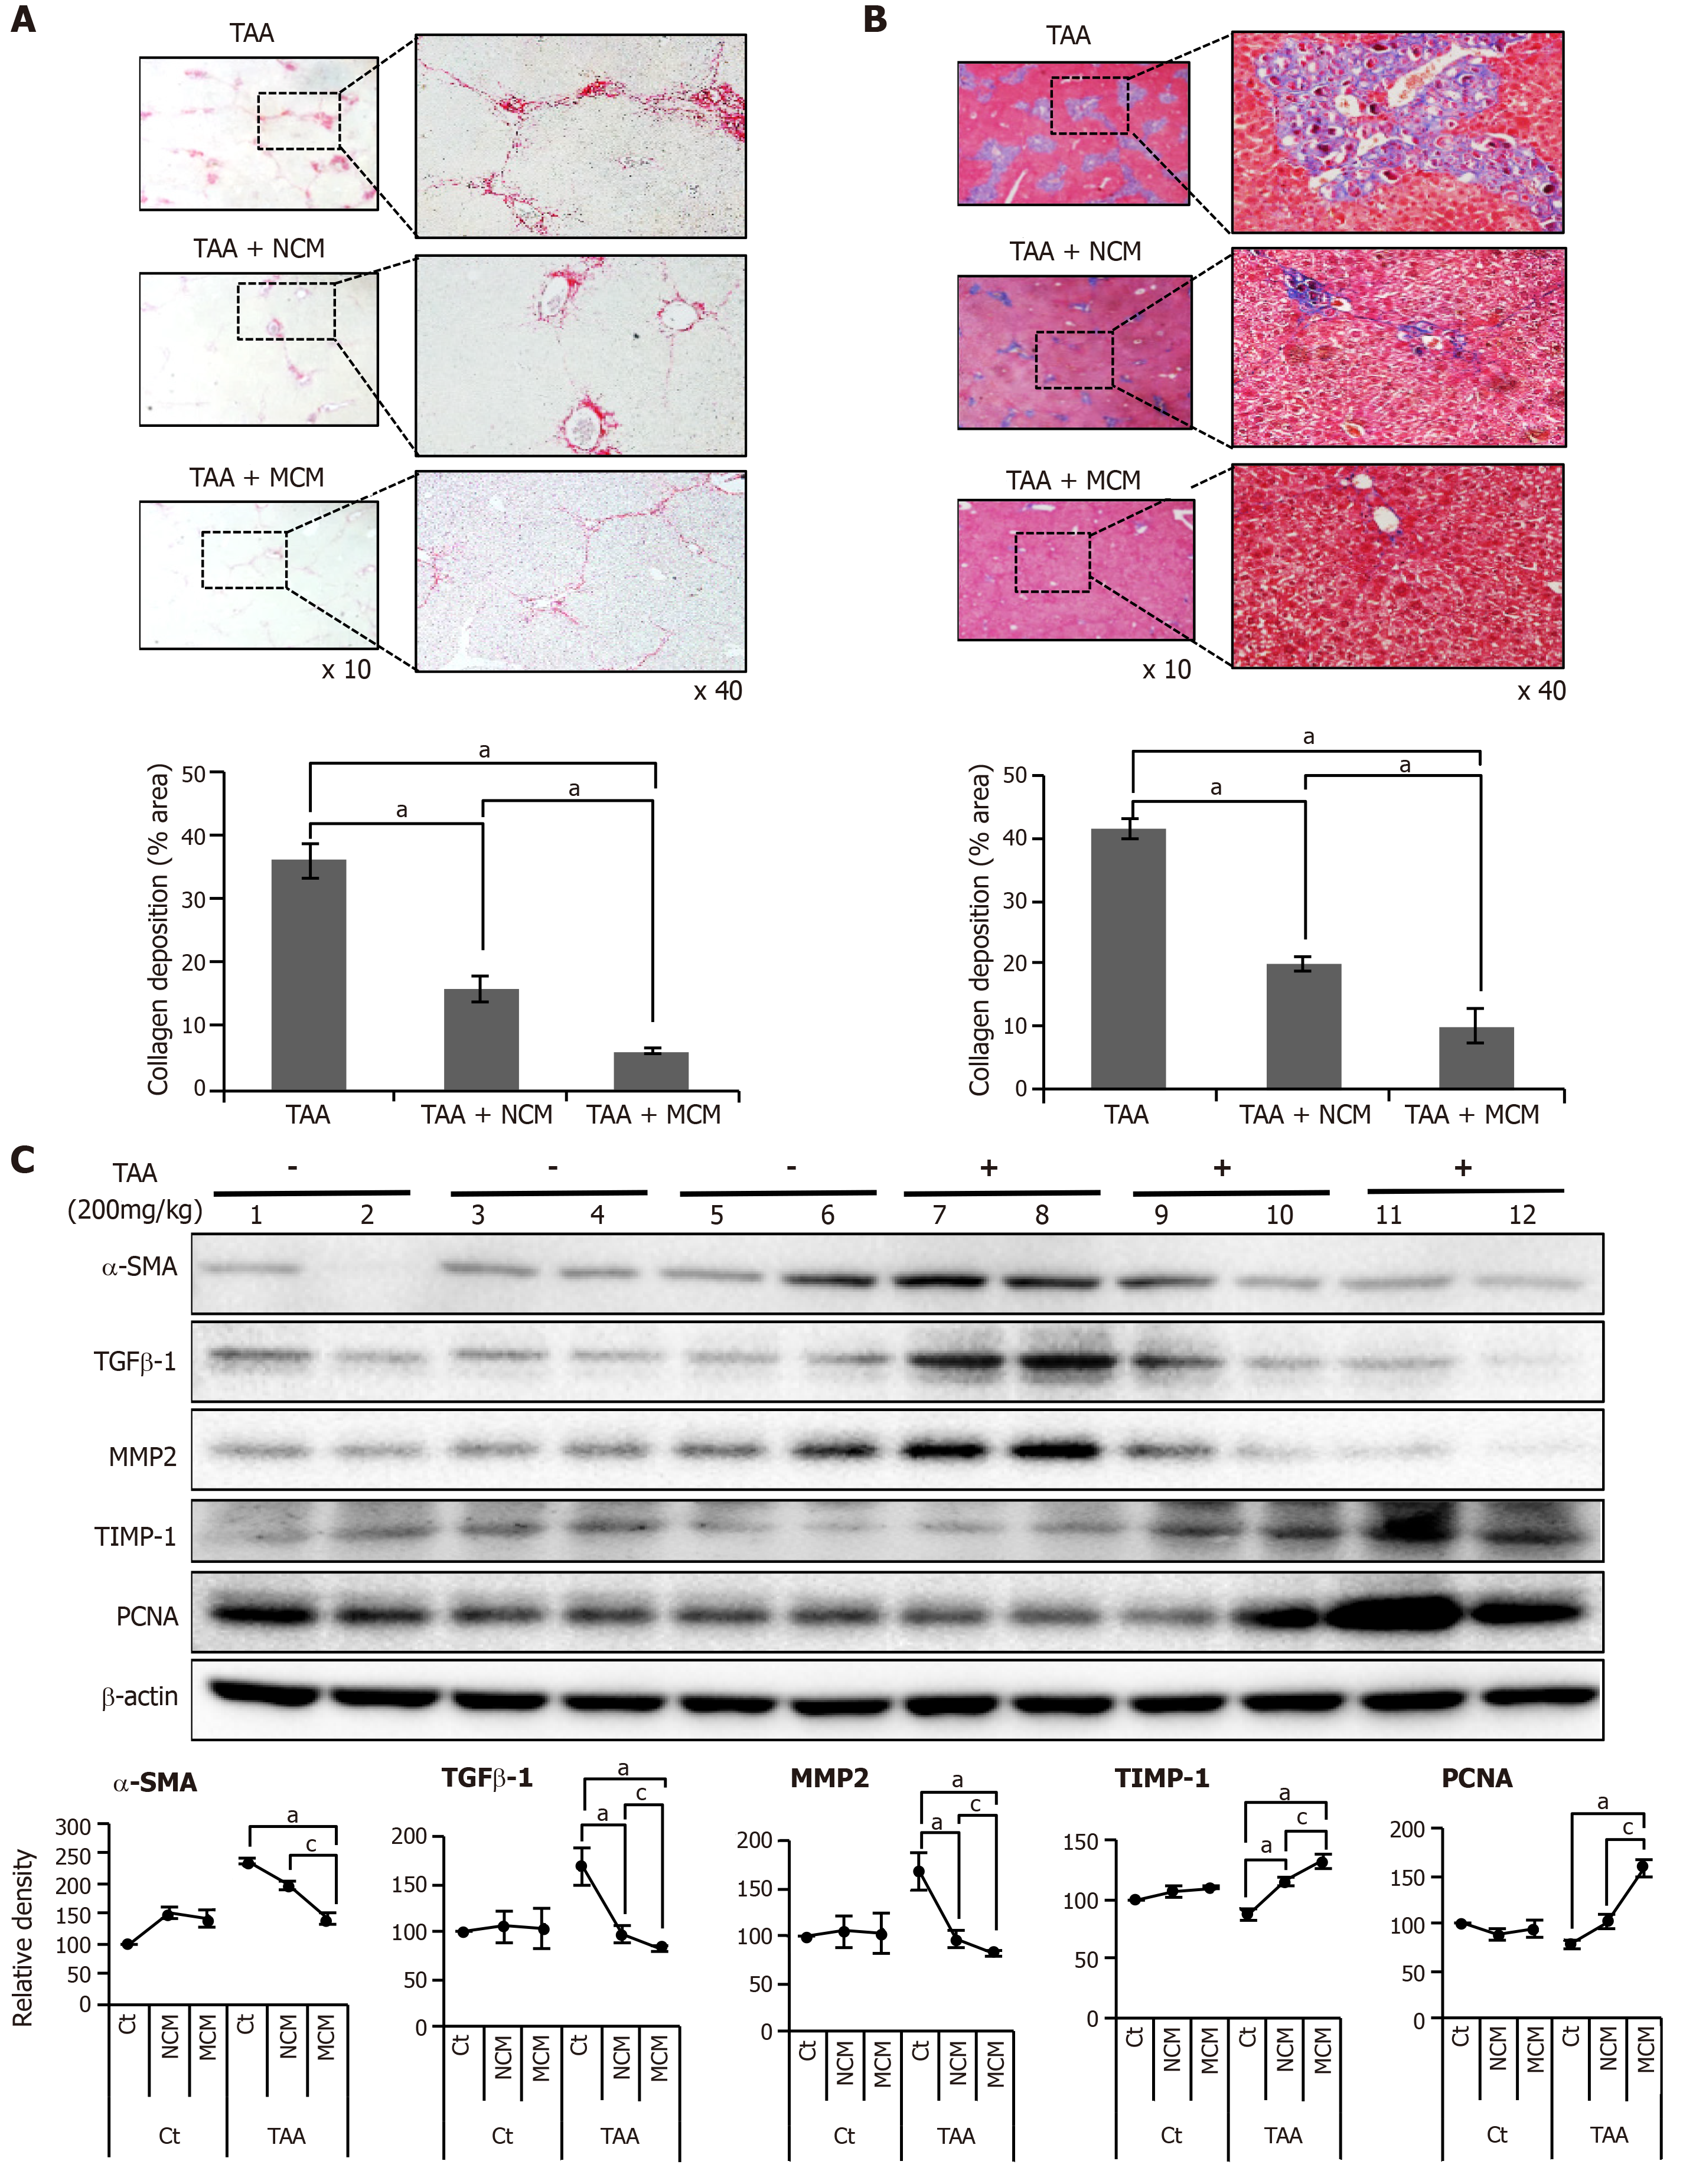
Figure 3 Determination of antifibrotic effects of MCM in the in vivo model of liver fibrosis.
Control mice and thioacetamide (TAA)-treated mice (mouse model of liver fibrosis) were intravenously (using tail vein) infused with normal saline, CM, and MCM. A, B: Sirius red A and Masson’s trichrome B stains showing that MCM infusion significantly decreased the collagen content of the liver in the mouse model of liver fibrosis. Magnification × 400. Percentages of fibrotic areas were measured using NIH image J and expressed as relative values to those in normal livers; C: Western blot analysis of liver specimens. MCM infusion significantly increased the expression of PCNA (a proliferation marker), and significantly decreased the expression of α-SMA, TGF-β1, and MMP1 (fibrotic markers) and increased an antifibrotic marker (TIMP-1) in the mouse model of liver fibrosis. The relative densities of individual markers had been quantified using Image Lab 3.0 (Bio-Rad) software and then were normalized to that of β-actin in each group. Values are presented as mean ± standard deviation of three independent experiments. aP < 0.05 vs Ct (TAA). cP < 0.05 between TAA + NCM and TAA + MCM. α-SMA: Alpha-smooth muscle actin; Ct: Control; CM: The secretome obtained from ASCs after 48-h-incubation; MCM: The secretome released from miR-122-transfected ASCs; MMP-1: Metalloproteinases-1; PCNA: Proliferating cell nuclear antigen; TAA: Thioacetamide; TGF-β: Transforming growth factor-β; TIMP-1: Tissue inhibitor of metalloproteinases-1.
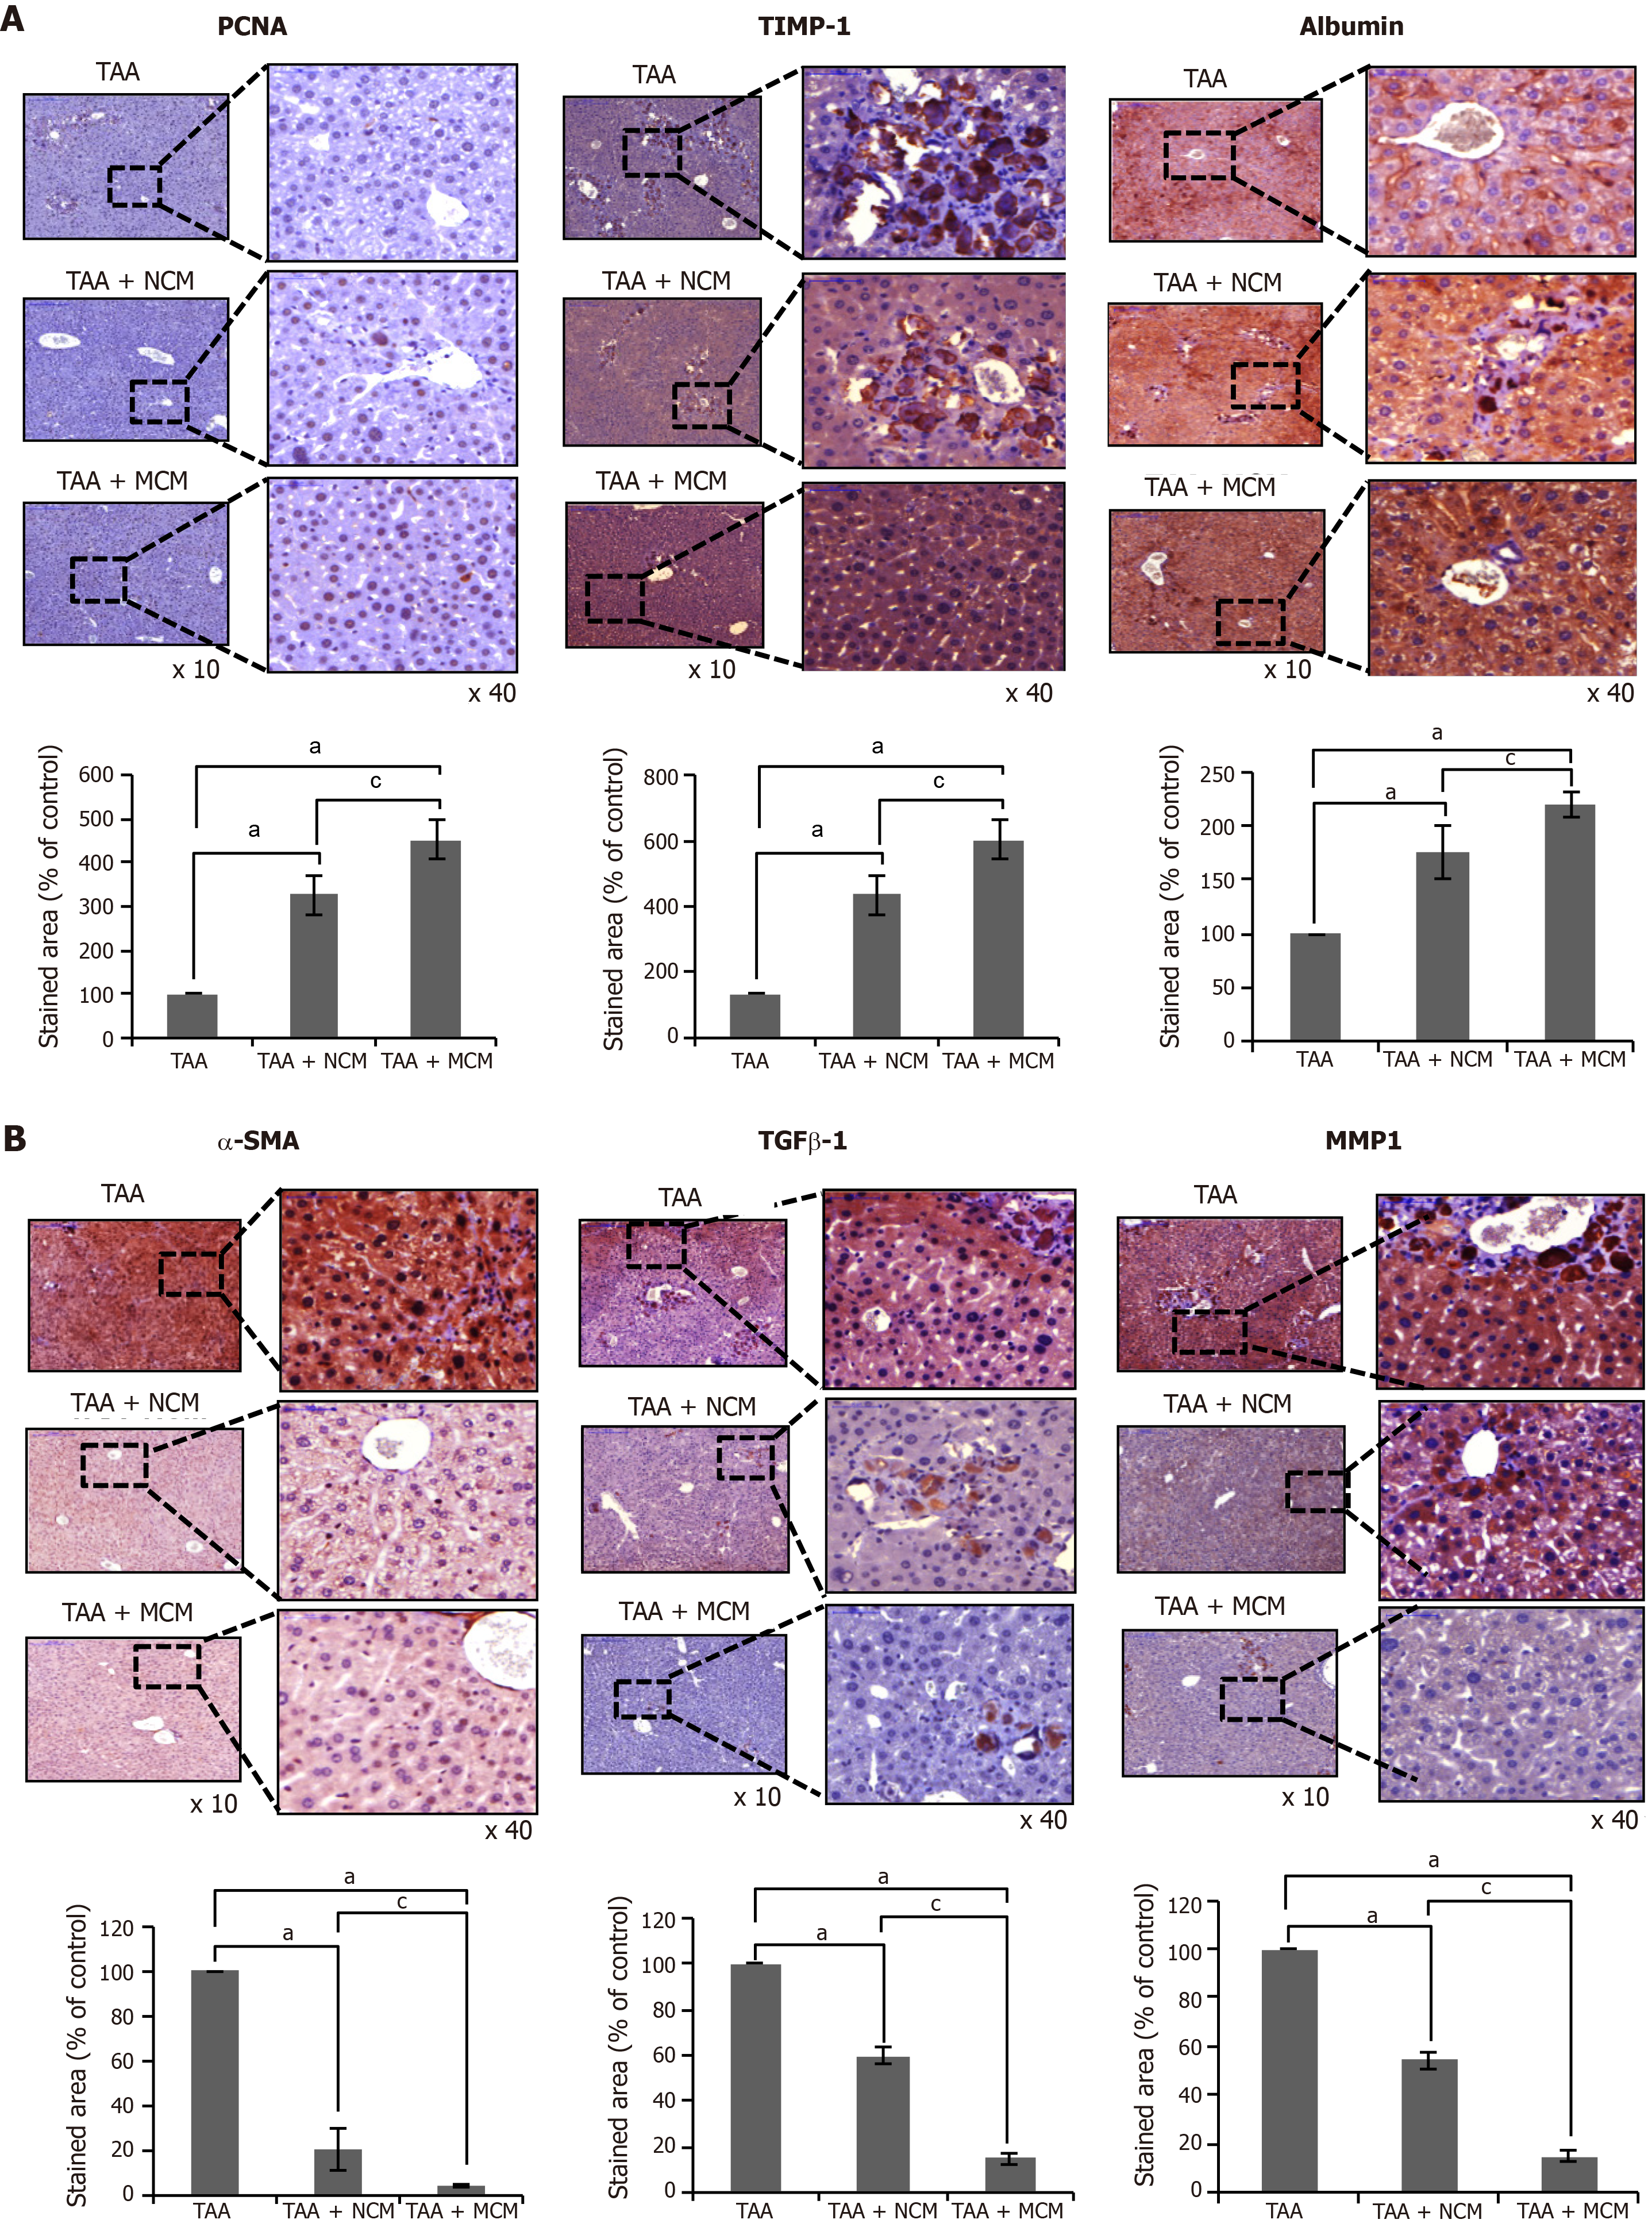
Figure 4 Immunohistochemical staining showing the effects of MCM on the expression of inflammatory and fibrotic markers in the livers.
A, B: Upon comparing immunohistochemical staining patterns, MCM infusion led to higher expression of PCNA (an inflammatory marker), albumin, and TIMP-1 (an antifibrotic marker) A, and lower expression of α-SMA, TGF-β1, and MMP1 (fibrotic markers) B in the livers of TAA-treated mice. Percentages of immunoreactive areas were measured using NIH image J and expressed as relative values to those in normal livers. Magnification × 400. Values are presented as mean ± standard deviation of three independent experiments. aP < 0.05 vs Ct (TAA). cP < 0.05 between TAA + NCM and TAA + MCM. α-SMA: Alpha-smooth muscle actin; Ct: Control; CM: The secretome obtained from ASCs after 48-h-incubation; MCM: The secretome released from miR-122-transfected ASCs; MMP-1: Metalloproteinases-1; PCNA: Proliferating cell nuclear antigen; TAA: Thioacetamide; TGF-β: Transforming growth factor-β; TIMP-1: Tissue inhibitor of metalloproteinases-1.
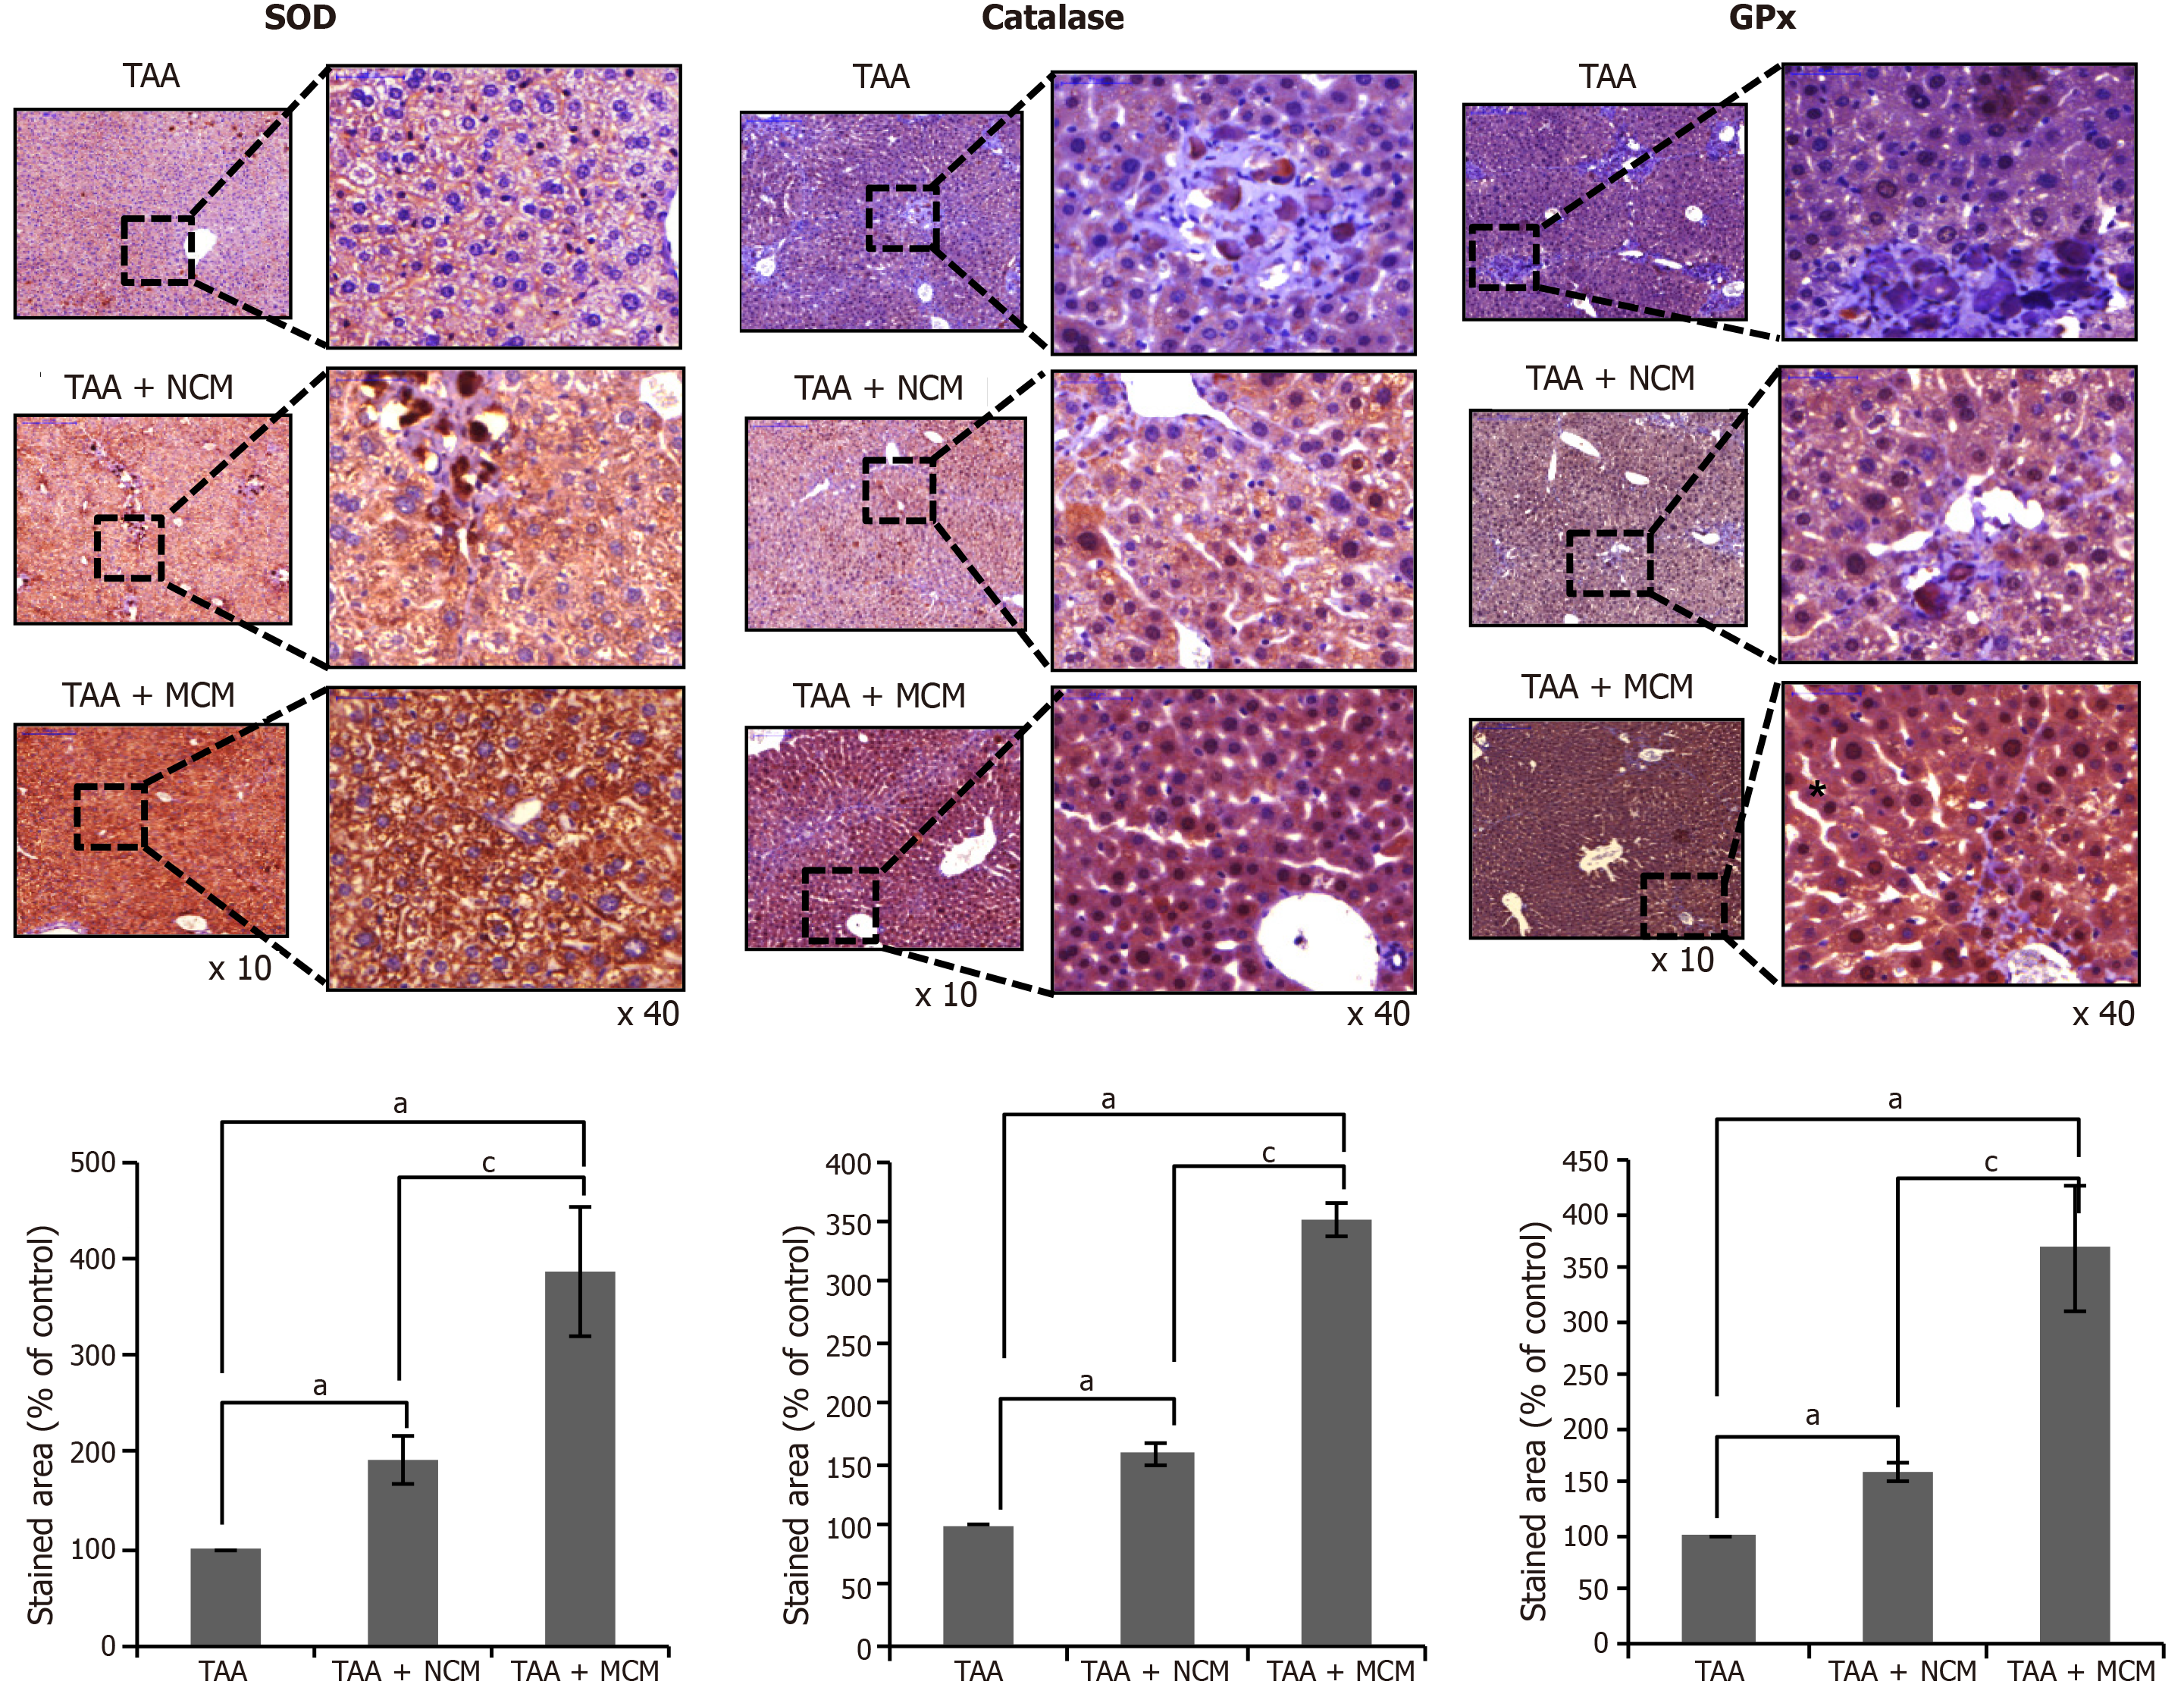
Figure 5 Effects of MCM on the expression of antioxidant enzymes in the liver.
Upon comparing immunohistochemical staining patterns, MCM infusion was observed to lead to a higher expression of SOD, catalase, and GPx in the livers of thioacetamide (TAA)-treated mice. The graphs below microscopic figures show the relative densities of these markers. Percentages of immunoreactive areas were measured using NIH image J and expressed as relative values to those in normal livers. Magnification × 400. Values are presented as mean ± standard deviation of three independent experiments. aP < 0.05 vs Ct (TAA). cP < 0.05 between TAA + NCM and TAA + MCM. Ct: Control; CM: The secretome obtained from ASCs after 48-h-incubation; GPx: Slutathione peroxidase; MCM: The secretome released from miR-122-transfected ASCs; SOD: Superoxide dismutase; TAA: Thioacetamide.
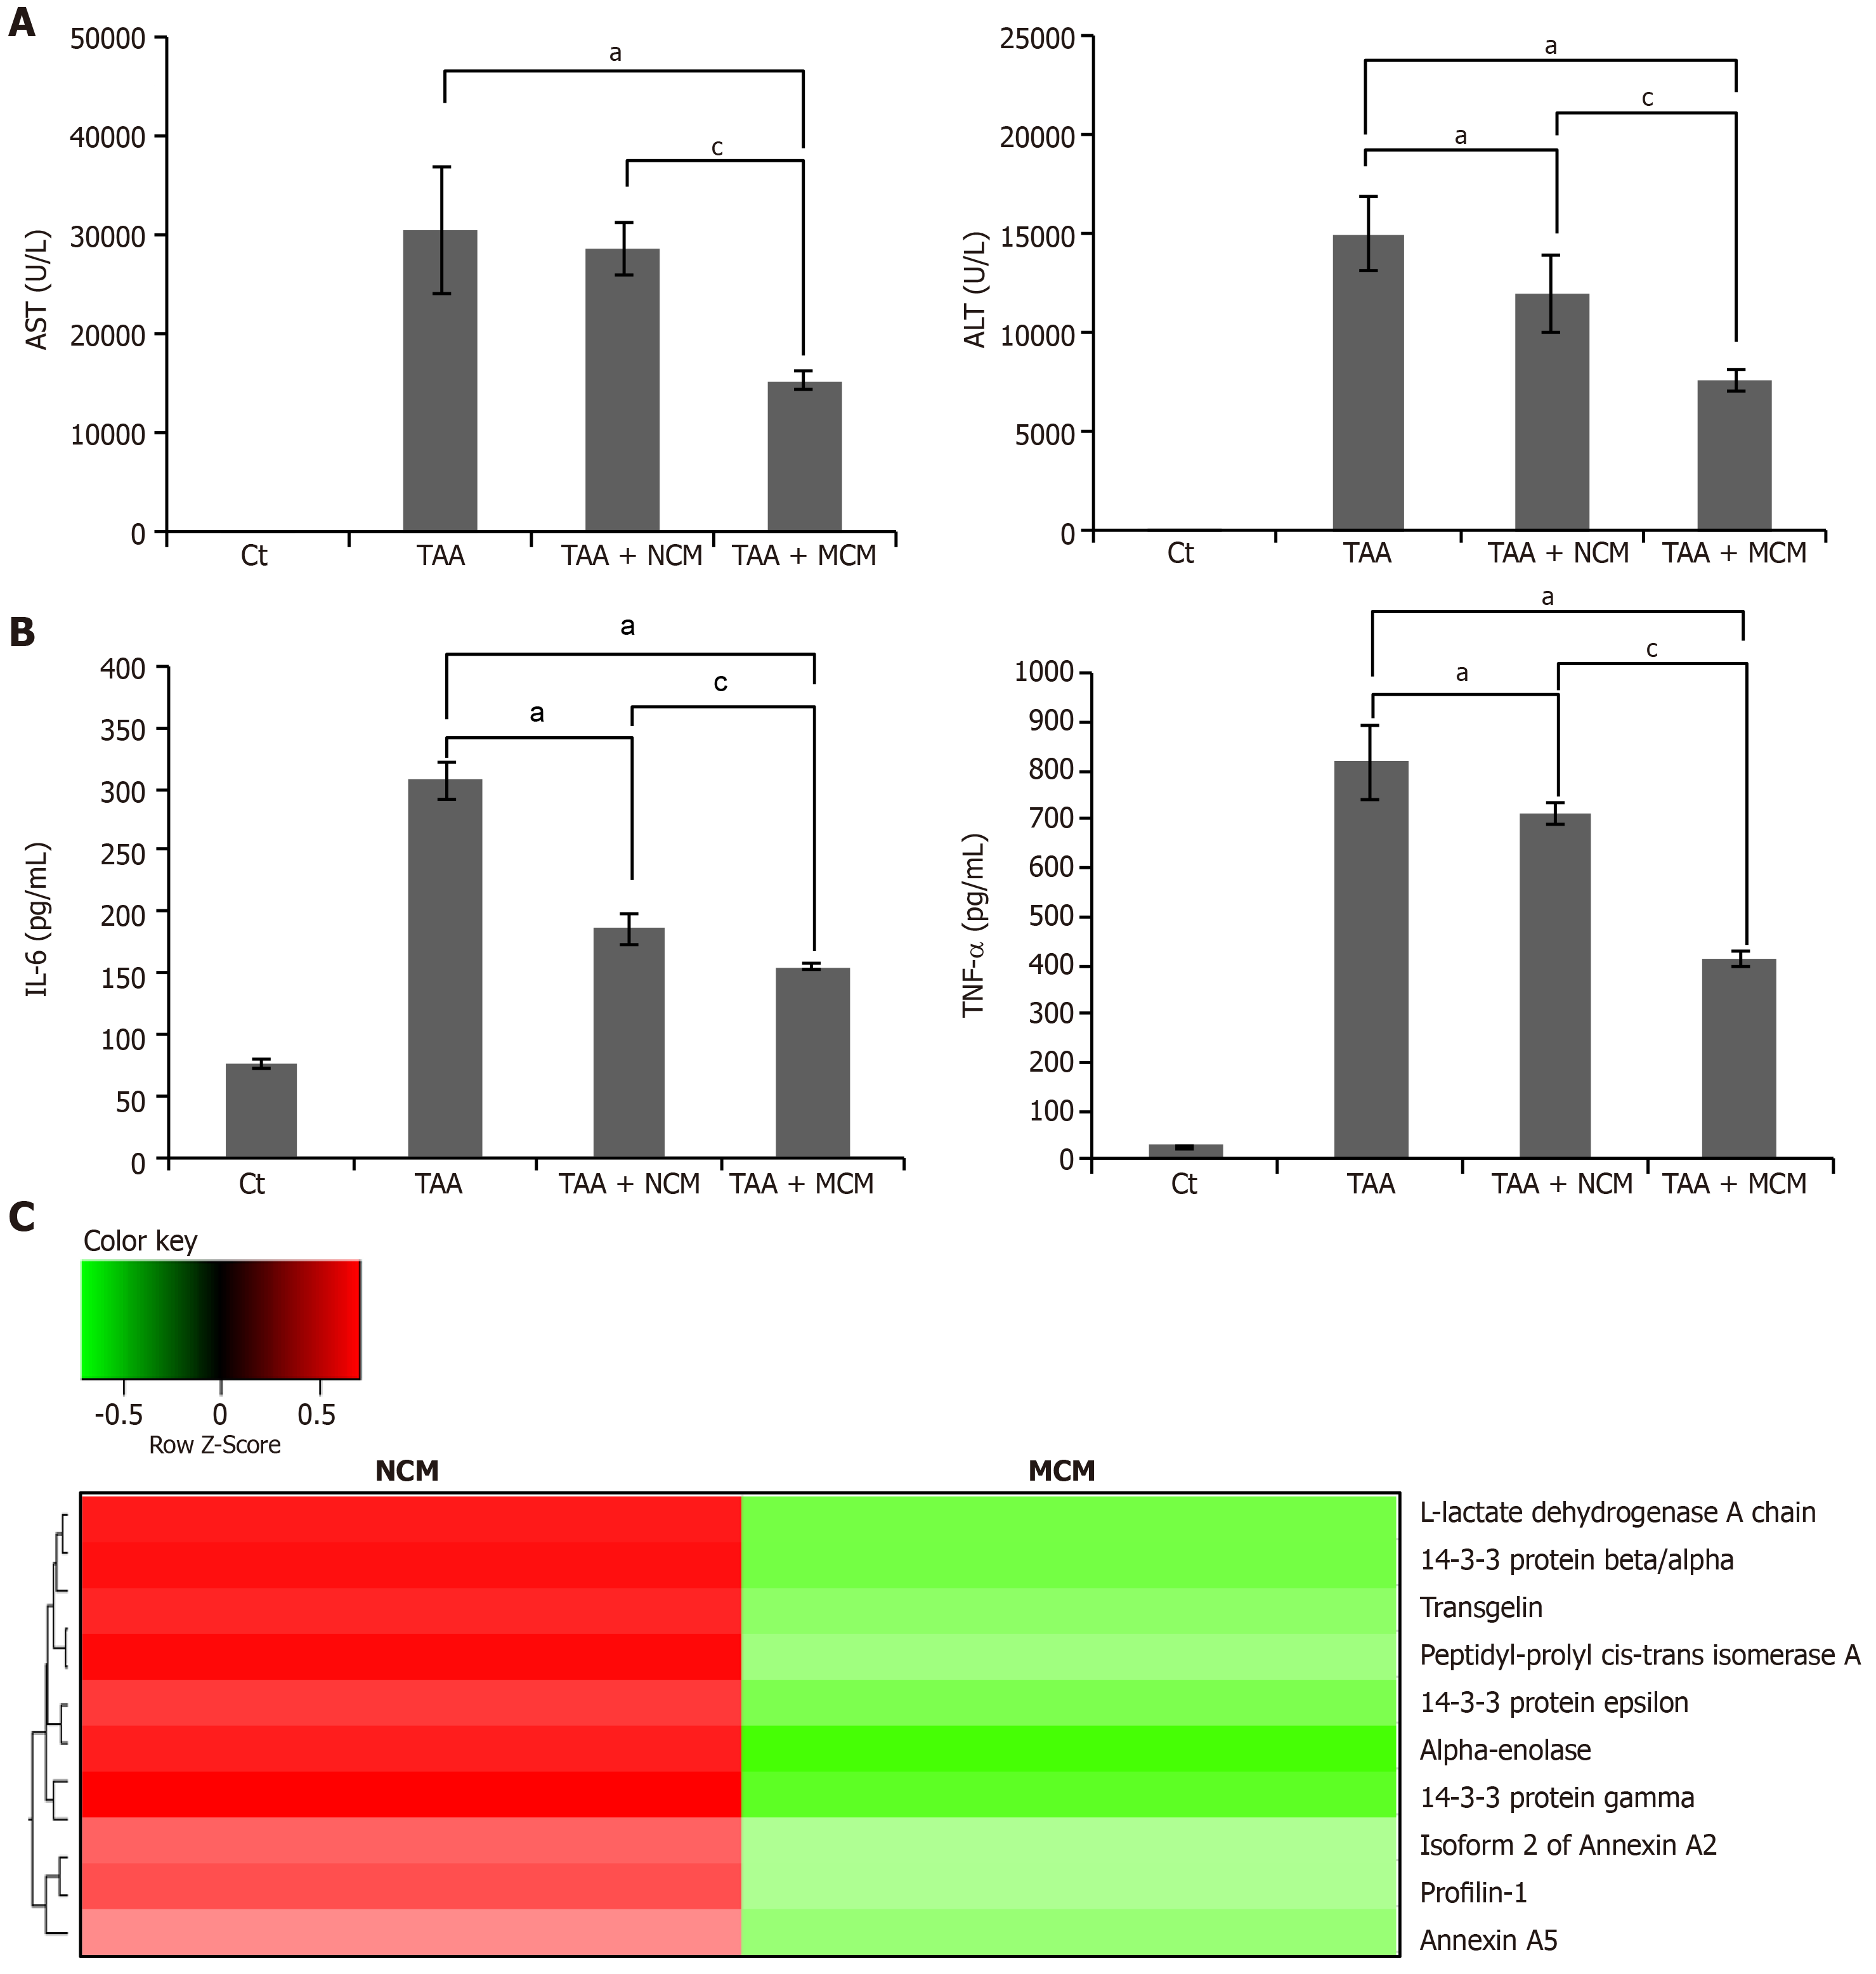
Figure 6 Determination of systemic effects of MCM and analysis of secretome components.
A: Results of ELISA showing serum levels of inflammatory markers (IL-6 and TNF-α) in each group. MCM administration had the greatest effect on lowering the serum levels of IL-6 and TNF-α in thioacetamide (TAA)-treated mice; B: Serology tests of AST and ALT in the mouse model of liver fibrosis. MCM infusion had the greatest effect on decreasing the serum levels of AST and ALT; C: Heat map generated from label-free LC-MS for quantitative proteomics reflecting protein expression values of NCM and MCM. Samples are arranged in columns, proteins in rows. Red shading indicates increased expression in samples compared to control; green shading indicates reduced expression; and black shading indicates median expression. Each sample for LC-MS was pooled from three samples of the secretome. The components and concentrations of various essential proteins varied widely between NCM and MCM, validating the effects of miR-125 transfection. Specifically, MCM exhibited a significantly lower concentration of essential intermediates of TGF-β/Smad signaling, such as transgelin, PIN1, and Profilin-1, than NCM. Values are presented as mean ± standard deviation of three independent experiments. aP < 0.05 vs Ct (TAA). cP < 0.05 between TAA + NCM and TAA + MCM. ALT: Alanine transaminase; AST: Aspartate transaminase; TAA: Thioacetamide; TNF- α: Tumor necrosis factor-α.
- Citation: Kim KH, Lee JI, Kim OH, Hong HE, Kwak BJ, Choi HJ, Ahn J, Lee TY, Lee SC, Kim SJ. Ameliorating liver fibrosis in an animal model using the secretome released from miR-122-transfected adipose-derived stem cells. World J Stem Cells 2019; 11(11): 990-1004
- URL: https://www.wjgnet.com/1948-0210/full/v11/i11/990.htm
- DOI: https://dx.doi.org/10.4252/wjsc.v11.i11.990


