Liu YM, Du YY, Song Y, Xiong HT, Yu HB, Li BH, Cai L, Ma SS, Gao J, Zhang HY, Fang RY, Cai R, Zheng HG. Predicting chemotherapy-induced myelosuppression in colorectal cancer: An interpretable, machine learning-based nomogram. World J Gastroenterol 2025; 31(42): 112180 [PMID: 41278162 DOI: 10.3748/wjg.v31.i42.112180]
Corresponding Author of This Article
Hong-Gang Zheng, MD, Doctor, Department of Oncology, Guang'anmen Hospital, China Academy of Chinese Medical Sciences, No. 5 Beixiange, Xicheng District, Beijing 100053, China. honggangzheng@126.com
Research Domain of This Article
Oncology
Article-Type of This Article
research-article
Open-Access Policy of This Article
This article is an open-access article which was selected by an in-house editor and fully peer-reviewed by external reviewers. It is distributed in accordance with the Creative Commons Attribution Non Commercial (CC BY-NC 4.0) license, which permits others to distribute, remix, adapt, build upon this work non-commercially, and license their derivative works on different terms, provided the original work is properly cited and the use is non-commercial. See: http://creativecommons.org/licenses/by-nc/4.0/
Baishideng Publishing Group Inc, 7041 Koll Center Parkway, Suite 160, Pleasanton, CA 94566, USA
Share the Article
Liu YM, Du YY, Song Y, Xiong HT, Yu HB, Li BH, Cai L, Ma SS, Gao J, Zhang HY, Fang RY, Cai R, Zheng HG. Predicting chemotherapy-induced myelosuppression in colorectal cancer: An interpretable, machine learning-based nomogram. World J Gastroenterol 2025; 31(42): 112180 [PMID: 41278162 DOI: 10.3748/wjg.v31.i42.112180]
Yu-Ming Liu, Yan-Yuan Du, Ying Song, Hong-Tai Xiong, Liu Cai, Su-Su Ma, Han-Yue Zhang, Rui-Ying Fang, Hong-Gang Zheng, Department of Oncology, Guang’anmen Hospital, China Academy of Chinese Medical Sciences, Beijing 100053, China
Hui-Bo Yu, Bai-Hui Li, Jin Gao, Beijing University of Chinese Medicine, Beijing 100029, China
Rui Cai, China-Japan Friendship Hospital, Beijing 100029, China
Author contributions: Liu YM, Du YY, Ma SS, Li BH and Cai R performed data curation; Liu YM, Du YY, Cai L, Zhang HY and Fang RY wrote the original draft; Liu YM, Du YY, Song Y, Xiong HT, Cai L, Ma SS, Yu HB, Gao J, Zhang HY and Fang RY contributed to review and editing; Zheng HG conceived and designed the study and performed the investigation.
Supported by the Beijing Municipal Natural Science Foundation, No. 7252262; High Level Chinese Medical Hospital Promotion Project, No. HLCMHPP2023085; National Natural Science Foundation of China, No. 82174463; National Administration of Traditional Chinese Medicine, No. ZYYCXTD-C-C202205; and China Academy of Chinese Medical Sciences, No. CI2021A01804 and No. 2022S469.
Institutional review board statement: This study has been approved by the Ethics Committee of Guang’anmen Hospital, China Academy of Chinese Medical Sciences (No. 2022-215-KY).
Informed consent statement: The informed consent was waived by the Institutional Review Board.
Conflict-of-interest statement: The authors declare that they have no conflict of interest.
Data sharing statement: The datasets generated during and/or analyzed during the current study are available from the corresponding author on reasonable request.
Corresponding author: Hong-Gang Zheng, MD, Doctor, Department of Oncology, Guang'anmen Hospital, China Academy of Chinese Medical Sciences, No. 5 Beixiange, Xicheng District, Beijing 100053, China. honggangzheng@126.com
Received: July 21, 2025 Revised: August 28, 2025 Accepted: October 14, 2025 Published online: November 14, 2025 Processing time: 116 Days and 15.8 Hours
Abstract
BACKGROUND
Colorectal cancer is a common digestive malignancy, and chemotherapy remains a cornerstone of treatment. Myelosuppression, a frequent hematologic toxicity, poses significant clinical challenges. However, no interpretable machine learning-based nomogram exists to predict chemotherapy-induced myelosuppression in colorectal cancer patients. This study aimed to develop and validate an interpretable clinic-machine learning nomogram integrating clinical predictors with multiple algorithms via a feature mapping algorithm. The model provides accurate risk estimation and clinical interpretability, supporting individualized prevention strategies and optimizing decision-making in patients receiving first-line chemotherapy.
AIM
To develop and validate an interpretable clinic-machine learning nomogram predicting chemotherapy-induced myelosuppression in colorectal cancer.
METHODS
This retrospective study enrolled 855 colorectal cancer patients receiving first-line chemotherapy. Data were split into training (n = 612), validation (n = 153), and testing (n = 90) cohorts. Ten predictors were identified through least absolute shrinkage and selection operator, decision tree, random forest, and expert consensus. Ten machine learning algorithms were applied, with performance assessed by area under the receiver operating characteristic curve (AUC), area under the precision-recall curve (AUPRC), calibration, and decision curves. The optimal model was integrated into a clinic-machine learning nomogram via the feature mapping algorithm, which was internally validated for predictive accuracy and clinical utility.
RESULTS
A total of 855 colorectal cancer patients were enrolled, with 765 cases (April 2020 to December 2023) used for model training and validation, and 90 cases (January 2024 to July 2024) for internal testing. Baseline clinical features did not differ significantly between training and validation cohorts (P > 0.05). Ten predictors were identified through integrated feature selection and expert consensus, including age, body surface area, body mass index, tumor position, albumin, carcinoembryonic antigen, carbohydrate antigen (CA) 19-9, CA125, chemotherapy regimen, and chemotherapy cycles. Among ten machine learning algorithms, extreme gradient boosting achieved the best validation performance (AUC = 0.97, AUPRC = 0.92, sensitivity = 0.79, specificity = 0.92, accuracy = 0.88). Logistic regression confirmed extra trees and random forest as independent predictors, which were incorporated into a clinic-machine learning nomogram. The clinic-machine learning nomogram demonstrated superior discrimination (AUC = 0.96, AUPRC = 0.93, accuracy = 0.90, specificity = 0.95), good calibration, and greater net clinical benefit across a wide probability range (10%-90%). Internal testing further confirmed its robustness and generalizability (AUC = 0.95).
CONCLUSION
The clinic-machine learning nomogram accurately predicts chemotherapy-induced myelosuppression in colorectal cancer, providing interpretability and clinical utility to support individualized risk assessment and treatment decision-making.
Core Tip: This study developed and validated the first clinic-machine learning (ML) nomogram for predicting chemotherapy-induced myelosuppression in colorectal cancer patients receiving first-line chemotherapy. By integrating clinical variables with multiple ML algorithms through a feature mapping algorithm, the model achieved high discrimination, good calibration, and consistent net clinical benefit. Unlike conventional nomograms or single-algorithm approaches, this clinic-ML nomogram combines interpretability with robust predictive accuracy, providing a practical decision-support tool to optimize individualized treatment strategies.
Citation: Liu YM, Du YY, Song Y, Xiong HT, Yu HB, Li BH, Cai L, Ma SS, Gao J, Zhang HY, Fang RY, Cai R, Zheng HG. Predicting chemotherapy-induced myelosuppression in colorectal cancer: An interpretable, machine learning-based nomogram. World J Gastroenterol 2025; 31(42): 112180
Colorectal cancer (CRC) is one of the most prevalent malignant tumors of the digestive system, posing a significant threat to global public health. Recent statistics indicate that in 2022, approximately 1.926 million new CRC cases were diagnosed globally, with an incidence rate of 9.6%, ranking third among cancers. Furthermore, CRC accounted for approximately 904000 deaths, representing a mortality rate of 9.3%, second only to lung cancer. Consequently, CRC places a substantial economic and social burden on healthcare systems worldwide[1].
In recent years, the advent of targeted agents and immunotherapies, such as bevacizumab and pembrolizumab, has notably improved both the five-year survival rate and quality of life for CRC patients. However, chemotherapy remains the cornerstone of medical treatment in CRC management. For preoperative neoadjuvant therapy, surgical intervention is recommended for patients classified as T1-2N0M0. In contrast, patients with T3-T4 CRC, regardless of surgical indications, are advised to receive preoperative neoadjuvant chemotherapy or chemotherapy combined with targeted therapy. The chemotherapy regimens predominantly used include CapeOx (capecitabine and oxaliplatin), FOLFOX (fluorouracil, leucovorin, and oxaliplatin), and FOLFIRI (fluorouracil, leucovorin, and irinotecan). In the context of postoperative adjuvant therapy, chemotherapy is recommended for stage II patients with high-risk features and all patients with stage III-IV CRC, excluding stage I disease. For patients with recurrent or metastatic CRC, systemic therapy involving chemotherapy, targeted therapy, and immunotherapy is selected based on genetic mutation profiles and metastatic status, with chemotherapeutic drugs typically including 5-fluorouracil, irinotecan, oxaliplatin, and capecitabine[2]. Throughout any phase of CRC treatment, timely evaluation of therapeutic efficacy and adverse effects is essential, with chemotherapy-associated toxicities representing a major concern for clinicians. Chemotherapy may lead to adverse reactions involving multiple organ systems, including gastrointestinal symptoms (nausea/vomiting, diarrhea), dermatological manifestations (mucositis, alopecia), hematological toxicities (myelosuppression, coagulopathies), and neurological disorders (peripheral neuropathy, cognitive impairment)[3]. Among these, myelosuppression is one of the most frequently encountered hematological toxicities and represents a common dose-limiting side effect of anticancer agents. Chemotherapy-induced myelosuppression (CIM) arises from cytotoxic chemotherapy-mediated destruction of rapidly dividing hematopoietic stem cells and progenitor cells in the bone marrow, manifesting primarily as neutropenia, thrombocytopenia, and anemia[4-7]. CIM not only increases the risks of infection, dyspnea, fatigue, and hemorrhage but also necessitates chemotherapy dose reductions, delays, or cessation, potentially diminishing therapeutic efficacy, escalating economic burdens, and adversely impacting long-term survival outcomes. Moreover, attention to psychological and emotional well-being during treatment is equally crucial, as evidence demonstrates that the psychosocial impact of CIM such as disruption of family life, emotional distress, and interpersonal relationships often exceeds the severity of physical symptoms, thereby intensifying clinical workloads for patients and healthcare providers[8]. Thus, accurately predicting the risk of myelosuppression after first-line chemotherapy and proactively initiating preventive measures can yield substantial clinical benefits. In recent years, machine learning (ML) has been increasingly applied in oncology for risk prediction and clinical decision support, owing to its capacity to handle high-dimensional data, capture complex nonlinear relationships, and improve predictive accuracy beyond conventional regression approaches. Compared to traditional nomograms, which provide interpretable visualization but are limited in accommodating multidimensional interactions, ML algorithms such as least absolute shrinkage and selection operator (LASSO), random forest (RF) can effectively manage collinearity, enhance feature selection, and mitigate overfitting a common challenge of ML models lies in their “black-box” nature, which constrains clinical applicability due to insufficient interpretability (10.1167/tvst.9.2.14). To address this methodological gap, our study introduces a feature mapping algorithm (FMA) to integrate multiple ML algorithms with conventional nomogram construction, thereby combining the interpretability of clinical nomograms with the robustness and high discrimination of ML methods. This integrative framework not only overcomes the limitations of single-model approaches but also ensures greater stability, calibration, and clinical utility.
In this study, 10 common MLs were combined with a nomogram model to construct a clinical predictive tool for evaluating CIM risk after first-line chemotherapy in CRC patients. The predictive model incorporated patient baseline characteristics, laboratory test results, CRC staging, and chemotherapy regimens, providing clinicians with actionable insights for optimizing patient care.
MATERIALS AND METHODS
Study design
The present study consists of the following five stages: (1) Screening and enrolling in patients admitted to Guang’anmen Hospital, China Academy of Chinese Medical Sciences, based on predetermined inclusion and exclusion criteria, followed by collection of clinical data to establish a comprehensive analytical database; (2) Identifying candidate predictors through integrated analyses involving LASSO regression, decision trees (DT), and RF; (3) Developing and validating predictive models based on 10 widely-used MLs, comprehensively evaluating the model performance and clinical decision-making performance, and subsequently determining the optimal ML model; (4) Constructing a clinical nomogram model (clinic nomogram) and a combined clinical-ML nomogram (clinic-ML nomogram), and subsequently comparing the performance among the optimal ML, the clinic nomogram, and the clinic-ML nomogram to identify the best-performing clinical prediction model; and (5) Conducting internal testing of the final optimal predictive model (Figure 1).
Figure 1 Flowchart of the study protocol.
CRC: Colorectal cancer; T: Tumor; N: Node; M: Metastasis; HM: Hepatic metastasis; LM: Lung metastasis; PM: Peritoneal metastasis; BSA: Body surface area; BMI: Body mass index; ALB: Albumin; CEA: Carcinoembryonic antigen; CA: Carbohydrate antigen; LASSO: Least absolute shrinkage and selection operator; ML: Machine learning; LR: Logistic regression; DT: Decision trees; RF: Random forest; XGBoost: Extreme gradient boosting; SVM: Support vector machines; GBM: Gradient boosting machines; KNN: K-Nearest neighbors; ANN: Artificial neural network; ET: Extreme trees; ROC: Receiver operating characteristic; AUC: Area under the curve; PR: Precision-recall; AUPRC: Area under the precision-recall curve; PPV: Positive predictive value; NPV: Negative predictive value.
General information
Clinical data from patients who met the inclusion and exclusion criteria and were hospitalized at the Department of Oncology, Guang’anmen Hospital, China Academy of Chinese Medical Sciences, from April 2020 to July 2024, were retrospectively collected.
Inclusion criteria: (1) Patients diagnosed with CRC according to the Chinese protocol of diagnosis and treatment of CRC (2023 edition)[9], with diagnosis confirmed by pathological examination; (2) Patients undergoing first-line chemotherapy regimens including CapeOx (capecitabine and oxaliplatin), FOLFOX (fluorouracil, leucovorin, and oxaliplatin), or FOLFIRI (fluorouracil, leucovorin, and irinotecan); and (3) Patients without pre-existing myelosuppression before initiating first-line chemotherapy, defined specifically by peripheral blood white blood cell count ≥ 4.0 × 10⁹/L, absolute neutrophil count ≥ 2.0 × 10⁹/L, platelet count ≥ 100 × 109/L, and hemoglobin ≥ 115 g/L (females) or ≥ 130 g/L (males).
Exclusion criteria: (1) Patients with incomplete clinical data including baseline characteristics, laboratory test results, clinical staging of malignancy, genetic testing results, chemotherapy regimens, and cycles; (2) Patients with confirmed myelosuppression attributed to other identifiable factors; and (3) Patients diagnosed with co-existing systemic diseases (potentially confounding outcome measurement), including hematologic disorders such as aplastic anemia or myelofibrosis, autoimmune diseases such as systemic lupus erythematosus, and infectious diseases.
This study was conducted in accordance with the guidelines outlined in the Declaration of Helsinki (2024)[10] and was approved by the Ethics Committee of Guang’anmen Hospital, China Academy of Chinese Medical Sciences (No. 2022-215-KY). Methodologically, the study adheres to the requirements described in the Transparent Reporting of a Multivariable Prediction Model for Individual Prognosis or Diagnosis statements[11-13].
Outcome indicators, candidate predictors, and definitions
The primary outcome of this study was the occurrence of myelosuppression: (1) Criteria for assessing the outcome indicator: Myelosuppression was evaluated based on the acute and subacute toxicity grading standards for anticancer drugs issued by the World Health Organization. Specifically, myelosuppression was defined by meeting at least one of the following conditions: Peripheral blood white blood cell count < 4.0 × 10⁹/L, absolute neutrophil count < 2.0 × 10⁹/L, platelet count < 100 × 109/L, or hemoglobin level < 115 g/L in females or < 130 g/L in males[14]; and (2) Timing for measurement of the outcome indicator: Neutrophil counts typically begin to decline approximately one week after chemotherapy cessation, reaching a nadir between days 10 and 14. Platelet counts usually decrease slightly later than neutrophils, reaching their lowest point approximately two weeks after chemotherapy, often declining rapidly[15]. Therefore, in this study, the measurement period for the outcome indicator (complete blood count analysis) was scheduled between the completion of the previous chemotherapy cycle and the initiation of the next cycle, typically conducted between days 3 to 10 post-chemotherapy. This timing allowed clinicians to assess the occurrence of myelosuppression after first-line chemotherapy, facilitating timely adjustments to treatment regimens.
A total of 24 candidate predictors were included in this study, encompassing patient demographic information [age, gender, smoking status, diabetes, hypertension, body surface area (BSA), and body mass index (BMI)], laboratory test results [albumin (ALB), carcinoembryonic antigen (CEA), carbohydrate antigen (CA) 19-9, CA125, KRAS, BRAF, and TP53], CRC staging information [T-stage, N-stage, M-stage, overall staging, tumor position, hepatic metastasis, lung metastasis (LM), and peritoneal metastasis], and first-line chemotherapy details (chemotherapy cycles and chemotherapy regimens): (1) Selection and determination of candidate predictors: Candidate predictors were identified through an integrated approach combining CRC clinical guidelines, expert consensus statements, recent literature reviews, and clinical expertise. Ultimately, 24 predictors previously demonstrated or hypothesized to have causal or strong associative relationships with myelosuppression outcomes were selected according to established inclusion and exclusion criteria; (2) Measurement methods and timing for candidate predictors: For demographic information, uniform and calibrated tools were employed consistently across all participants. Laboratory indicators were measured at Guang’anmen Hospital prior to chemotherapy initiation. CRC staging was based strictly on pathological assessment criteria to minimize potential information bias; (3) Classification of variable types for candidate predictors: To preserve maximal original information and enhance the predictive accuracy and clinical applicability of the prediction models, candidate predictors were retained as continuous variables without transformation. However, the following four predictors were defined explicitly as categorical variables: Smoking status was categorized into current/former smoker or non-smoker; CRC staging was categorized according to the 8th edition of the American Joint Committee on Cancer tumor (T) node (N) metastasis (M) classification into stages I, II, III, and IV[16]; Tumor position was classified anatomically into five regions ascending colon, transverse colon, descending colon, sigmoid colon, and rectum; and first-line chemotherapy regimens were grouped into three categories based on the Chinese Protocol of Diagnosis and Treatment of CRC (2023 edition), specifically CapeOx (capecitabine and oxaliplatin), FOLFOX (fluorouracil, leucovorin, and oxaliplatin), and FOLFIRI (fluorouracil, leucovorin, and irinotecan)[9]. Other candidate predictors were not specifically categorized and retained their original continuous variable status; and (4) Blinding: As the measurement of candidate predictors in this study involved no subjective judgment by either participants or researchers, blinding procedures were not required for predictor assessment.
Data preprocessing and predictor selection
Data collection and verification: In terms of data collection, this study employed a registry-based data acquisition approach to ensure adequate real-world representativeness. Regarding data entry and verification, a double-entry verification method was utilized to guarantee data accuracy and reliability. Discrepancies identified during simultaneous data entry and checking were promptly resolved, and logical consistency checks were conducted to maintain data completeness, thereby enhancing the overall performance of the prediction model. Furthermore, given that the inclusion and exclusion criteria explicitly specified the exclusion of participants with incomplete clinical information, there was no need to address missing data or to eliminate candidate predictors due to incomplete records.
Sample size calculation: The objectivity of sample size, the number of predictors, and the incidence rate of outcome events significantly influence the performance of clinical prediction models[17]. A scientifically justified and adequately sized sample is critical to ensure the stability and generalizability of the prediction model. In this study, the sample size calculation was conducted by integrating both the classical “10 events per variable (EPV)” rule-of-thumb and the four-step sample size calculation method proposed by Riley et al[18]. The largest sample size obtained through these methods was considered the minimum required sample size for this study.
Predictor screening and determination: Considering the characteristics of the collected data, research objectives, sample size, and the distinct advantages of various selection methods, three analytical techniques RF, DT, and LASSO were chosen for predictor screening and determination, combined with expert clinical experience and contemporary research insights.
Compared to traditional regression methods (e.g., stepwise regression or principal component analysis), LASSO has distinct advantages in selecting critical predictors and managing collinearity among variables. By incorporating a penalty term, LASSO effectively identifies the most representative and closely associated predictors, even with relatively smaller sample sizes. This approach minimizes the risk of model overfitting, enhances accuracy and generalizability, and mitigates optimism bias and collinearity interference[19], resulting in more interpretable models. RF excels in comprehensively evaluating predictor importance, especially when dealing with complex and nonlinear relationships among laboratory indicators, imaging examinations, and lifestyle factors. By aggregating multiple DT, it reduces the impact of individual outliers and data noise, thus providing greater predictive accuracy[20]. DT presents the relationships between predictors and outcome events through a clear, tree-shaped graphical structure, capable of handling various complex data types. It offers straightforward interpretability in clinical practice, facilitating intuitive understanding of predictive outcomes[21]. Considering the goal of developing a prediction model with both high accuracy and strong interpretability, as well as the mixed nature (continuous and categorical) of the data and existing collinearity among certain predictors (e.g., CRC staging factors, BMI, and BSA in patient general information), the present study leveraged the complementary strengths of LASSO, RF, and DT to achieve optimal predictor selection.
Training, validation, and selection of MLs
Model development strategy: This study employed ten different ML algorithms to develop and validate predictive models for CIM. The selected algorithms included logistic regression (LR), DT, RF, extreme gradient boosting (XGBoost), support vector machines (SVM), adaptive boosting, gradient boosting machines (GBM), K-Nearest neighbors (KNN), artificial neural network (ANN), and extreme trees (ET). The models were trained on the training set and subsequently evaluated on the validation set to assess predictive performance.
Model validation: The initial dataset was split into a training set and a validation set in an 8:2 ratio using Python’s pandas library. During model development, the more robust 10-fold cross-validation approach was adopted to fully leverage the available data, minimize random bias, and enhance both the stability and generalizability of the models. This method has been widely recommended for achieving reliable performance metrics[22,23].
Evaluation of model performance: An effective clinical prediction model should exhibit both high discrimination and accurate calibration. Discrimination refers to the ability to correctly distinguish between binary outcomes, whereas calibration concerns the accuracy of predicted probabilities or risk estimates. In this study, eight metrics were used to evaluate model performance: Area under the receiver operating characteristic (ROC) curve (AUC), area under the precision-recall curve (AUPRC), accuracy, sensitivity, specificity, F1 score, positive predictive value (PPV), and negative predictive value (NPV). Among these, the AUC and the AUPRC served as the primary performance indicator, with values ranging from 0.5 to 1.0. Higher AUC values indicate stronger discrimination and greater accuracy. Conventionally, an AUC of 0.70-0.90 is considered moderate, whereas AUC > 0.90[24] is considered high-performance, thereby warranting further model construction. Unlike the AUC, the AUPRC provides a relative evaluation of predictive model performance, primarily judged by its degree of improvement over the random baseline. The ROC curve is generally insensitive to systematic error and demonstrates strong interpretability in datasets that are standardized, balanced, and relatively easy to interpret[24]. However, precision-recall curves are increasingly employed in clinical prediction model research because the inherent imbalance of clinical data highlights performance differences that ROC analysis may fail to capture[25]. Therefore, in the context of imbalanced clinical datasets, AUPRC can be compared with AUC to provide a more accurate and comprehensive assessment of the practical utility of prediction models in identifying low-probability events. To assess calibration, three main approaches are typically applied: (1) Mean calibration (calibration in the large) is assessed by comparing the average predicted outcomes or average predicted risks with the average observed outcomes or risks; (2) Fitting a calibration line on observations vs predictions; and (3) Fitting a smooth calibration curve to assess calibration locally. In this study, calibration curves were plotted to evaluate and determine the calibration properties and threshold values of the predictive models. The performance observed on the validation set was used as the primary yardstick to ensure the model’s complexity was optimized, thereby minimizing underfitting and overfitting. This process yielded the optimal ML[26].
Clinical decision assessment of predictive models: In contrast to performance evaluation, decision curve analysis (DCA) focuses on the practical clinical utility of a model, drawing upon decision theory to weigh factors such as outcome incidence, therapeutic benefits, and potential harms. DCA is therefore better aligned with real-world clinical scenarios, offering a more comprehensive basis for clinical decision-making when used in conjunction with conventional performance metrics[27,28]. It is important to note that a model must exhibit satisfactory performance before DCA is applied, given the inherent interplay between predictive accuracy and clinical decision evaluation.
Development and performance evaluation of clinic nomogram and stacked clinical prediction models
A nomogram is a visual statistical tool that integrates biological and clinical variables into a single graphical interface, facilitating prediction of outcome probabilities and aiding in clinical decision-making[29]. In this study, a multivariable ordinal LR approach was initially adopted to construct a conventional nomogram-based clinical prediction model (hereafter referred to as the “clinic-nomogram”). Subsequently, to combine the strong interpretability of the nomogram with the high accuracy of MLs, a FMA was employed to convert the optimal ML model into a clinic-ML nomogram. AUC, AUPRC, accuracy, sensitivity, specificity, F1 score, PPV, NPV, calibration curves and DCA were used to evaluate and compare the performances of the optimal ML, clinic nomogram, and clinic-ML nomogram, thereby identifying the best-performing clinical prediction model. This form of algorithmic stacking can further enhance model accuracy and generalizability, thereby improving its clinical utility[22].
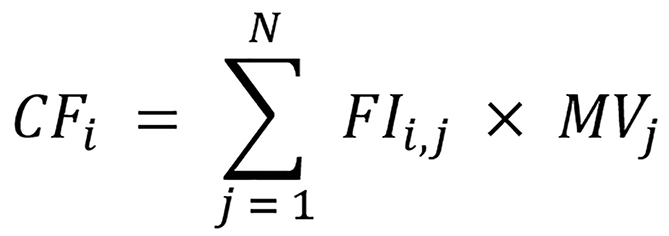
The FMA generates for the clinic-ML nomogram the values of clinic features (CF) as:
Where FIi,j is the feature importance of the ith CF in the jth trained ML model, MVj is the value of the jth ML models in the ML nomogram with i∈ (1, M) and j∈ (1, N) where M is the number of clinic features and N is the number of ML models, respectively[30].
By integrating the nomogram and ML via the FMA, this approach not only addresses the nomogram’s limitations in handling complex data relationships but also surmounts the ML’s challenges regarding interpretability of internal parameters and decision processes. Consequently, the resulting predictive model is more intuitive and better aligned with real-world clinical needs.
Statistical analysis
Continuous variables following a normal distribution were expressed as mean ± SD, whereas those not meeting the criteria for normality were reported as the median and interquartile range. For the statistical comparisons, continuous variables conforming to a normal distribution were analyzed using the t-test, while skewed variables were assessed via the Mann-Whitney U test. Categorical variables were presented as percentages or frequencies and compared using the χ2 test. LASSO, DT, and RF were employed for predictor selection. In LASSO regression, an L1 regularization term (i.e., a penalty term) is added to the cost function of a traditional linear regression model, thereby shrinking coefficients toward zero for less significant features. This process facilitates both feature selection and model simplification[31,32]. DT, RF, and the 10 MLs were all implemented using R (version 4.4.2) and Python (version 3.13.0). The ML algorithms, LASSO, and ROC analyses were performed via the Scikit-learn package in Python 3.13.0, while calibration curves and DCA were generated using the “rms” and “dca” packages in R 4.4.2, respectively. Statistical significance was defined at P < 0.05 (two-sided).
RESULTS
Baseline characteristics of study participants
A total of 855 participants who were hospitalized at the Department of Oncology, Guang’anmen Hospital of the China Academy of Chinese Medical Sciences from April 2020 to July 2024 were enrolled. Using a time-based split approach, data from April 2020 to December 2023 (n = 765) were utilized for model training and validation, and these 765 cases were randomly divided into a training set and a validation set in an 8:2 ratio. Data collected from January 2024 to July 2024 (n = 90) were subsequently used to assess the performance and clinical decision efficacy of the optimal predictive model. As shown in Table 1, there were no statistically significant differences in clinical characteristics between the training and validation sets (P > 0.05).
Table 1 Baseline characteristics of colorectal cancer patients, n (%).
An objective sample size is crucial for ensuring both robust model performance and clinical decision efficacy. Because the clinical data in this study were derived from a specific time frame, a reverse validation method was adopted to evaluate the objectivity of the sample size: (1) Parameter setting: A pilot analysis of 100 cases was conducted to estimate the event incidence in the study population, yielding an event fraction of 32%. The number of candidate predictors was set to 10, the shrinkage factor (S) to 0.9, and the root mean squared prediction error to 0.05; (2) 10-EPV: According to the “10 EPV” rule of thumb, at least 313 cases were required; (3) Riley et al’s method[18]: Referring to the sample size calculation method proposed by Riley et al[18], at least 475 cases were needed; and (4) Combining both approaches, a minimum of 475 participants were deemed necessary. Ultimately, 765 participants were included for model training and validation in this study, indicating an adequate and objective sample size (Figure 2).
Figure 2 Sample size calculation flowchart.
rMPSE: Root mean squared prediction error; MPSE: Mean squared prediction error; EPV: Events per variable. In formula: Ø: Events fraction; δ: A margin of error, generally recommend < 0.05; P: Number of candidate predictors; S: Shrinkage factor; R2cs: A (conservative) value for the anticipated model performance is required, as defined by the Cox-Snell R squared statistic; MAPE: The mean absolute prediction error; n: The sample size.
Selection and confirmation of predictors
Using LASSO, a total of 19 predictors were identified when λ-se was adopted as the selection criterion. These predictors included age, gender, smoking, diabetes, hypertension, BSA, BMI, T, N, M, staging, position, LM, ALB, CEA, CA19-9, CA125, TP53, chemotherapy cycles, and chemotherapy regimens (Figure 3). When applying the RF, mean decrease accuracy was used as the metric of predictor importance. Predictors with an importance score exceeding the mean across all variables were retained, yielding eight predictors: BSA, BMI, position, ALB, CEA, CA19-9, CA125, and chemotherapy regimens. Using the DT, the split nodes were based on average information gain values, resulting in 12 predictors: Age, gender, diabetes, BSA, BMI, N, position, ALB, CEA, CA19-9, CA125, and chemotherapy regimens (Figure 4). The mean importance derived from both the RF and DT algorithms shows certain commonalities. Both algorithms exhibit a similar “high-medium-low” gradient for variables such as BSA, BMI, ALB, CEA, CA19-9, CA125, position, and chemotherapy regimens. Indicators related to physical condition/nutrition, such as BSA, BMI, and ALB, consistently rank among the top, with their importance exceeding 0.10, indicating a highly significant contribution to the model. Tumor-related markers, including CEA, CA19-9, and CA125, also exhibit high importance, with values ranging between 0.05 and 0.10, suggesting that they may still provide valuable information. Both position and chemotherapy regimens carry some weight in both algorithms.
Figure 3 Candidate predictor screening using least absolute shrinkage and selection operator.
A: Path diagram of least absolute shrinkage and selection operator (LASSO) regression coefficients for candidate predictors; B: Cross-validation curves for LASSO. MSE: Mean squared error.
Figure 4 Mean importance of candidate predictors.
A: Random forest algorithm; B: Decision trees algorithm. BSA: Body surface area; BMI: Body mass index; T: Tumor; N: Node; M: Metastasis; HM: Hepatic metastasis; LM: Lung metastasis; PM: Peritoneal metastasis; ALB: Albumin; CEA: Carcinoembryonic antigen; CA: Carbohydrate antigen.
To ensure both methodological rigor and clinical relevance, we integrated the results from the three feature selection methods (LASSO, RF, and DT). Specifically, we first focused on the intersection of predictors consistently identified by all three algorithms, yielding eight robust variables: BSA, BMI, position, ALB, CEA, CA19-9, CA125, and chemotherapy regimens. These predictors were considered reliable given their reproducibility across distinct algorithmic approaches. In addition, through evaluation by three senior oncologists and based on accumulated clinical experience, age and chemotherapy cycles were recognized as having substantial influence on the risk of CIM in CRC patients. Consequently, these two clinically important variables were also incorporated. Taken together, the final set of ten predictors included age, BSA, BMI, position, ALB, CEA, CA19-9, CA125, chemotherapy regimens, and chemotherapy cycles, which were subsequently used for model development and validation.
Performance evaluation of the clinical prediction models
The ten selected predictors were input into ten different MLs, and a 10-fold cross-validation was performed (Figure 5). All ten ML algorithms showed competitive performance in predicting the risk of myelosuppression. It is worth noting that XGBoost demonstrated strong ranking ability in distinguishing between positive and negative samples in the validation set, with an AUC of 0.97, sensitivity of 0.79, and specificity of 0.92. In addition, the XGBoost model achieved an AUPRC of 0.92 in the training set, which was substantially higher than the random baseline level of 0.36. Compared with the baseline, XGBoost demonstrated an approximate 2.56-fold improvement, indicating a marked enhancement in model performance. These results suggest its excellent discriminatory power in differentiating the risk levels of myelosuppression. To comprehensively evaluate the model’s performance, this study also calculated accuracy, F1 score, PPV, and NPV. XGBoost exhibited favorable results on these metrics, achieving values of 0.88, 0.79, 0.79, and 0.92, respectively, in the validation set (Table 2 and Figure 6).
Figure 6 Curves for 10 machine learnings.
A and B: Receiver operating characteristic curves of training set (A) and validation set (B); C and D: Precision-recall curves of training set (C) and validation set (D). LR: Logistic regression; DT: Decision trees; RF: Random forest; XGBoost: Extreme gradient boosting; SVM: Support vector machines; GBM: Gradient boosting machines; KNN: K-Nearest neighbors; ANN: Artificial neural network; ET: Extreme trees; AUC: Area under the curve; AP: Average precision.
Table 2 Performance of 10 machine learnings for predicting myelosuppression after first-line chemotherapy for colorectal cancer.
Development of the clinic-ML nomogram and comparison of clinical prediction models
Univariable and multivariable LR analyses (Table 3) indicated that the ET and RF models were independent predictors of myelosuppression. Consequently, this study applied the FMA to ET and RF to develop a clinic-ML nomogram (Figure 7A). In addition, a conventional clinic nomogram was constructed (Figure 7B). The AUC, AUPRC, accuracy, sensitivity, specificity, F1 score, PPV, NPV, calibration curves, and DCA were employed to assess the performance and clinical efficacy of the three resulting predictive models XGBoost, clinic nomogram, and clinic-ML nomogram (Table 4). In the validation set, the clinic-ML nomogram achieved an AUC of 0.96 (> 0.90), along with an accuracy of 0.90 and a specificity of 0.95, demonstrating excellent discriminatory ability for differentiating patients with and without myelosuppression (Figure 8). In the precision-recall curve analysis, the clinic-ML nomogram achieved an AUPRC of 0.93, substantially exceeding the random baseline level of 0.36. This corresponds to an approximately 2.59-fold improvement over random prediction, indicating high precision and recall in model construction and demonstrating strong risk prediction capability in clinical applications (Figure 9). Calibration curves revealed acceptable agreement between predicted and observed values in both the training and validation sets, indicating good calibration and accurate risk estimation (Figure 10). The DCA showed that, if the threshold probability ranges from 10% to 90%, employing the nomogram’s predicted probability to guide timely clinical intervention prior to first-line chemotherapy provides greater net benefit compared to either no intervention or universal intervention (Figure 11). Overall, based on these performance indicators, the clinic-ML nomogram demonstrated superior predictive accuracy and clinical net benefit compared to both XGBoost and the conventional clinic nomogram, making it the optimal clinical prediction model identified in this study.
Figure 7 The nomogram for predicting myelosuppression induced by first-line chemotherapy in colorectal cancer.
A: Clinic-machine learning; B: Clinic. BSA: Body surface area; BMI: Body mass index; ALB: Albumin; CEA: Carcinoembryonic antigen; CA: Carbohydrate antigen.
The optimal predictive model, identified in the previous steps, was subjected to internal testing using data from 90 participants in the testing set. The clinic-ML nomogram continued to exhibit favorable accuracy, discrimination, and calibration (Table 5), achieving an AUC of 0.95 (> 0.9), an AUPRC of 0.83 (compared to the random baseline, it increased by 2.41 times). Moreover, it demonstrated superior clinical decision-making performance, indicating the model’s potential for broader generalization and applicability (Figure 12).
In recent years, the incidence and mortality rates of CRC have continued to rise worldwide, making it one of the leading malignant tumors affecting public health. Although targeted and immunotherapeutic strategies have achieved remarkable progress in CRC management, chemotherapy remains the core treatment modality for patients with locally advanced and metastatic CRC. At present, regimens such as FOLFOX and FOLFIRI which include agents known for significant myelotoxicity are still widely employed in clinical practice[2]. However, CIM is among the most frequent and severe adverse events. In multiple previous studies, XELOX and FOLFOX have been widely recognized as comparable first-line chemotherapy regimens in terms of efficacy; however, they exhibit distinct profiles of myelosuppression. Specifically, thrombocytopenia is more frequently observed in patients receiving XELOX, whereas neutropenia is more common in those treated with FOLFOX[33,34]. When the therapeutic efficacy of different regimens is comparable, the differences in adverse events often play a decisive role in determining patients’ treatment adherence, quality of life, and the feasibility of continuing therapy. Severe thrombocytopenia or neutropenia not only leads to chemotherapy delays and dose reductions but also increases the risks of transfusion, hospitalization, and infection-related complications. Therefore, a systematic and detailed assessment of chemotherapy-associated adverse events, particularly hematologic toxicities, is of critical clinical importance for guiding individualized treatment strategies, improving patients’ quality of life, and optimizing long-term outcomes.
The clinic-ML nomogram is a novel predictive tool that integrates ML techniques into the conventional nomogram framework. Its construction process begins with the application of ML algorithms for feature selection, model training, and optimization in a high-dimensional dataset. From the identified predictive factors and optimized model parameters, a more interpretable nomogram with enhanced predictive performance is generated. In this study, we proposed the use of the FMA algorithm to integrate clinical variables with multiple ML models for the construction of a clinic-ML nomogram. This approach not only enhanced predictive accuracy but also improved interpretability, thereby demonstrating both methodological innovation and clinical relevance. The FMA framework allowed us to balance the strengths of different algorithms and clinical knowledge, overcoming the limitations of single-model approaches and ensuring a more robust representation of complex clinical scenarios. The FMA is a weighting mechanism based on feature importance in various MLs; its general formula is as follows:
In this formula, CFi represents the final value for the clinical feature; MVj denotes the importance of the jth clinical feature in the ith ML; MVj is the prediction value produced by the ML; M is the total number of clinical features; and N is the total number of ML. Each feature value CFi is derived from the results of multiple trained ML, each model’s output MVj reflects its computed prediction for the input data. The feature importance weight FIi,j indicates how much feature i contributes in the jth ML model, allowing for the possibility that the same feature may carry different weights across various models. Ultimately, the final feature value CFi is obtained through a weighted summation of all model predictions and their corresponding weights. By leveraging the FMA to build a clinic-ML nomogram, not only can the predictive stability be enhanced through multi-model integration, but the accuracy is also improved by accounting for each feature’s varying contributions across different models. This weighting approach provides an intuitive explanation of each feature’s influence, rendering the model more user-friendly and clinically applicable.
This retrospective study developed an ML-based and a clinic nomogram-based model for predicting myelosuppression in CRC patients receiving first-line chemotherapy. Building on these results, a clinic-ML nomogram was subsequently constructed using the FMA. A total of 855 patients were enrolled, of whom 765 were used for model training and validation (split 8:2) based on the timeline of data collection, and the remaining 90 were used to evaluate the performance and clinical benefits of the optimal predictive model. Guided by current guidelines, consensus statements, and expert clinical experience, 24 candidate predictors were initially proposed. These were then reduced to 10 final predictors: Age, BSA, BMI, position, ALB, CEA, CA19-9, CA125, chemotherapy regimens, and chemotherapy cycles through a combination of LASSO regression, RF, and DT analyses. To build the clinical prediction model, 10 ML algorithms (LR, DT, RF, XGBoost, SVM, GBM, KNN, ANN, ET) were first evaluated for predicting myelosuppression, and model performance was assessed using seven metrics (AUC, accuracy, sensitivity, specificity, F1 score, PPV, and NPV). DCA was further employed to gauge the clinical decision utility, ultimately identifying XGBoost as the optional ML (AUC = 0.97, sensitivity = 0.79, specificity = 0.92, accuracy = 0.88). Next, a traditional nomogram (clinic nomogram) was constructed. On this foundation, the FMA algorithm was used to create the clinic-ML nomogram. A comparative analysis of the clinic-nomogram, clinic-ML nomogram, and an XGBoost model built directly from clinical features showed that the clinic-ML nomogram outperformed both the traditional nomogram and the XGBoost model in predictive power and net clinical benefit. It also proved to be more distinctly stratifying and easier to implement, thus indicating superior clinical utility.
Age constitutes a critical determinant of post-chemotherapy bone marrow suppression, with older patients being more susceptible to such suppression than their younger or middle-aged counterparts. Alterations within the bone marrow microenvironment and intrinsic characteristics of hematopoietic stem cells may underlie this vulnerability. As individuals age, the proliferation and differentiation capacities of stromal cells diminish, alongside changes in the cytokine and growth factor milieu they secrete, thereby weakening the self-renewal and differentiation potential of hematopoietic stem cells[35]. Additionally, the quantity and quality of hematopoietic stem cells in elderly populations decline, making these cells more prone to genomic instability and epigenetic abnormalities[36]. Consequently, when chemotherapeutic agents inflict damage on hematopoietic stem cells, older patients often exhibit reduced capacity for effective self-repair and compensation compared to younger individuals. Moreover, previous studies have indicated that fundamental pathways, including nucleotide excision repair, homologous recombination, and non-homologous end-joining, may be adversely affected by aging[37], implying a decline in DNA repair competence among the elderly. Weakened DNA repair mechanisms render hematopoietic progenitor cells in the bone marrow more susceptible to apoptosis, senescence, or the development of dysfunctional clones following chemotherapeutic insult, thereby exacerbating the severity of bone marrow suppression. Additionally, the age-related deterioration in drug metabolic capacity[38] leads to diminished clearance of chemotherapeutic agents and their metabolites, resulting in higher tissue accumulation and increased toxicity.
This predictive model indicates that BSA is positively associated with the incidence of post-chemotherapy myelosuppression. We propose that the primary cause of this phenomenon is the increased absolute dose of chemotherapy drugs in patients with higher BSA. Clinically, chemotherapy regimens are often dosed in mg/m2, signifying the amount of drug administered per square meter of BSA. As BSA increases, so does the absolute amount of administered chemotherapy. Consequently, hematopoietic cells in the bone marrow are subjected to a higher overall “chemotherapeutic impact”, increasing the likelihood of significant myelosuppression. Although in theory BSA can partly reflect metabolic capacity and volume of distribution, patients with a higher BSA typically have larger organ volumes and greater blood flow, factors closely linked to enhanced hepatic metabolism and renal excretion[39]. However, such “tolerance” is not absolute and may not uniformly apply across all drugs or patients. If individuals with a larger BSA do not exhibit proportionately greater metabolic capability, they may experience a higher peak concentration (C max) and/or prolonged drug exposure (AUC), ultimately predisposing them to more severe myelosuppression. A similar phenomenon emerged in our study concerning BMI: Patients with a higher BMI were also more prone to myelosuppression. Although BMI and BSA do not exhibit an absolute linear relationship, most individuals with an elevated BMI also present with a larger BSA, which often leads to administration of higher chemotherapy doses. Previous research has demonstrated that high BMI is typically associated with slower drug clearance, thereby extending the elimination half-life[40]. Additionally, a high BMI often correlates with increased bone marrow fat content, potentially affecting hematopoietic function in the marrow[41]. Contradictorily, numerous studies have shown no significant correlation between high BMI and myelosuppression[42,43], and some evidence even indicates a negative association between BMI and myelosuppression[44]. These inconsistencies may reflect variation in chemotherapy dosing strategies and other confounding factors. Further investigation is warranted to elucidate the precise mechanisms underlying these observations.
Previous studies have rarely explored the association between tumor location in CRC and CIM. Our findings suggest that malignancies in the rectum and sigmoid colon are more prone to developing myelosuppression following chemotherapy. This phenomenon may be closely related to differences in treatment strategies. Because rectal cancer often requires concurrent chemoradiotherapy, pelvic bone marrow dose-volume parameters (e.g., V20 and V25) during radiotherapy significantly influence the incidence of myelosuppression. Indeed, rectal cancer treatment typically involves high-dose irradiation to the pelvic region, which can further compromise bone marrow function. In contrast, ascending, transverse, and descending colon cancers often do not necessitate radiotherapy and primarily depend on chemotherapy, implying that myelosuppression in these tumor locations is chiefly attributable to the inherent toxicity of chemotherapeutic agents. Additionally, variations in the tumor microenvironment and the release of inflammatory factors may exist among different segments of the colon and rectum. Changes in the local immune microenvironment and gut microbiota at the mucosal interface can affect chemotherapy tolerance and systemic immunity[45]. We hypothesize that if inflammation triggered by a tumor in a specific anatomical region, or inflammation in adjacent tissues, leads to dysbiosis in the gut microbiota, it may, in turn, impair hematopoiesis or immune regulation, thereby exacerbating the risk of myelosuppression. We intend to investigate this hypothesis in future research.
Elevated CEA, CA19-9, and CA125 Levels coupled with decreased ALB levels are strongly associated with an increased risk of myelosuppression in CRC patients after first-line chemotherapy. We hypothesize that this phenomenon may be linked to a higher overall tumor burden. Elevated CEA typically correlates with greater disease severity in CRC, whereas rises in CA19-9 and CA125 may indicate metastatic lesions. Meanwhile, high tumor burden markedly accelerates ALB consumption. As a result, patients experience a decline in overall health status and immune function, leading to diminished tolerance of chemotherapeutic agents and, consequently, an increased likelihood of myelosuppression[46,47].
Interestingly, in this study, the FOLFIRI regimen widely recognized in theory and previous literature as likely to elicit substantial myelosuppression exhibited a comparatively low incidence of bone marrow suppression. After an in-depth analysis of these findings in conjunction with clinical practice and the design characteristics of our study, we propose that this result is primarily attributable to prophylactic administration of granulocyte colony-stimulating factor (G-CSF) or similar agents. Numerous studies have indicated that the dose-limiting toxicity of irinotecan commonly manifests as marked neutropenia[48-50]. Consequently, to reduce the incidence of severe neutropenia and related infections, prophylactic G-CSF support is often implemented before FOLFIRI therapy. As such, our data revealed a significantly higher proportion of prophylactic G-CSF use in the FOLFIRI group than in the other two regimens, which may have artificially reduced the observed rate of myelosuppression among FOLFIRI-treated patients. Additionally, the sample size of the FOLFIRI group was considerably smaller than that of the CapeOx and FOLFOX groups, accounting for less than 10% of the total sample. This relatively limited patient pool may contribute to random variability or bias in estimating the rate of myelosuppression. Although this finding diverges somewhat from previous research, it highlights the influence and importance of authentic clinical practices observed in real-world settings. Real-world data encompasses not only patients’ baseline characteristics and objective efficacy and safety indicators, but also clinicians’ individualized treatment decisions, patient adherence, and the application of supportive care measures. These multifaceted factors can yield different outcomes, underscoring the high ecological validity and practical significance of real-world evidence in guiding clinical decisions.
Furthermore, as the number of chemotherapy cycles increases, so does the incidence of myelosuppression. The primary causes of worsening bone marrow suppression stem from cumulative damage to the bone marrow and repeated cycles of “injury-and-repair”. With more chemotherapy cycles, normal hematopoietic stem/progenitor cells endure multiple rounds of DNA damage and disrupted cell cycling[51]. On the one hand, repeated DNA damage can exceed the intrinsic repair capacity of the cells, thereby diminishing stem cell function[52]. On the other hand, the bone marrow microenvironment suffers continuous harm during successive chemotherapy sessions, preventing hematopoietic stem cells from receiving the necessary support for normal functioning[53,54]. Additionally, depletion of the stem cell pool can lead to insufficient hematopoiesis. With each chemotherapy cycle, the bone marrow undergoes a suppression phase followed by a recovery phase, requiring substantial mobilization and proliferation of stem/progenitor cells to restore blood cell counts[55]. However, because stem cells have limited capacity for repair and proliferation, repeated “over-mobilization” eventually impairs their function and depletes the stem cell pool. Over time, it becomes increasingly difficult for blood counts to return to baseline levels, thus worsening subsequent chemotherapy-induced cytopenias[56]. Finally, deterioration of overall health status also contributes to the onset of myelosuppression. Multiple chemotherapy cycles frequently result in various toxicities, including hepatic and renal dysfunction, leading to drug accumulation and further bone marrow suppression. Moreover, malnutrition[57] and infections[58] can impair bone marrow recovery via various mechanisms, perpetuating a vicious cycle.
CONCLUSION
In a retrospective cohort of 855 patients with CRC receiving first-line chemotherapy, we developed and internally validated an interpretable clinic-ML nomogram using a feature-mapping aggregation of multiple ML models and clinical predictors; the tool showed high discrimination (AUC = 0.95), good calibration, and a consistent net clinical benefit across a broad range of decision thresholds. These findings align with the established role of nomograms as individualized decision aids in oncology and underscore the value of DCA for evaluating clinical utility beyond accuracy metrics. In practice, risk estimates from the nomogram could help tailor prophylactic and dose-modification strategies.
Wang F, Chen G, Zhang Z, Yuan Y, Wang Y, Gao YH, Sheng W, Wang Z, Li X, Yuan X, Cai S, Ren L, Liu Y, Xu J, Zhang Y, Liang H, Wang X, Zhou A, Ying J, Li G, Cai M, Ji G, Li T, Wang J, Hu H, Nan K, Wang L, Zhang S, Li J, Xu RH. The Chinese Society of Clinical Oncology (CSCO): Clinical guidelines for the diagnosis and treatment of colorectal cancer, 2024 update.Cancer Commun (Lond). 2025;45:332-379.
[RCA] [PubMed] [DOI] [Full Text] [Full Text (PDF)][Cited by in Crossref: 47][Cited by in RCA: 50][Article Influence: 50.0][Reference Citation Analysis (0)]
Zhou M, Yang S, Chen RX, Yang XF, Zhao J, Xie WX, Liao Y, Liu D. [Clinical efficacy observation of heat-sensitive moxibustion combined with intrapleural perfusion of cisplatin in treatment of malignant pleural effusion].Zhen Ci Yan Jiu. 2024;49:1190-1197.
[RCA] [PubMed] [DOI] [Full Text][Cited by in RCA: 1][Reference Citation Analysis (0)]
Ducreux M, Bennouna J, Hebbar M, Ychou M, Lledo G, Conroy T, Adenis A, Faroux R, Rebischung C, Bergougnoux L, Kockler L, Douillard JY; GI Group of the French Anti-Cancer Centers. Capecitabine plus oxaliplatin (XELOX) versus 5-fluorouracil/leucovorin plus oxaliplatin (FOLFOX-6) as first-line treatment for metastatic colorectal cancer.Int J Cancer. 2011;128:682-690.
[RCA] [PubMed] [DOI] [Full Text][Cited by in Crossref: 109][Cited by in RCA: 120][Article Influence: 8.0][Reference Citation Analysis (2)]
Li H, Côté P, Kuoch M, Ezike J, Frenis K, Afanassiev A, Greenstreet L, Tanaka-Yano M, Tarantino G, Zhang S, Whangbo J, Butty VL, Moiso E, Falchetti M, Lu K, Connelly GG, Morris V, Wang D, Chen AF, Bianchi G, Daley GQ, Garg S, Liu D, Chou ST, Regev A, Lummertz da Rocha E, Schiebinger G, Rowe RG. The dynamics of hematopoiesis over the human lifespan.Nat Methods. 2025;22:422-434.
[RCA] [PubMed] [DOI] [Full Text] [Full Text (PDF)][Cited by in Crossref: 30][Cited by in RCA: 26][Article Influence: 26.0][Reference Citation Analysis (0)]
Iida N, Dzutsev A, Stewart CA, Smith L, Bouladoux N, Weingarten RA, Molina DA, Salcedo R, Back T, Cramer S, Dai RM, Kiu H, Cardone M, Naik S, Patri AK, Wang E, Marincola FM, Frank KM, Belkaid Y, Trinchieri G, Goldszmid RS. Commensal bacteria control cancer response to therapy by modulating the tumor microenvironment.Science. 2013;342:967-970.
[RCA] [PubMed] [DOI] [Full Text] [Full Text (PDF)][Cited by in Crossref: 1942][Cited by in RCA: 1772][Article Influence: 136.3][Reference Citation Analysis (11)]
Pettengell R, Bosly A, Szucs TD, Jackisch C, Leonard R, Paridaens R, Constenla M, Schwenkglenks M; Impact of Neutropenia in Chemotherapy-European Study Group (INC-EU). Multivariate analysis of febrile neutropenia occurrence in patients with non-Hodgkin lymphoma: data from the INC-EU Prospective Observational European Neutropenia Study.Br J Haematol. 2009;144:677-685.
[RCA] [PubMed] [DOI] [Full Text] [Full Text (PDF)][Cited by in Crossref: 82][Cited by in RCA: 73][Article Influence: 4.3][Reference Citation Analysis (0)]
Saltz L, Badarinath S, Dakhil S, Bienvenu B, Harker WG, Birchfield G, Tokaz LK, Barrera D, Conkling PR, O'Rourke MA, Richards DA, Reidy D, Solit D, Vakiani E, Capanu M, Scales A, Zhan F, Boehm KA, Asmar L, Cohn A. Phase III trial of cetuximab, bevacizumab, and 5-fluorouracil/leucovorin vs. FOLFOX-bevacizumab in colorectal cancer.Clin Colorectal Cancer. 2012;11:101-111.
[RCA] [PubMed] [DOI] [Full Text][Cited by in Crossref: 51][Cited by in RCA: 52][Article Influence: 3.7][Reference Citation Analysis (0)]
Bellio H, Roussot N, Bertaut A, Hervieu A, Zanetta S, Tharin Z, Vincent J, Bengrine L, Hennequin A, Guion JF, Boudrant A, Collot T, Ghiringhelli F, Fumet JD. FOLFIRINOX-3 plus bevacizumab (bFOLFIRINOX3) in chemo-refractory metastatic colorectal cancer: a multicenter phase II trial.Future Oncol. 2025;21:699-706.
[RCA] [PubMed] [DOI] [Full Text][Cited by in Crossref: 1][Cited by in RCA: 2][Article Influence: 2.0][Reference Citation Analysis (1)]
Li B, Yang W, Liu N, Bi D, Yang T, Wu G, Sun Y. Phase II Study of Irinotecan, Trifluridine/tipiracil (TAS-102) plus Bevacizumab as a Later-line Therapy for Patients with Metastatic Colorectal Cancer (mCRC): a prospective single-center explorative study.Br J Cancer. 2024;131:1775-1780.
[RCA] [PubMed] [DOI] [Full Text][Cited by in RCA: 6][Reference Citation Analysis (1)]
Boyd AL, Aslostovar L, Reid J, Ye W, Tanasijevic B, Porras DP, Shapovalova Z, Almakadi M, Foley R, Leber B, Xenocostas A, Bhatia M. Identification of Chemotherapy-Induced Leukemic-Regenerating Cells Reveals a Transient Vulnerability of Human AML Recurrence.Cancer Cell. 2018;34:483-498.e5.
[RCA] [PubMed] [DOI] [Full Text][Cited by in Crossref: 156][Cited by in RCA: 132][Article Influence: 16.5][Reference Citation Analysis (0)]
Sukhina A, Queriault C, Roy S, Hall E, Rome K, Aggarwal M, Nunn E, Weiss A, Nguyen J, Bennett FC, Bailis W.
Malnutrition drives infection susceptibility and dysregulated myelopoiesis that persists after refeeding intervention. 2025 Preprint.
[RCA] [PubMed] [DOI] [Full Text] [Full Text (PDF)][Cited by in RCA: 1][Reference Citation Analysis (0)]
Provenance and peer review: Unsolicited article; Externally peer reviewed.
Peer-review model: Single blind
Specialty type: Gastroenterology and hepatology
Country of origin: China
Peer-review report’s classification
Scientific Quality: Grade A, Grade B, Grade B
Novelty: Grade A, Grade B, Grade C
Creativity or Innovation: Grade A, Grade B, Grade B
Scientific Significance: Grade A, Grade B, Grade C
Open Access: This article is an open-access article that was selected by an in-house editor and fully peer-reviewed by external reviewers. It is distributed in accordance with the Creative Commons Attribution NonCommercial (CC BY-NC 4.0) license, which permits others to distribute, remix, adapt, build upon this work non-commercially, and license their derivative works on different terms, provided the original work is properly cited and the use is non-commercial. See: https://creativecommons.org/Licenses/by-nc/4.0/
P-Reviewer: Khajavian MN, PhD, Postdoctoral Fellow, Malaysia; Navarro EG, Additional Professor, Mexico; Wen HM, PhD, Post Doctoral Researcher, United States S-Editor: Fan M L-Editor: A P-Editor: Yu HG