


Published online Nov 7, 2025. doi: 10.3748/wjg.v31.i41.111184
Revised: August 3, 2025
Accepted: September 28, 2025
Published online: November 7, 2025
Processing time: 134 Days and 4 Hours
Upper gastrointestinal (UGI) diseases present diagnostic challenges during endo
To evaluate 17 state-of-the-art DL models for multi-class UGI disease segmentation, emphasizing clinical tran
This study evaluated 17 DL models spanning convolutional neural network (CNN)-, transformer-, and mamba-based architectures using a self-collected dataset from two hospitals in Macao and Xiangyang (3313 images, 9 classes) and the public EDD2020 dataset (386 images, 5 classes). Models were assessed for segmentation per
Swin-UMamba achieved the highest segmentation performance across both datasets [intersection over union (IoU): 89.06% ± 0.20% self-collected, 77.53% ± 0.32% EDD2020], followed by SegFormer (IoU: 88.94% ± 0.38% self-collected, 77.20% ± 0.98% EDD2020) and ConvNeXt + UPerNet (IoU: 88.48% ± 0.09% self-collected, 76.90% ± 0.61% EDD2020). Statistical analyses showed no significant differences between paradigms, though hierarchical archi
Hierarchical architectures like Swin-UMamba and SegFormer show promise for UGI disease segmentation, redu
Core Tip: This study evaluates 17 advanced deep learning models, including convolutional neural network-, transformer-, and mamba-based architectures, for multi-class upper gastrointestinal disease segmentation. Swin-UMamba achieves the highest segmentation accuracy, while SegFormer balances efficiency and performance. Automated segmentation demonstrates significant clinical value by improving diagnostic precision, reducing missed diagnoses, streamlining treatment planning, and easing physician workload. Key challenges include lighting variability, vague lesion boundaries, multi-label complexities, and dataset limitations. Future directions, such as multi-modal learning, self-supervised techniques, spatio-temporal modeling, and rigorous clinical validation, are essential to enhance model robustness and ensure applicability in diverse healthcare settings for better patient outcomes.
- Citation: Chan IN, Wong PK, Yan T, Hu YY, Chan CI, Qin YY, Wong CH, Chan IW, Lam IH, Wong SH, Li Z, Gao S, Yu HH, Yao L, Zhao BL, Hu Y. Assessing deep learning models for multi-class upper endoscopic disease segmentation: A comprehensive comparative study. World J Gastroenterol 2025; 31(41): 111184
- URL: https://www.wjgnet.com/1007-9327/full/v31/i41/111184.htm
- DOI: https://dx.doi.org/10.3748/wjg.v31.i41.111184
Upper gastrointestinal (UGI) diseases significantly impact global health in various ways[1,2]. From 1990 to 2019, nearly 350 million new cases and over 4.5 million deaths from UGI diseases were reported, with UGI cancers comprising over 80% of these deaths[3]. Despite being less fatal than UGI cancers, the high incidence of other UGI diseases results in considerable healthcare costs and productivity losses, thereby placing a significant economic strain worldwide[4-8]. In addition, some UGI diseases also act as precursors during the precancerous stages of certain UGI cancer development and can variably affect cancer risk[9-13]. Therefore, early detection and treatment of UGI diseases are crucial strategies for mitigating their global impact.
Upper endoscopy is widely recognized as the gold standard for diagnosing UGI diseases, with conventional white light endoscopy favored for its affordability and clinical significance[14]. Advances such as narrow-band imaging have improved mucosal and vascular visualization, offering greater diagnostic precision[15]. Nevertheless, manual evaluation of endoscopic images remains susceptible to observer variability, misdiagnosis, and missed lesions, often resulting from indistinct boundaries, disease similarities, and distracting artifacts like blood and bubbles[16-19]. These challenges necessitate the development of automated diagnostic systems to enhance accuracy and reduce human error in clinical practice.
Deep learning (DL) models, including convolutional neural networks (CNNs) and transformers, have demonstrated significant potential in medical image analysis by automating the extraction of local and global features, thereby enhancing diagnostic precision[20]. Within the domain of DL-based endoscopic image analysis, disease segmentation has become a critical task, enabling accurate diagnosis, effective treatment planning, and comprehensive disease monitoring. Nevertheless, multi-class UGI disease segmentation remains a relatively unexplored area due to two major challenges: (1) Limited availability of annotated datasets: Multi-class UGI disease segmentation has remained largely unexplored due to the limited availability of public segmentation datasets, which typically provide labels for only a few disease classes. The EDD2020 dataset, the only publicly available resource for this task following an extensive literature search, contains just 386 images across five disease classes. This restricted dataset size significantly constrains the training of data-intensive DL architectures, hindering the development of robust segmentation systems capable of addressing diverse disease patterns in clinical practice. Consequently, most studies have focused on polyp segmentation or cancer and abnormality segmentation, supported by available datasets; and (2) Lack of comparative studies on diverse model architectures: At the time of the endoscopy computer vision challenge (EndoCV2020), simpler CNN-based architectures dominated the field[21], as the use of transformers in computer vision had only begun to gain traction following the introduction of the vision transformer (ViT) in the same year[22]. Since then, significant architectural innovations such as transformers and mamba-based models have emerged but remain largely unexplored for UGI disease segmentation. Although CNNs, transformers, and mamba-based models provide unique benefits in local feature extraction, global context modeling, and efficient sequence processing, comparative analysis of these architectures in this domain remains limited. Evaluating these paradigms within a unified framework is essential to identify the most effective approach for addressing the unique challenges of multi-class UGI disease segmentation.
To address critical challenges in applying UGI disease segmentation to clinical practice, this study undertakes a large-scale comparative analysis of 17 state-of-the-art DL models, including CNN-based, transformer-based, and mamba-based architectures. Recognizing the limitations of small public datasets with few disease classes, this study introduces a self-collected dataset of 3313 endoscopic images from two hospitals, covering nine classes and offering 8.5 times more images and nearly double the class diversity of the public EDD2020 dataset. By leveraging both the self-collected dataset and the smaller public EDD2020 dataset, this study provides a robust and clinically relevant evaluation of segmentation performance across diverse imaging conditions and disease manifestations. The dual-dataset strategy ensures that findings are applicable to real-world diagnostic workflows, addressing the limitations of previous studies reliant on less diverse datasets. Through comprehensive analysis, the study identifies key architectural insights and challenges, offering critical guidance for advancing UGI disease segmentation and enhancing diagnostic accuracy in clinical practice. The contributions of this study are as follows: (1) Clinical relevance: The study systematically evaluates DL models to support endoscopists in reducing missed diagnoses, enhancing diagnostic efficiency, and alleviating workload. By improving the accuracy and efficiency of UGI disease detection, the findings contribute to better patient outcomes and streamlined clinical workflows; (2) Comprehensive architectural evaluation: It is the first systematic comparative analysis of 17 state-of-the-art DL models spanning CNN-based, transformer-based, and mamba-based architectures for multi-class UGI disease segmentation. By identifying design principles that effectively address domain-specific challenges, it offers insights directly applicable to improving diagnostic accuracy and segmentation reliability in clinical practice; (3) Multi-dataset validation framework: This study involves rigorous evaluations across both a comprehensive self-collected dataset and the public EDD2020 dataset, demonstrating model performance across different clinical environments and imaging conditions. This approach highlights the generalization and suitability of the DL models for real-world diagnostic applications; and (4) Clinical implementation framework: This study involves the development of a comprehensive evaluation framework that assesses the performance-efficiency trade-off (PET) and generalization of models, which can provide well-rounded analyses of model viability across computational constraints and diverse imaging conditions to guide practical clinical implementation decisions.
For endoscopic image analysis, multi-class disease segmentation is often achieved by semantic segmentation of the disease regions within the image. The 2020 EndoCV challenge represents the only identified comprehensive study addressing multi-class disease segmentation in endoscopic imaging, where it released a dataset for 5-class disease segmentation that prompted various research teams to develop specialized models. According to the survey by Ali et al[21], these models primarily utilized different pre-trained CNNs for feature extraction coupled with various decoder architectures such as U-Net, U-Net +, and DeepLabV3 +. Some researchers enhanced their approaches with additional techniques, including data augmentation and optimal class thresholding. However, most of these algorithms and methods were relatively outdated compared to current DL approaches. A more significant limitation is that the EndoCV challenge dataset contains annotations for only a few UGI diseases, while most other public endoscopic datasets like Kvasir[23] are primarily designed for classification tasks rather than segmentation.
This gap in multi-class disease segmentation research is particularly notable because, in recent years, the field has predominantly focused on single-class-specific disease segmentation or general UGI tract abnormality segmentation. Disease segmentation research has disproportionately concentrated on polyp segmentation, and this is largely due to the availability of open-access polyp segmentation datasets such as Kvasir-Seg[24] and colorectal cancer-clinic dataset[25]. Polyp segmentation research has seen numerous contributions, representing just a portion of the extensive work in this field. Sanderson and Matuszewski[26], who introduced Fully Convolutional Branch TransFormer (FCBFormer) for polyp segmentation, and Fan et al[27] proposed parallel reverse attention network for polyp segmentation (PraNet), which was a parallel reverse attention network for the same task. Manan et al[28] proposed multi-scale and multi-path cascaded convolutional network, which employed multi-scale and multi-path cascaded convolutions with dual attention modules and skip connections, for colorectal polyp segmentation. Beyond polyps, some researchers have investigated other specific conditions. Wang et al[29] developed a multi-scale context-guided network with visual geometry group 16-layer network as the base model, and they assessed the model with UGI abnormality segmentation and polyp segmentation with two public datasets, namely EndoVis-Ab[30] and colorectal cancer-clinic dataset, respectively. On the other hand, Fang et al[31] employed ResNet152V2 and U-Net to build their model for esophageal cancer segmentation. These approaches fundamentally differ from multi-class disease segmentation, which requires simultaneous identification and delineation of multiple disease categories within the same framework. While these single-disease segmentation models could potentially be fine-tuned for multi-class tasks, they were not originally designed for this purpose and do not address the complex clinical requirements of simultaneously detecting and segmenting multiple disease classes. This limitation, combined with the insufficient disease coverage in existing datasets, makes current approaches inadequate for the comprehensive multi-class disease segmentation needed in real-world clinical settings.
The comparative study employs two distinct datasets: A self-collected dataset and the publicly available EDD2020 dataset. The utilization of both datasets is necessitated by the limited availability of public multi-class disease segmentation datasets. Despite extensive literature review, the EDD2020 dataset represents the only publicly accessible resource that meets the specific requirements for multi-class UGI disease segmentation evaluation. While larger public image repositories exist, these are predominantly oriented toward classification rather than segmentation tasks. Repurposing such datasets would necessitate extensive additional annotations, effectively removing them from consideration as truly public resources for segmentation research. This dual-dataset approach strengthens the robustness of this comparative analysis and helps mitigate potential biases that may arise from evaluating models on a single data source.
Self-collected dataset: This dataset comprises 3313 endoscopic images collected between 2019 and 2024 from Kiang Wu Hospital, Macao, and Xiangyang Central Hospital (Xiangyang, Hubei Province, China) (see Table 1 for details). The images, captured using white light endoscopy and narrow band imaging, reflect diverse lighting conditions typical of clinical practice, including the common brighter center with darker edges, specular reflections, shadows, and equipment-based variations (Figure 1). The dataset includes normal images and eight UGI disease classes, with disease identification and annotations verified by gastroenterologists (refer to Table 1 for disease classes and the annotation process). The diseases include esophageal neoplasm (EN), esophageal varices (EV), gastroesophageal reflux disease (GERD), gastric neoplasm (GN), gastric ulcer (GU), gastric polyp (GP), gastric varices (GV), and duodenal ulcer (DU), and representative images are displayed in Figure 2, while the number of images in each class and their distribution are shown in Figure 3, respectively. This study was approved by the Medical Ethics Committee of Xiangyang Central Hospital (No. 2024-145) and the Medical Ethics Committee of Kiang Wu Hospital, Macao (No. 2019-005), and conducted in accordance with the principles of the Declaration of Helsinki. Since it is a retrospective study, the institutional review board waives the written informed consent. Preprocessing steps for this dataset involve cropping black borders to remove metadata for ensuring patient anonymity and splitting the dataset into training-and-validation (80%) and test (20%) sets, with further division into training (80%) and validation (20%) subsets (see Table 1 for preprocessing details)[32].


| Aspect | Details |
| Source hospitals | Kiang Wu Hospital, Macao; Xiangyang Central Hospital, Xiangyang, Hubei Province, China |
| Data collection period | 2019-2024 |
| Total images | 3313 endoscopic images |
| Imaging modality | White light endoscopy (majority); narrow band imaging (subset) |
| Imaging equipment | Olympus EVIS X1 CV-1500 with GIF EZ1500 gastroscopes (Kiang Wu Hospital); Olympus CF-HQ290-I and PENTAX EG29-i10 gastroscopes (Xiangyang Central Hospital) |
| Disease classes | Normal: 1014 images; esophageal neoplasm: 256 images; esophageal varices: 228 images; GERD: 143 images; gastric neoplasm: 486 images; gastric polyp: 526 images; gastric ulcer: 366 images; gastric varices: 83 images; duodenal ulcer: 211 images |
| Data acquisition | Images were retrieved from the two hospital databases: (1) Normal images were selected based on chronic superficial gastritis cases exhibiting visually normal appearance on white light endoscopy and no significant pathological findings; and (2) Disease images were identified using international classification of diseases codes under the supervision of gastroenterologists and biomedical engineering postgraduate students |
| Annotation process | Disease labels were verified by gastroenterologists; Mask annotations were created using Anylabeling by a PhD student and a post-doctoral researcher in biomedical engineering under the supervision of a gastroenterologist; annotations were exported as JSON and converted to binary PNG masks; Masks were independently reviewed by an experienced gastroenterologist |
| Ethical approval identifiers | Medical Ethics Committee of Xiangyang Central Hospital (No. 2024-145); and Medical Ethics Committee of Kiang Wu Hospital, Macao (No. 2019-005) |
| Compliance | Conducted in accordance with the Declaration of Helsinki |
| Pre-processing pipeline | Black borders and text metadata are removed; Images are cropped to resolutions ranging from 268 × 217 pixels to 1545 × 1156 pixels; images are divided into training-and-validation (80%) and test (20%) sets, and further split training-and-validation into training (80%) and validation (20%); multi-class segmentation masks are generated with nine channels: All pixels in normal images are assigned to the “normal” channel. While in disease images, non-lesion/background areas are assigned to the “normal” channel and lesion areas to their respective disease channels |
EDD2020 dataset: This dataset was originally used for the sub-challenge of EndoCV2020 of disease detection and segmentation, and it has been publicly released after the challenge ended[21,33] comprises 386 endoscopic images collected from Ambroise Paré Hospital (France), Centro Riferimento Oncologico IRCCS (Italy), Istituto Oncologico Veneto (Italy), and John Radcliffe Hospital (United Kingdom) through a multi-institutional collaboration (see Table 2 for details)[34]. The dataset includes bounding boxes and 502 segmentation masks across five clinically significant disease classes: Barrett’s esophagus (BE), suspicious precancerous lesions (Sus), high-grade dysplasia (HGD), cancer, and polyps, and example images are displayed in Figure 4. All data were anonymized and pre-cropped prior to public release to protect patient privacy, and images were acquired with appropriate patient consent. Preprocessing steps involve stratified sampling to split the dataset into training (81%), validation (9%), and test (10%) sets while preserving proportional representation of disease classes. Multi-label cases use the first annotated disease as the stratification key, and disease classes with fewer than two samples are consolidated into an “other” category. This ensures statistical validity and addresses data imbalance issues. The final split includes 312 images (405 masks) for training, 35 images (47 masks) for validation, and 39 images (50 masks) for testing (see Table 3 for data distribution details). A specialized mask generation function is employed to create multi-class segmentation masks with six channels: Five for disease classes and one for background/normal tissue. This mask format is designed to match the structure of masks in the self-collected dataset, ensuring consistency in labeling and facilitating the ability of the model to distinguish normal anatomy from disease areas, thereby improving segmentation performance. Visualization of the masks is shown in Figure 5.


| Aspect | Details |
| Source hospitals | Ambroise Paré Hospital, France; Centro Riferimento Oncologico IRCCS, Italy; Istituto Oncologico Veneto, Italy; John Radcliffe Hospital, United Kingdom |
| Total images | 386 still images with 502 segmentation masks |
| Disease classes | Barrett’s esophagus: 160 masks; suspicious precancerous lesions: 88 masks; high-grade dysplasia: 74 masks; cancer: 53 masks; polyps: 127 masks |
| Annotation process | Performed by two clinical experts and two post-doctoral researchers using the open-source VGG image annotator annotation tool |
| Pre-processing pipeline | Stratified split into training (81%), validation (9%), and test (10%) using scikit-learn[34]; specialized multi-class segmentation mask generation with six channels (five disease classes + background): Non-lesion/background areas in disease images are assigned to the “normal” channel, while lesions are assigned to their respective disease channels |
| Disease class | Training | Validation | Test | Total |
| BE | 130 | 14 | 16 | 160 |
| HGD | 61 | 6 | 7 | 74 |
| Cancer | 43 | 5 | 5 | 53 |
| Polyp | 103 | 11 | 13 | 127 |
| Suspicious | 68 | 11 | 9 | 99 |
| Total | 405 | 47 | 50 | 502 |
The pipeline for data augmentation of the two datasets is identical. All images of the two datasets are resized to 224 × 224 pixels using bicubic interpolation to standardize input dimensions. To improve model generalization, dynamic data augmentation is applied during the training process. Each training image undergoes random transformations during each epoch, creating diverse variations without increasing the actual number of training samples. The augmentation pipeline begins with initial rotations of 0°, 90°, 180°, or 270°, followed by either horizontal or vertical flipping with 50% probability. Finally, with an additional 50% probability, a random rotation between 0° and 360° is applied. Through this approach, the model encounters different variations of the same original images across training epochs, effectively exposing it to multiple orientations and perspectives of the same underlying data. These augmentations allow the model to learn features that are invariant to orientation by exposing it to structures in a wide range of spatial configurations. This is significant for UGI segmentation because anatomical structures can vary in orientation due to patient positioning and endoscope movement. In addition, boundaries are often blurred by overlapping tissues, and lighting inconsistencies may further obscure important details. The augmentations enhance the ability of the model to detect subtle patterns, such as lesions or boundaries, and adapt to different lighting conditions, thus making it more robust to variability in real-world imaging.
This comparative study systematically evaluates the performance characteristics of diverse DL architectures for UGI disease segmentation. By analyzing the strengths and limitations of existing approaches across different architectural paradigms, the study aims to identify optimal design principles and pinpoint performance bottlenecks. The insights gained from this analysis will directly inform the development of an enhanced architecture that integrates the most effective elements identified during the evaluation. To establish robust baselines for UGI disease segmentation, the study carefully selects subsets of well-known models based on seven key criteria: (1) Architectural representativeness: Models represent the three core paradigms (CNN-based, transformer-based, and mamba-based) with proven segmentation effectiveness; (2) Task alignment: As the dataset comprises two-dimensional (2D) endoscopic images, only models designed for 2D image segmentation are included; (3) Parameter size: While there is no restriction on the number of parameters for the models, encoder sizes in the range of 20 million-30 million parameters should be prioritized to facilitate fair comparisons and ensure good generalization; (4) Medical-specific design features: The selected models span three categories based on their design focus: General segmentation models that provide baseline capabilities for versatile image segmentation across diverse datasets, medical or biomedical models that incorporate domain-specific adaptations to address challenges in medical imaging like lesion localization, and UGI-specific models that are tailored for endoscopic applications and optimized for precise detection of UGI abnormalities; (5) Real-time inference support: The selected models have a range of computational profiles and subtle differences in efficiency and performance while maintaining similar encoder sizes (20 million-30 million parameters). While the exact tiers of computational efficiency may vary depending on specific measurements, the models generally fall into three broad categories: Efficiency-oriented designs optimized for fast inference, balanced designs that trade off efficiency and accuracy, and accuracy-focused designs that prioritize precision within reasonable computational limits; (6) Pre-training and initialization: Model with pre-trained ImageNet-1K[35] weights are prioritized to ensure standardized initialization, and transfer learning is used for enhancing model performance; and (7) Code availability and reliability: Models with publicly released and reliable implementations are prioritized to ensure reproducibility.
The selected models are categorized into three architectural paradigms: CNN-based, transformer-based, and mamba-based models. Our refined selection includes 5-6 representative models from each architectural category, with careful consideration to include 1-2 models from each application domain (general segmentation, biomedical or medical segmentation, and UGI-specific segmentation). This balanced representation ensures comprehensive coverage across both architectural approaches and application contexts while eliminating redundant model variants. The details of the 17 models selected for this comparative study are listed in Table 4[26,27,36-51]. The details of each model included in each architecture are outlined as follows.
| Model | Model name | Encoder size | Applications |
| CNN-based | U-Net[36] | NA | General segmentation, Biomedical segmentation |
| ResNet[37] + U-Net | ResNet501 | General segmentation, Biomedical segmentation | |
| ConvNeXt[38] + UPerNet[39] | ConvNeXt-T1 | General segmentation | |
| M2SNet[40] | Res2Net50-v1b-26w-4s1[41] | Medical segmentation | |
| Dilated SegNet[42] | ResNet501 | Polyp segmentation | |
| PraNet[27] | Res2Net50-v1b-26w-4s1 | Polyp segmentation | |
| Transformer-based | SwinV2[43] + UPerNet | SwinV2-T1 | General segmentation |
| SETR-MLA[44] | ViT-B-161[22] | General segmentation | |
| SegFormer[45] | MiT-B21 | General segmentation | |
| TransUNet[46] | ResNet501 and ViT-B-161 | Medical segmentation | |
| PVTV2[47] + EMCAD[48] | PVTV2-B21 | Medical segmentation | |
| FCBFormer[26] | PVTV2-B21 | Polyp segmentation | |
| Mamba-based | Swin-UMamba[49] | VSSM-encoder1 | Medical segmentation |
| Swin-UMamba-D[49] | VSSM-encoder1 | Medical segmentation | |
| U-Mamba-Bot[50] | NA | Biomedical segmentation | |
| U-Mamba-Enc[50] | NA | Biomedical segmentation | |
| VM-UNETV2[51] | VM-UNET-encoder1 | Medical segmentation |
CNN-based models: CNN has been the most commonly used network in the DL algorithms due to its superior performance in computer vision tasks. 6 CNN-based models for different tasks are selected for this comparative study. U-Net[36] is well-known for its contracting path and expansive paths as the encoder and decoder, and skip connections are used to preserve spatial information. Aside from its vanilla forms, ResNet[37], which is well-known for incorporating residual connections, is also included with U-Net. ConvNeXt[38] with UPerNet[39] is also included. ConvNeXt, which is a modern CNN, incorporates techniques inspired by ViT[22]. UPerNet is used alongside ConvNeXt for semantic segmentation in Ali et al[33], and it is constructed based on the feature pyramid network (FPN)[52] with the pyramid pooling module from PSPNet[53]. As a novel architecture for medical image segmentation, M2SNet[40] is a multi-scale subtraction network that uses subtraction units to extract different features across levels and scales to enhance feature complementarity and reduce redundancy[41]. These subtraction units can also capture both pixel-level and structure-level details to improve lesion localization and edge clarity. Dilated SegNet[42] is designed to perform real-time polyp segmentation, and it is an encoder-decoder architecture that takes ResNet50 as the backbone and includes dilated convolution pooling blocks after the feature maps at different levels before passing to the decoder blocks. PraNet[27] is also evaluated. PraNet consists of a parallel partial decoder to generate a global guidance map and a reverse attention module to refine boundary cues.
Transformer-based models: Transformer-based models use self-attention mechanisms to capture long-range dependencies and contextual relationships, and 6 models in this category are involved in this study. They are Swin transformer (Swin) V2[43] with UPerNet, segmentation transformer (SETR)[44], SegFormer[45], TransUNet[46], Pyramid ViT (PVT) V2[47] with efficient multi-scale convolutional decoding (EMCAD)[48], and FCBFormer[26]. SwinV2 is an improved version of SwinV1[54], which is known for its shifted window scheme and hierarchical structure that excels in vision tasks. SwinV2 addresses the issues of SwinV1, such as training instability, resolution gaps, and reliance on labeled data, by incorporating new techniques, and its segmentation form with UPerNet in Liu et al[43] is included. SETR is a SETR using pure ViT as the encoder, and the variant using the multi-level feature aggregation (MLA) decoder based on FPN is included. SegFormer is an efficient segmentation framework that uses a novel hierarchical transformer encoder and a lightweight all-multilayer perceptron (MLP) decoder to achieve accuracy, efficiency, and robustness. TransUNet is a medical image segmentation model that uses CNNs to encode the tokenized image patches for the transformer part and the U-Net decoder. EMCAD is an efficient decoder for medical image segmentation that optimizes both performance and computational efficiency with the aid of various modules, including efficient multi-scale convolutional attention modules and large-kernel-grouped attention gates, and pyramid vision transformer v2 (PVTV2) as the backbone in Wang et al[47] is included. PVTV2 is modified from PVTV1[55], which is a transformer backbone with a pyramid structure from CNNs, to reduce the computational complexity and improve model performance by adding new designs such as the linear complexity attention layer, overlapping patch embedding, and convolutional feed-forward network. FCBFormer is a novel architecture for full-size polyp segmentation that involves both FCB and the transformer-branch with PVTV2 and improved progressive locality decoder +, and the fusion of the branch outputs is used for final prediction.
Mamba-based models: Mamba is a new DL architecture that focuses on efficient sequence modeling with selective structured state space models (SSMs) for various tasks such as language, computer vision, audio, and genomics[56]. Its selective mechanism enables the model to handle long-range dependencies with linear scaling and prioritize important information. The mamba-based architecture represents a critical third model category alongside CNNs and transformers due to its rapidly growing prominence in computer vision, particularly for medical image analysis. The recent growth of studies applying mamba-based models to medical imaging tasks establishes this approach as a rising architectural paradigm that extends beyond traditional methodological frameworks[57,58]. Hence, the inclusion of this developing architectural family ensures the analysis encompasses the full spectrum of contemporary DL methodologies applicable to UGI disease segmentation. They are represented by 5 models in this study: Swin-UMamba[49], Swin-UMamba-D[49], U-Mamba-Bot[50], U-Mamba-Enc[50], and VM-UNETV2[51]. Swin-UMamba is a mamba-based U-Net architecture that contains visual state space (VSS) blocks with 2D-selective-scan within the encoder, followed by the Swin-UMamba decoder, which is a U-shaped architecture with dense skip connections. On the other hand, Swin-UMamba-D exhibits a nearly identical structure in the encoder architecture with Swin-UMamba, but it has a mamba-based decoder that replaces the CNN blocks with VSS blocks, which results in fewer parameters and lower computational costs. U-Mamba is another mamba-based U-Net architecture that has a unique building unit containing two successive residual blocks followed by a mamba block. U-Mamba-Bot and U-Mamba-Enc are two U-Mamba variants, in which the former employs the U-Mamba blocks in the bottleneck and the latter uses U-Mamba blocks for all encoder blocks. VMU-NETV2 is also a mamba-based U-shaped architecture that contains the encoder part with VSS blocks, the semantic and detail infusion (SDI) module for feature fusion, and the decoder part that receives features from the SDI module. For Swin-UMamba variants and VM-UNETV2, their encoders share similar structures with VMamba[59] for direct application of pre-trained weights of VMamba to their models.
The 17 segmentation models are trained on both datasets to perform a multi-class semantic segmentation of UGI diseases, and the dice focal loss from MONAI[60] is chosen as the loss function for training the model. The dice focal loss is the weighted sum of the dice loss and focal loss, and their equations are displayed as equations 1-3.
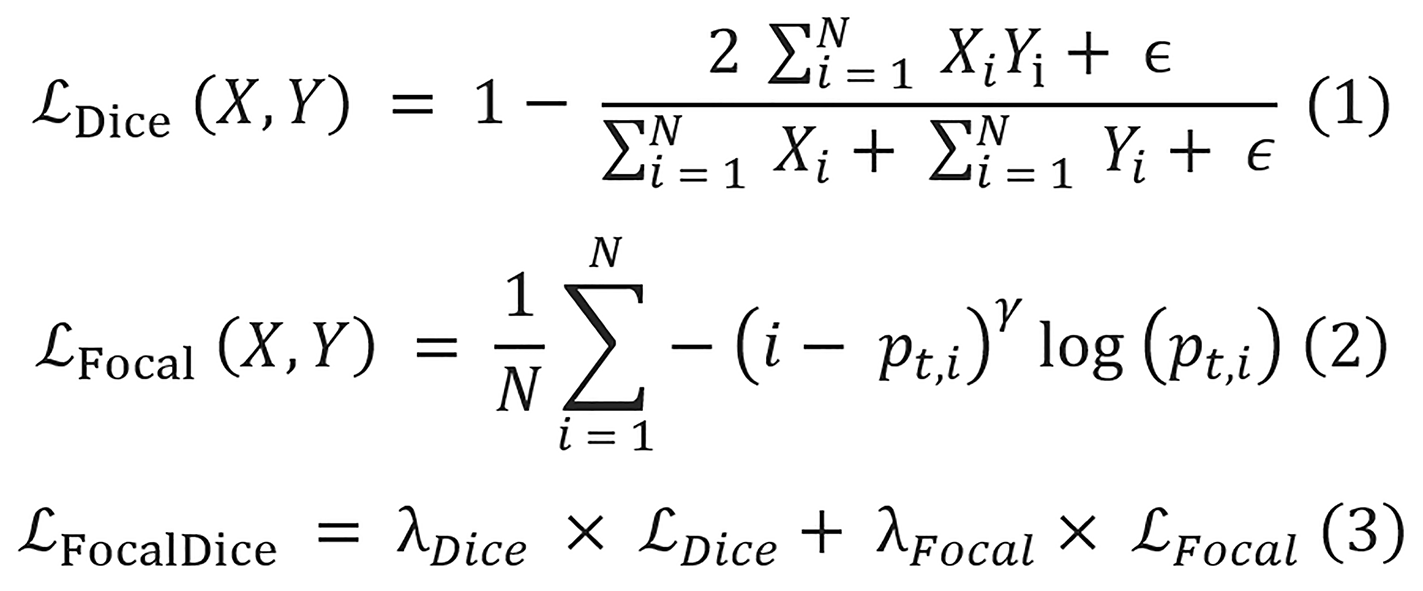
Where X is the predicted mask, Y is the ground truth label, N denotes the total number of pixels, and ϵ is a very small constant with a value of 1 × 10⁻⁵ added to avoid division by zero. pt,i is the predicted probability for the true class label of the pixel i, and the value for γ is 2. The values for both λDice and λFocal are equal to 1.
All experiments are conducted using PyTorch[61], and all the models are constructed using the Torchvision[62] and PyTorch image models[63] libraries. The models that utilize pre-trained encoders are pre-trained on the ImageNet-1K dataset. Training and validation are conducted across two hardware configurations: An intel i9-11900 central processing unit (CPU) with an NVIDIA RTX 3080 graphics processing unit (GPU) (10 GB video random access memory) for the baseline models on the self-collected dataset and the same CPU with an upgraded NVIDIA RTX 4080 GPU (16 GB video random access memory) for all EDD2020 dataset experiments. The baseline GPU memory usage before model training is 1.6 GB, with GPU memory utilization during training ranging from approximately 3.5 GB to 9.7 GB, which includes the initial GPU usage depending on model architecture complexity. The AdamW optimizer[64] is employed with an initial learning rate of 1 × 10⁻⁴ for most models, except for SETR-MLA, which uses a lower learning rate of 5 × 10⁻⁵, as ViT-based architectures typically require smaller learning rates to converge properly. Learning rates are then annealed to zero using a cosine scheduler with warmup restart (T0 = 10, Tmult = 2) over 150 epochs[65]. A training batch size of 8 is used consistently across all experiments, and fixed random seeds are employed for weight initialization to promote consistency. Model checkpoints are saved at the end of each training epoch, and the checkpoint with the highest validation intersection over union (IoU) value is selected as the final model and used for evaluation on the test set. To account for the inherent non-determinism in computing unified device architecture operations and establish statistically sound comparisons, performance metrics are reported as mean values calculated across three independent training runs, accompanied by standard deviations as error ranges. These measures provide a reliable basis for evaluating performance variability across different model configurations.
Three evaluation metrics are employed to evaluate the segmentation performances of the models, and they include overall pixel accuracy, overall IoU, and overall dice score. Since many images contain only a small portion of disease pixels, the pixel accuracy remains generally high. Therefore, the IoU metric is prioritized for this study to provide a more accurate assessment of the segmentation performance. The equations of overall pixel accuracy, IoU, and dice score are displayed in equations 4-6, respectively.
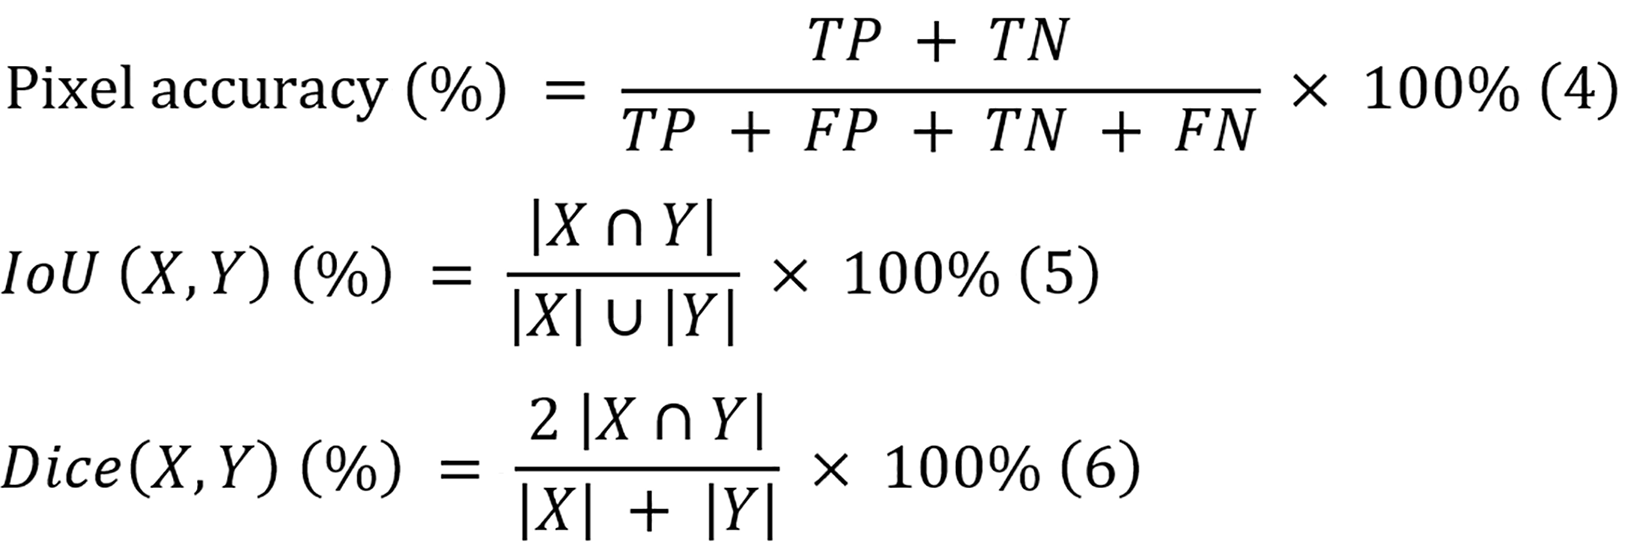
Where TP, TN, FP, and FN denote the numbers of true-positive pixels, true-negative pixels, false-positive pixels, and false-negative pixels, respectively, and X and Y represent the predicted mask and ground truth label, respectively.
For metric computation, different post-processing approaches are applied according to dataset characteristics. For the self-collected dataset, where each pixel is assigned exactly one class, Softmax activation is applied to model outputs to obtain the probabilities of each pixel, followed by a threshold of 0.5 to generate final segmentation masks. For the EDD2020 dataset, which permits multiple labels per pixel, sigmoid activation is applied with the same threshold value. These processed masks are then used to compute all evaluation metrics.
IoU stands as the primary evaluation criterion due to mathematical properties that make it particularly suitable for UGI disease segmentation. The formulation of IoU makes it inherently more sensitive to segmentation errors than the dice score, particularly for small or irregularly shaped lesions that are common in some UGI diseases. While the dice score tends to weight recall and precision equally, IoU applies a more stringent evaluation that better reflects clinical requirements for boundary precision. By prioritizing IoU, this approach selects models that deliver clinically meaningful segmentations that support accurate diagnosis in UGI disease management.
The reliability of these metrics is supported by the structured ground truth annotation methodologies of the two datasets (detailed in dataset construction and data pre-processing). Although inter-observer variability is not formally quantified, the implemented two-tier verification process for the self-collected dataset, which combines supervised annotation with independent clinical validation, enhances the reliability of reference masks for evaluation. Similarly, the EDD2020 dataset employed multi-expert validation with pathology report confirmation for disease annotations. Despite these thorough protocols, inherent subjectivity in disease boundary delineation remains a limitation. This variability may affect reported metrics, as algorithms could be penalized for predictions that differ from the ground truth yet still fall within the range of acceptable clinical interpretations. While the current approach provides reasonable confidence in the reported metrics, future studies should consider quantifying this variability to contextualize algorithm performance relative to human expert disagreement.
Segmentation performance is assessed through both quantitative and qualitative evaluation approaches.
For quantitative evaluation, each trained model is applied to test set images to generate segmentation predictions. These predictions are compared against ground truth masks using overall pixel accuracy, IoU, and dice score, which are calculated on a per-image basis as defined in “Training protocol”.
For qualitative evaluation, a focused analysis approach is adopted by comparing the top-two- and worst-performing models of different model architectures on two representative cases of each class from the test set. These selected cases include both typical presentations and moderately challenging cases with ambiguous boundaries or multiple lesions. The predicted masks from three runs of each model are combined to create composite visualizations showing overlapping regions. This targeted comparison between the highest and lowest performing architectures helps identify specific failure modes, highlight characteristic strengths and limitations of each approach, and provide clearer insights into where and why certain models excel while others struggle with segmentation challenges. In addition, the best-performing model of each model architecture is taken to predict on the representative images of the highly challenging cases, and their results are evaluated to explore the key challenges of UGI disease segmentation and do a specific error analysis for them.
The PET analysis framework evaluates the models across three key dimensions: Performance, training cost, and deployment efficiency. For performance assessment, the average values of the IoU metrics from both the self-collected and EDD2020 datasets are taken as the performance metric for model comparison.
Training cost quantification involves measuring the computational resources required during model development. This includes the mean training time required to complete 150 epochs on both datasets and GPU memory consumption (GB) with a consistent batch size of 8. Training time represents the mean wall-clock time computed across three independent runs of 150 epochs for each model, while GPU memory utilization is determined by measuring the difference between peak consumption during model training and baseline consumption prior to training initialization.
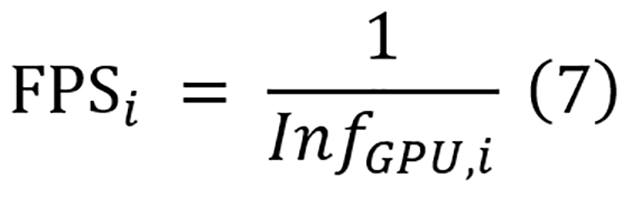
Meanwhile, deployment efficiency assessment focuses on computational metrics critical for clinical implementation, and they include parameter count, floating point operations (FLOPs), and inference time on both CPU and GPU. The parameters and FLOPs of each model are computed using fvcore[66]. For inference time measurement, a rigorous protocol is implemented. Each model is set to evaluation mode and processes inputs with sizes of 224 × 224 with a batch size of 1 to simulate clinical deployment. Then, 10 warm-ups are performed and passed to prime GPU cache, followed by 100 timed inference iterations with proper CPU-GPU synchronization. The mean values of these measurements are used for comparison. While both CPU and GPU inference times are recorded for CNN and transformer-based models, mamba-based models are evaluated exclusively on GPU hardware due to their architecture being specifically designed for GPU acceleration. To directly compare the inference speeds of the models with practical clinical devices, the inference time on GPU is converted to frames per second (FPS). The equation for the FPS calculation for model i is shown in equation 7.
To quantify the overall balance between performance and deployment efficiency, a PET score is employed as defined in equation 8. The PET score focuses exclusively on deployment efficiency metrics (parameters, FLOPs, and inference time) combined with segmentation performance, as these factors directly impact clinical viability. Training costs, while reported for comprehensive comparison, are not incorporated into the PET calculation as they represent one-time development expenses rather than recurring operational constraints in clinical settings. Moreover, as mamba-based models can only be run on GPU, only inference time on GPU is utilized to compute the PET score.

Where (IoU), (avg, i) and (Eff) (norm, i) represent the normalized average IoU and normalized efficiency of model i. When calculating the PET score, these normalized values ensure fair comparisons between models that exhibit different scales of IoU, parameter count, computational complexity, and inference time. For this study, the parameter λ equals 0.5, reflecting the equal significance of both segmentation performance and efficiency in diagnostic applications.
Equation 9 calculates the normalized efficiency as a weighted sum combining three components for model i: Normalized parameter counts (Paramsi), normalized FLOPs (FLOPsi), and normalized inference time (InfGPU, i). Equal importance is assigned to each efficiency component through weighting factors Wp, Wf, and Wi, with each set to 1/3. The normalization equations for all four metrics are displayed in equation 10.

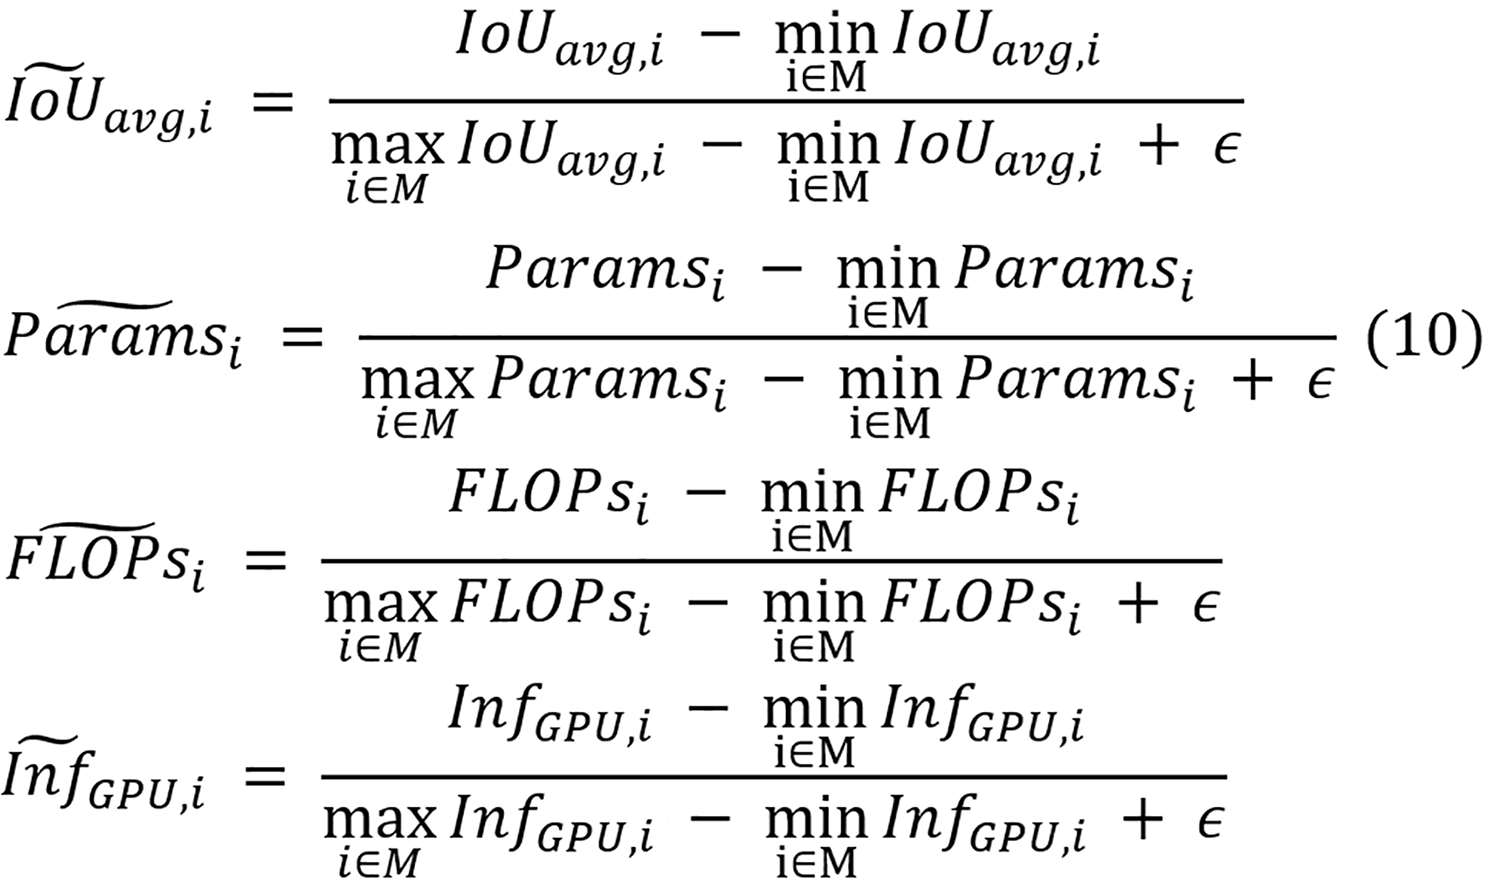
Where IoUavg,i, Paramsi, FLOPsi, and InfGPU,i denote the raw average IoU, parameter count, FLOPs, and inference time of model i, respectively. Across all models in set M, the minimum and maximum average IoU values are represented by min (i∈M), (IoUavg,i) and max (i∈M), (IoUavg,i), with similar notation used for the ranges of parameters, FLOPs, and inference time. An addition of a small constant ϵ of 0.001 is applied to prevent the potential division by zero in the de
A rigorous statistical framework is conducted to perform an objective comparison of performance across architectural paradigms of UGI disease segmentation, and all the statistical procedures are executed using SciPy[67] and stats models[68] libraries. The analysis categorizes models into three distinct architectural groups (CNN-based: n = 6; Transformer-based: n = 6; Mamba-based: n = 5) and employs inferential statistics to identify significant performance differences.
The primary analytical approach utilizes one-way analysis of variance (ANOVA) to assess between-group differences in overall IoU metrics across both datasets. Statistical assumptions, including normality and homoscedasticity, are verified prior to analysis. Statistical significance is established at the conventional threshold of α = 0.05, with effect sizes quantified through partial eta squared (η2) using standard interpretative thresholds (0.01, 0.06, and 0.14 for small, medium, and large effects, respectively)[69].
Secondary analyses include pairwise architectural comparisons using independent samples t-tests with Cohen’s d effect size calculation that uses standard interpretative thresholds (0.2, 0.5, and 0.8 for small, medium, and large effects, respectively) as well[70]. Precision estimates are provided through 95% confidence intervals for the IoU values, enabling both statistical and practical significance assessment. Top-performing models undergo comparative analysis using confidence interval overlap assessment.
To evaluate model generalization across datasets with different disease class structures, a class-agnostic disease detection approach is developed to assess whether models trained on one dataset can effectively identify abnormal regions in images from another dataset, regardless of specific disease classifications.
The analysis involves the conversion of multi-class segmentation masks into binary representations to enable consistent evaluation across datasets with varying disease class structures. Ground truth masks are converted using a specialized function that creates a two-channel format: The first channel preserves the background or normal tissue mask, while the second channel combines all disease classes into a unified disease region mask. For model predictions, the conversion process first normalizes logits to probabilities, when necessary, then applies an argmax operation to determine the predicted class at each pixel. The resulting binary prediction mask similarly contains two channels distinguishing background from disease regions.
For this generalization study, a unidirectional cross-dataset evaluation approach is adopted, where models trained on the self-collected dataset are evaluated on the EDD2020 dataset. This direction is selected for two primary reasons. Firstly, the self-collected dataset contains more diverse pathologies and imaging conditions, which makes it more suitable for comprehensive model training. Evaluating these models against the EDD2020 dataset can provide more meaningful insights into generalization to constrained conditions. Secondly, the limited size of the EDD2020 dataset makes it insufficient for fully training DL models with millions of parameters, thus further justifying the unidirectional approach. The evaluation proceeds using the trained models without any retraining or fine-tuning. For each model, the process involves applying the model to each image in the EDD2020 dataset, converting the multi-class prediction output into a binary mask, converting the EDD2020 ground truth annotations to binary masks, and calculating the segmentation metrics (detailed in “Training protocol”) between the binary prediction and binary ground truth. This evaluation protocol measures the ability of each model to generalize its learned representation of disease characteristics to unseen data sources, imaging equipment, and institutional protocols.
To quantify the generalization, the generalization retention rate (GRR) is introduced. GRR represents the ratio of binary IoU on the unseen dataset to the original IoU on the test split of the training dataset, and its equation is displayed in equation 11. These metrics provide quantitative measures of how well the performance of each model can be transferred to unseen data conditions, with higher values indicating better generalization.
The assessment of the qualitative performance of different models on multi-class disease segmentation of the UGI tract is displayed in Table 5, which presents results on both the self-collected dataset and the public EDD2020 dataset.
| Model | Encoder size | Self-collected dataset | EDD2020 dataset | ||||
| Pixel accuracy (%) | IoU (%) | Dice score (%) | Pixel accuracy (%) | IoU (%) | Dice score (%) | ||
| CNN-based | |||||||
| U-Net | NA | 89.22 ± 0.16 | 82.14 ± 0.21 | 88.47 ± 0.17 | 93.41 ± 0.07 | 67.63 ± 0.48 | 79.37 ± 0.44 |
| ResNet +U-Net | ResNet501 | 92.20 ± 0.14 | 87.30 ± 0.30 | 91.95 ± 0.19 | 94.52 ± 0.31 | 73.97 ± 1.29 | 83.59 ± 1.05 |
| ConvNeXt + UPerNet | ConvNeXt-T1 | 93.05 ± 0.14 | 88.48 ± 0.09 | 92.76 ± 0.10 | 95.17 ± 0.13 | 76.90 ± 0.61 | 85.65 ± 0.48 |
| M2SNet | Res2Net50-v1b-26w-4s1 | 92.17 ± 0.17 | 86.93 ± 0.32 | 91.72 ± 0.26 | 94.80 ± 0.22 | 74.81 ± 1.01 | 84.24 ± 0.79 |
| Dilated SegNet | ResNet501 | 92.43 ± 0.35 | 87.47 ± 0.51 | 92.04 ± 0.32 | 94.46 ± 0.24 | 73.64 ± 0.88 | 83.35 ± 0.78 |
| PraNet | Res2Net50-v1b-26w-4s1 | 92.38 ± 0.29 | 86.35 ± 0.43 | 91.31 ± 0.31 | 94.48 ± 0.07 | 61.12 ± 0.41 | 74.15 ± 0.34 |
| Transformer-based | |||||||
| SwinV2 + UPerNet | SwinV2-T1 | 93.15 ± 0.11 | 88.50 ± 0.18 | 92.84 ± 0.12 | 95.18 ± 0.23 | 76.97 ± 0.89 | 85.59 ± 0.65 |
| Segformer | MiT-B21 | 93.39 ± 0.232 | 88.94 ± 0.38 | 93.14 ± 0.27 | 95.25 ± 0.31 | 77.20 ± 0.98 | 85.90 ± 0.76 |
| SETR-MLA | ViT-B-161 | 90.09 ± 0.43 | 83.37 ± 0.24 | 89.19 ± 0.37 | 94.17 ± 0.36 | 71.48 ± 1.43 | 82.14 ± 1.23 |
| TransUNet | ResNet501 and ViT-B-161 | 90.67 ± 0.35 | 84.55 ± 0.55 | 90.02 ± 0.40 | 92.74 ± 0.18 | 65.06 ± 1.33 | 77.35 ± 1.16 |
| EMCAD | PVTV2-B21 | 93.33 ± 0.19 | 88.74 ± 0.22 | 93.01 ± 0.16 | 95.22 ± 0.22 | 77.07 ± 0.91 | 85.81 ± 0.67 |
| FCBFormer | PVTV2-B21 | 93.04 ± 0.21 | 87.96 ± 0.34 | 92.48 ± 0.28 | 95.04 ± 0.15 | 76.03 ± 0.70 | 85.18 ± 0.45 |
| Mamba-based | |||||||
| Swin-UMamba | VSSM-encoder1 | 92.57 ± 0.10 | 87.78 ± 0.10 | 92.20 ± 0.06 | 93.81 ± 0.30 | 71.12 ± 1.26 | 81.23 ± 0.86 |
| Swin-UMamba-D | VSSM-D-encoder1 | 93.39 ± 0.19 | 89.06 ± 0.202 | 93.19 ± 0.142 | 95.37 ± 0.092 | 77.53 ± 0.322 | 86.15 ± 0.222 |
| UMamba-Bot | NA | 88.47 ± 0.20 | 81.43 ± 0.14 | 87.38 ± 0.22 | 92.04 ± 0.14 | 61.79 ± 0.86 | 75.03 ± 0.80 |
| UMamba-Enc | NA | 87.72 ± 0.11 | 80.74 ± 0.13 | 86.64 ± 0.16 | 92.12 ± 0.29 | 61.82 ± 0.56 | 75.24 ± 0.60 |
| VM-UNETV2 | VM-UNET-encoder1 | 93.09 ± 0.29 | 88.38 ± 0.34 | 92.76 ± 0.33 | 94.89 ± 0.14 | 74.89 ± 0.47 | 84.36 ± 0.42 |
CNN-based models exhibit moderate performance. The best-performing model is ConvNeXt + UPerNet (IoU: 88.48% ± 0.09%), which achieves comparable performance with many transformer-based models, while U-Net produces the lowest IoU of 82.14% ± 0.21% within the group. This performance gap highlights a key takeaway: Modern CNN architectures like ConvNeXt with hierarchical design principles significantly outperform traditional U-Net, which lacks the capacity to effectively capture multi-scale features necessary for complex medical image segmentation, particularly when it lacks a pre-trained encoder for more robust feature extraction.
Transformer-based models generally outperform CNN-based models and most of the mamba-based models, of which SegFormer is the best model (IoU: 88.94% ± 0.38%) and SETR-MLA is the lowest performer (IoU: 83.37% ± 0.24%). SegFormer emerges as the top performer in this category, and it can be attributed to its efficient hierarchical transformer encoder that captures multi-scale features without positional encoding, combined with a lightweight all-MLP decoder that effectively fuses multi-level features. In contrast, the architectural weakness of SETR-MLA stems from its monolithic ViT design that lacks hierarchical feature representation, making it less effective at capturing the multi-scale contextual information critical for accurate boundary delineation in medical images.
In addition, mamba-based models also deliver strong performance. The best model is Swin-UMamba-D, which not only achieves the highest value in IoU (89.06% ± 0.20%), but also a dice score of (93.19% ± 0.14%) across model groups and ties with SegFormer for the highest pixel accuracy of 93.39% ± 0.23% but with a smaller uncertainty range. Its exceptional performance can be attributed to three key factors: (1) Effective long-range dependency modeling through SSMs with linear complexity; (2) The integration of ImageNet pre-trained weights in its visual-state-space-model (VSSM)-encoder, which proves crucial for medical image segmentation with limited data; and (3) Its specialized mamba-based decoder that efficiently integrates multi-scale features. However, U-Mamba-Enc, which is also a mamba-based model, records the lowest IoU (80.74% ± 0.13%) across all models.
On the EDD2020 dataset, similar performance trends are observed but with some notable differences. Overall, the IoU scores are significantly lower across all models compared to the self-collected dataset, indicating the challenging nature of the EDD2020 dataset as a multi-label, multi-class segmentation dataset. Swin-UMamba-D maintains its superior performance, achieving the highest metrics across all metrics (pixel accuracy: 95.37% ± 0.09%, IoU: 77.53% ± 0.32%, dice score: 86.15% ± 0.22%). Among transformer-based models, SegFormer also continues to demonstrate strong performance (IoU: 77.20% ± 0.98%), closely followed by PVTV2 + EMCAD (IoU: 77.07% ± 0.91%). In the CNN-based category, ConvNeXt + UPerNet leads again with an IoU of 76.90% ± 0.61%. Notably, PraNet performs the worst on EDD2020 in IoU values, suggesting its architectural design may not generalize well to the specific challenges presented by the EDD2020 dataset.
In general, Swin-UMamba-D emerges as the best model in performance evaluation across both datasets, demonstrating its robust generalization and effectiveness in medical image segmentation tasks.
Deriving from the experimental results, three main key takeaways can be highlighted as follows: (1) Hierarchical architecture and pre-training drive superior performance: Both SegFormer and Swin-UMamba-D achieve top performance, while this advantage of hierarchical architecture persists on the EDD2020 dataset, with Swin-UMamba-D leading, followed by SegFormer. The success of these models can be attributed to a key architectural choice: The use of encoders with hierarchical feature extraction that effectively capture multi-scale features, which are crucial for delineating diverse UGI structures. In addition, leveraging pre-trained weights from ImageNet-1K significantly boosts performance. This highlights the importance of transfer learning in medical image analysis, especially with limited training data, and demonstrates that these architectural advantages translate across different datasets with varying characteristics; (2) Architectural limitations hinder low-performing models: The lowest-performing models exhibit similar architectural deficiencies when evaluated on both datasets. On the self-collected dataset, U-Net (82.14% ± 0.21% IoU), U-Mamba variants (80.74% ± 0.13%, 81.43% ± 0.14% IoU), and SETR-MLA (83.37% ± 0.24% IoU) lag significantly behind top performers. This performance gap widens even further on the more challenging EDD2020 dataset, where U-Net (67.63% ± 0.48%), U-Mamba variants (61.79% ± 0.86%, 61.82% ± 0.56% IoU), and PraNet (61.12% ± 0.41% IoU) show dramatic performance drops. U-Net and U-Mamba variants lack both pre-training and sophisticated multi-scale feature extraction mechanisms, and these can severely limit their ability to capture complex anatomical details. Despite pre-training, SETR-MLA and TransUNet perform badly due to their monolithic ViT architectures, which are inherently data-inefficient and struggle to generalize effectively in data-constrained medical imaging applications. Notably, PraNet shows a dramatic performance difference between the two datasets, in which it performs even worse than U-Net without pre-training, despite using the same ImageNet pre-training approach for both. This performance gap likely stems from the architectural design of PraNet, which prioritizes high-level features through its parallel partial decoder while intentionally reducing the contribution of low-level features. This design choice may limit its ability to adapt effectively to the diverse characteristics of the EDD2020 dataset from ImageNet pre-training alone. These limitations collectively demonstrate that models with suboptimal architectural designs, such as lacking multi-scale feature extraction capabilities or employing inefficient feature processing mechanisms or appropriate pre-training strategies, fail to achieve competitive results in complex medical segmentation tasks; and (3) Encoder architecture primarily determines performance, while decoder design refines efficiency: Experimental results reveal a hierarchical relationship between architectural components in segmentation models. Encoders establish performance ranges that remain consistent across datasets, as demonstrated by VSSM-encoder models achieving 89.06% ± 0.20% IoU on the self-collected dataset and 77.53% ± 0.32% IoU on EDD2020. Decoders optimize within these encoder-defined boundaries, with varying impact across encoder families. ResNet50-based models show minimal decoder-dependent variation (0.17% IoU on self-collected dataset, 0.33% on EDD2020), while Swin-UMamba-D demonstrates significant improvements (1.28% IoU on self-collected dataset, 6.41% on EDD2020) compared to standard Swin-UMamba. Aside from this, this pattern of decoder-dependent performance variation also extends to other architectures like PVTV2 models. These findings suggest selecting encoders based on performance requirements and then optimizing decoders for efficiency is particularly valuable for resource-constrained medical applications.
The qualitative performance of various segmentation models is assessed by examining segmentation maps overlaid on raw images from the test splits of the two datasets. Each model is trained three times, and the overlapping regions of the resulting segmentation maps are color-coded, with light blue for fully overlapping regions, medium blue for two-map overlaps, and dark blue for single-map regions. For the self-collected dataset, ground truth masks are shown in yellow, while class-specific colors are assigned to different classes. These include pink for BE, lime for suspicious regions, blue for HGD, yellow for cancer, and cyan for polyps. To perform a focused analysis, only the top-two- and worst-performing models from each architecture based on the quantitative results in “Segmentation quantitative results” are included in the visualizations. Thus, the visualizations for the self-collected dataset include U-Net, dilated SegNet, ConvNeXt + UPerNet, SETR-MLA, PVTV2 + EMCAD, SegFormer, UMamba-Enc, VM-UNETV2, and Swin-UMamba-D. For the EDD2020 dataset, the models visualized are PraNet, M2SNet, ConvNeXt + UPerNet, TransUNet, PVTV2 + EMCAD, SegFormer, UMamba-Bot, VM-UNETV2, and Swin-UMamba-D.
Figure 6 shows the predicted masks generated by the top-two- and worst-performing models on representative images of each class of the self-collected dataset. Among the top performers, ConvNeXt + UPerNet, SegFormer, and Swin-UMamba-D consistently produce segmentation maps with a high proportion of light blue areas, indicating strong agreement across the three training runs, and these masks also align well with the ground truth masks, particularly for larger and more distinct lesions like EN1, EV2, GERD1, GN2, GV1, and both GP1 and GP2 (Figure 6). In contrast, models like U-Net, SETR-MLA, and UMamba-Enc, which are identified as the worst performers from their respective architectures, generate more dark blue areas and sometimes no regions for the ground truth classes, reflecting lower consistency in their segmentations and severe misclassification of disease classes. These models also frequently struggle to accurately delineate smaller or more subtle lesions like GP1 and DU2, resulting in incomplete or erroneous segmentation maps. Other models, such as SETR-MLA, PVTV2 + EMCAD, UMamba-Enc, and VM-UNETV2, show varying degrees of consistency and alignment with the ground truth, and their results fall between the extremes of the top and worst performers.

In addition, similar performance trends are also observed among the visualized models for the EDD2020 dataset, and Figure 7 displays the predicted masks generated by the top-two- and worst-performing models on representative images of each class of the EDD2020 dataset. The top-performing models, which include ConvNeXt + UPerNet, SegFormer, and Swin-UMamba-D, produce segmentation maps with a predominance of light blue areas that align well with the ground truth masks, and they excel at segmenting most of the classes like BE1, cancer1, HGD1, and polyp1 (Figure 7). Low- and moderate-performing models show adequate disease region identification, whereas UMamba-Bot demonstrates significant underperformance that is characterized by empty predictions or minimal darker regions with fragmented and pixelated boundaries for the ground truth classes.

However, all the models struggle to perform well consistently for images that contain multiple labels for certain labels, such as BE + cancer, BE + suspicious, and polyp + suspicious. These composite lesions often involve overlapping features or ambiguous boundaries, which present significant challenges for segmentation, and all models struggle with two specific challenges: Multi-labeled images (Multi3, Multi4 in Figure 7) and suspicious disease regions (Sus1, Multi4 in Figure 7). These difficulties likely stem from insufficient training examples and the complex nature of suspicious regions, in which the models simply identify the obvious disease when suspicious areas appear alongside clear disease features in the same location. For multi-label cases, no single model consistently outperforms the others, as each architecture has distinct strengths and weaknesses. CNN-based models excel at well-defined lesions like polyps and ulcers, capturing sharp transitions but often missing small lesion parts in low-lighting conditions. Transformer-based models produce detailed segmentation maps with smoother boundaries but occasionally break larger lesions into smaller parts, leading to over segmentation. Mamba-based models deliver comparable results but sometimes generate masks with broken or discontinued boundaries, though they occasionally capture small details that the other models overlook. These findings underscore the need for improved training strategies and architectural designs to better handle multi-label scenarios and suspicious regions.
The qualitative analysis reveals that despite achieving state-of-the-art performance metrics, the top-performing models, which are ConvNeXt + UPerNet, SegFormer, and Swin-UMamba-D from each model architecture, still exhibit notable limitations in endoscopic image segmentation, and these limitations manifest across challenging clinical scenarios and highlight areas for future improvement. Representative examples of these challenging cases with the predicted masks generated by the top-performing models are displayed in Figure 8, with hard examples from self-collected dataset (HardA) and hard examples from EDD2020 dataset (HardB) highlighted for comparison. By examining model behaviors across diverse pathological presentations, four primary categories of segmentation challenges are identified as follows: (1) Boundary delineation challenges: Lesions with poorly defined edges are more difficult to segment. This may be due to the disease itself (e.g., GERD), lighting, or distance from the camera. Models often miss parts of these lesions, as seen with GERD2 and DU2 (Figure 6), and the smaller polyps in GP1 and GP2 (Figure 6). In addition, all the top-performing models perform badly on HardA1 and HardA2 (Figure 8); (2) Sensitivity to lighting conditions: The impact of lighting on segmentation varies between model groups. For example, EN1 and GU2 (Figure 6) and HardA2 (Figure 8) feature small lesion regions at the least lit environment, and the top-performing models cannot consistently identify the disease regions at low-lit environments. However, when the boundaries are distinct and apparent, like in HardB2 (Figure 8), all the models can identify the BE region but struggle to identify the suspicious region; (3) Lesion differentiation issues: It is difficult to distinguish the lesion parts that share similar features with the normal parts of the images in terms of color and texture. This issue is particularly more frequent for varices images, and models may confuse swollen veins with normal veins, thus reducing accuracy like HardA4 and HardB3 (Figure 8); and (4) Misidentification of disease classes by the models: Models may misclassify lesions, leading to incorrect or empty segmentation maps. This issue is particularly evident in challenging cases like HardA1 and HardA2 (Figure 8), where even predictions from top-performing models rarely achieve substantial overlap with ground truth annotations. In these instances, the models correctly identify lesions only once or twice across multiple runs. More concerning, all three models consistently fail to generate any predicted masks for the HGD ground truth in HardB3 (Figure 8) across all runs.

Despite their impressive quantitative performance, the top-performing models exhibit specific limitations that affect their clinical reliability: (1) Swin-UMamba-D demonstrates several notable weaknesses despite its leading IoU and dice scores. The model occasionally produces over-segmentation in regions with complex textures, particularly in gastric mucosa with prominent rugae patterns. While Swin-UMamba-D is generally robust to lighting variations, it shows decreased confidence in boundary delineation under extreme lighting conditions, as evidenced in EN2 (Figure 6). Furthermore, the model incorrectly breaks up segmentation masks into disconnected regions when specular reflections, which are areas of high light intensity, are present in the images. This breaking up disrupts the continuity of lesion boundaries in these affected areas; (2) SegFormer exhibits different error patterns, most notably in cases with gradual disease transitions. For example, the model struggles to consistently identify the full extent of the lesion in GN2 (Figure 6), with significant variation between runs. Besides, SegFormer occasionally misses minimal lesions closer to the periphery of the field of view, as seen in the smaller polyps in GP1 (Figure 6), suggesting challenges in detecting minimal abnormalities at image boundaries; and (3) ConvNeXt + UPerNet demonstrates the classification weaknesses in variceal cases such as EV2 and GV1 (Figure 6), where both models occasionally misclassify normal veins as variceal tissue and vice versa. Moreover, it is also weaker at identifying lesions with indistinct boundaries, like HardA1 and HardA2 (Figure 8), in which it almost gives empty masks for almost all the runs.
These varied error patterns highlight the complementary weaknesses in current segmentation approaches. Each of the top-performing models reveals distinct weaknesses: Swin-UMamba-D underperforms with textural complexity and lighting irregularities, SegFormer struggles to accurately capture subtle disease progressions and small lesions closer to image borders, and ConvNeXt + UPerNet inadequately discriminates between similar-appearing tissues and lesions with poorly defined margins. Most importantly, all models exhibit disease class misidentification in particularly challenging cases, suggesting that future architectural improvements should address these specific failure modes through enhanced feature extraction for subtle pathological details, improved robustness to imaging variations, and more sophisticated mechanisms for distinguishing between visually similar conditions.
Table 6 demonstrates the comparison of different efficiency metrics for all models, while Table 7 presents a comprehensive model comparison on PET. Notably, Swin-UMamba-D performs the best in segmentation, achieving an average IoU of 83.29% on the two datasets, demonstrating the potential of mamba-based architectures for medical image segmentation, albeit at the cost of relatively high training time and longer inference time. In contrast, SegFormer delivers the best overall efficiency-performance balance with the highest PET score of 92.02%, which combines competitive segmentation accuracy (83.07% average IoU) with minimal computational demands (4.23 giga FLOPs (GFLOPs) and acceptable inference time (9.68 ms ± 0.75 ms) on GPU.
| Model | Parameters (M) | FLOPs (G) | GPU usage (GB) | Mean training time (minute) | Mean inference time (ms) | FPS | ||
| Self-collected | EDD 2020 | CPU | GPU | |||||
| CNN-based | ||||||||
| U-Net | 31.46 | 36.95 | 3.30 | 82.79 ± 0.25 | 10.35 ± 0.03 | 215.35 ± 37.50 | 3.64 ± 6.321 | 274.731 |
| ResNet + U-Net | 32.52 | 8.23 | 2.00 | 57.03 ± 0.351 | 6.69 ± 0.121 | 62.67 ± 6.32 | 5.18 ± 0.35 | 193.05 |
| ConvNeXt + UPerNet | 41.37 | 16.71 | 2.50 | 77.63 ± 0.16 | 8.84 ± 0.10 | 102.97 ± 8.35 | 5.65 ± 0.40 | 176.99 |
| M2SNet | 29.89 | 13.50 | 2.50 | 89.83 ± 1.75 | 9.15 ± 0.07 | 101.97 ± 6.52 | 14.86 ± 1.21 | 67.29 |
| Dilated SegNet | 18.111 | 20.72 | 3.20 | 98.38 ± 0.87 | 10.71 ± 0.04 | 146.60 ± 9.76 | 9.23 ± 1.24 | 108.34 |
| PraNet | 32.56 | 5.30 | 1.801 | 84.06 ± 0.22 | 8.18 ± 0.10 | 65.78 ± 7.19 | 12.16 ± 0.78 | 82.24 |
| Transformer-based | ||||||||
| SwinV2 + UPerNet | 41.91 | 17.19 | 2.70 | 89.07 ± 0.98 | 8.96 ± 0.09 | 126.12 ± 13.56 | 12.19 ± 0.65 | 82.03 |
| SegFormer | 24.73 | 4.23 | 2.00 | 71.93 ± 0.11 | 8.04 ± 0.19 | 61.48 ± 5.74 | 9.68 ± 0.75 | 103.31 |
| SETR-MLA | 90.77 | 18.60 | 3.00 | 71.40 ± 1.13 | 9.18 ± 0.17 | 109.13 ± 4.38 | 5.55 ± 0.52 | 180.18 |
| TransUNet | 105.00 | 29.33 | 4.50 | 107.16 ± 0.84 | 12.87 ± 0.21 | 204.71 ± 25.55 | 13.03 ± 0.71 | 76.75 |
| PVTV2 + EMCAD | 26.77 | 4.43 | 2.50 | 85.03 ± 1.18 | 9.08 ± 0.12 | 78.35 ± 9.39 | 12.56 ± 1.99 | 79.62 |
| FCBFormer | 33.09 | 29.98 | 8.10 | 163.76 ± 0.56 | 18.44 ± 0.13 | 305.01 ± 34.36 | 21.43 ± 3.49 | 46.66 |
| Mamba-based | ||||||||
| Swin-UMamba | 59.89 | 31.46 | 6.00 | 162.35 ± 0.57 | 20.68 ± 0.49 | NA | 13.00 ± 0.68 | 76.92 |
| Swin-UMamba-D | 27.50 | 6.10 | 5.30 | 148.57 ± 0.68 | 17.46 ± 0.13 | NA | 12.97 ± 1.53 | 77.10 |
| UMamba-Bot | 28.77 | 18.68 | 2.90 | 91.31 ± 0.15 | 11.03 ± 0.06 | NA | 6.27 ± 0.54 | 159.49 |
| UMamba-Enc | 27.56 | 19.05 | 3.10 | 97.68 ± 0.33 | 12.07 ± 0.04 | NA | 7.28 ± 0.45 | 137.36 |
| VM-UNETV2 | 22.77 | 4.071 | 3.20 | 108.95 ± 0.23 | 12.12 ± 0.21 | NA | 12.90 ± 7.27 | 77.52 |
| Model | Parameters (M) | FLOPs (G) | Mean inference time on GPU (ms) | IoU (%) | Average IoU (%) | PET score (%) | |
| Self-collected | EDD 2020 | ||||||
| CNN-based | |||||||
| U-Net | 31.46 | 36.95 | 3.64 ± 6.321 | 82.14 ± 0.21 | 67.63 ± 0.48 | 74.88 | 45.74 |
| ResNet + U-Net | 32.52 | 8.23 | 5.18 ± 0.35 | 87.30 ± 0.30 | 73.97 ± 1.29 | 80.63 | 82.58 |
| ConvNeXt + UPerNet | 41.37 | 16.71 | 5.65 ± 0.40 | 88.48 ± 0.09 | 76.90 ± 0.61 | 82.69 | 84.70 |
| M2SNet | 29.89 | 13.50 | 14.86 ± 1.21 | 86.93 ± 0.32 | 74.81 ± 1.01 | 80.87 | 72.33 |
| Dilated SegNet | 18.111 | 20.72 | 9.23 ± 1.24 | 87.47 ± 0.51 | 73.64 ± 0.88 | 80.55 | 74.88 |
| PraNet | 32.56 | 5.30 | 12.16 ± 0.78 | 86.35 ± 0.43 | 61.12 ± 0.41 | 73.74 | 48.81 |
| Transformer-based | |||||||
| SwinV2 + UPerNet | 41.91 | 17.19 | 12.19 ± 0.65 | 88.50 ± 0.18 | 76.97 ± 0.89 | 82.74 | 78.41 |
| SegFormer | 24.73 | 4.23 | 9.68 ± 0.75 | 88.94 ± 0.38 | 77.20 ± 0.98 | 82.86 | 92.021 |
| SETR-MLA | 90.77 | 18.60 | 5.55 ± 0.52 | 83.37 ± 0.24 | 71.48 ± 1.43 | 77.42 | 52.45 |
| TransUNet | 105.00 | 29.33 | 13.03 ± 0.71 | 84.55 ± 0.55 | 65.06 ± 1.33 | 74.81 | 26.39 |
| PVTV2 + EMCAD | 26.77 | 4.43 | 12.56 ± 1.99 | 88.74 ± 0.22 | 77.07 ± 0.91 | 82.91 | 88.14 |
| FCBFormer | 33.09 | 29.98 | 21.43 ± 3.49 | 87.96 ± 0.34 | 76.03 ± 0.70 | 82.00 | 61.89 |
| Mamba-based | |||||||
| Swin-UMamba | 59.89 | 31.46 | 13.00 ± 0.68 | 87.78 ± 0.10 | 71.12 ± 1.26 | 79.45 | 53.31 |
| Swin-UMamba-D | 27.50 | 6.10 | 12.97 ± 1.53 | 89.06 ± 0.201 | 77.53 ± 0.321 | 83.291 | 88.39 |
| UMamba-Bot | 28.77 | 18.68 | 6.27 ± 0.54 | 81.43 ± 0.14 | 61.79 ± 0.86 | 71.61 | 39.45 |
| UMamba-Enc | 27.56 | 19.05 | 7.28 ± 0.45 | 80.74 ± 0.13 | 61.82 ± 0.56 | 71.28 | 37.15 |
| VM-UNETV2 | 22.77 | 4.071 | 12.90 ± 7.27 | 88.38 ± 0.34 | 74.89 ± 0.47 | 81.63 | 83.48 |
In clinical settings, modern video endoscopes and gastroscopes typically operate at frame rates of 30 or 60 FPS[71], while more advanced medical imaging systems currently offer enhanced high-frame-rate capabilities that capture 120 FPS[72]. Notably, all inference time is measured on 224 × 224 pixel images, which are smaller than typical clinical images. At this resolution, most of the models, except FCBFormer, obtain frame rates higher than 60 FPS. U-Net demonstrates exceptional throughput (274.73 FPS), while other efficient architectures like ConvNeXt + UPerNet (176.99 FPS), SETR-MLA (180.18 FPS), and UMamba-Bot (159.49 FPS) also achieve high frame rates. Nevertheless, for higher-resolution images commonly used in clinical practice (512 × 512 or larger), inference time would likely increase substantially, potentially by a factor of 4 to 16 depending on the model architecture and resolution requirements. This scaling effect would further challenge the real-time applicability of models with already lower frame rates like FCBFormer (46.66 FPS) or M2SNet (67.29 FPS) in resource-constrained clinical environments, where processing of high-resolution images may be necessary for accurate diagnosis.
This analysis further reveals that inference time on CPU generally correlates with FLOPs across most models, with higher FLOPs typically resulting in longer CPU processing time. This pattern is evidenced by U-Net (36.95 GFLOPs, 215.35 ms ± 37.50 ms on CPU) and FCBFormer (29.98 GFLOPs, 305.01 ms ± 34.36 ms on CPU). However, GPU inference time and the resulting FPS show a notably weaker correlation with FLOPs, highlighting the impact of architecture-specific optimizations. This discrepancy likely stems from GPU optimization for established architectures that have received years of development, like U-Net (3.64 ms ± 6.32 ms, 274.73 FPS) and SETR-MLA (5.55 ms ± 0.52 ms, 180.18 FPS) containing ViT. In contrast, the latest mamba-based models show less favorable GPU efficiency relative to their FLOPs, with VM-UNETV2 achieving only 77.52 FPS despite having merely 4.07 GFLOPs. From a clinical reliability perspective, it is worth noting that U-Net and VM-UNETV2 exhibit concerning inference time variability (U-Net: ± 6.32 ms; VM-UNETV2: ± 7.27 ms), which could impact their dependability in time-sensitive applications despite the impressive average frame rate of U-Net.
Training costs represent another notable dimension for the evaluation of PET. CNN-based models generally de
Table 8 displays the statistical comparison of CNN-based, transformer-based, and mamba-based models across the two datasets. The one-way ANOVA results reveal no statistically significant differences between architecture types in either the self-collected dataset (F = 0.38, P = 0.69, η2 = 0.05) or the EDD2020 dataset (F = 0.79, P = 0.47, η2 = 0.10). The effect size is small to medium for the former and medium for the latter.
| Architecture type | Models (n) | Mean IoU (%) (95%CI) | Pairwise comparisons |
| Self-collected dataset | |||
| CNN-based | 6 | 86.44 (84.11, 88.77) | vs T: T = -0.43, P = 0.68, d = 0.25 |
| vs M: T = 0.50, P = 0.63, d = -0.30 | |||
| Transformer-based | 6 | 87.01 (84.48, 89.55) | vs C: T = 0.43, P = 0.68, d = 0.25 |
| vs M: T = 0.78, P = 0.46, d = -0.46 | |||
| Mamba-based | 5 | 85.48 (80.46, 90.50) | vs C: T = -0.50, P = 0.63, d = -0.30 |
| vs T: T = -0.78, P = 0.46, d = -0.46 | |||
| EDD2020 dataset | |||
| CNN-based | 6 | 71.35 (65.16, 77.53) | vs T: T = -0.84, P = 0.42, d = 0.49 |
| vs M: T = 0.48, P = 0.64, d = -0.29 | |||
| Transformer-based | 6 | 73.97 (68.85, 79.08) | vs C: T = 0.84, P = 0.42, d = 0.49 |
| vs M: T = 1.23, P = 0.25, d = -0.73 | |||
| Mamba-based | 5 | 69.43 (60.34, 78.52) | vs C: T = -0.48, P = 0.64, d = -0.29 |
| vs T: T = -1.23, P = 0.25, d = -0.73 | |||
In addition, the pairwise comparisons using independent t-tests show no significant differences between any architecture pairs. In the self-collected dataset, all comparisons between CNN and transformer (t = -0.43, P = 0.68, d = 0.25), CNN and mamba (t = 0.50, P = 0.63, d = -0.30), and transformer and mamba (t = 0.78, P = 0.46, d = -0.46) yield non-significant results. Similarly, the EDD2020 dataset showed no significant differences between CNN and transformer (t = -0.84, P = 0.42, d = 0.49), CNN and mamba (t = 0.48, P = 0.64, d = -0.29), or transformer and mamba architectures (t = 1.23, P = 0.25, d = -0.73).
The top individual models, which refer to Swin-UMamba-D [89.06% (88.55, 89.56)] and SegFormer [88.94% (88.00, 89.88)] for the self-collected dataset and Swin-UMamba-D [77.53% (76.74, 78.32)] and SegFormer [77.20% (74.76, 79.65)] for the EDD2020 dataset, show comparable performance without statistically significant differences.
In sum, the statistical analysis reveals no significant performance differences among CNN-based, transformer-based, and mamba-based architectures across the two datasets. These findings suggest functional equivalence among architectural approaches for medical image segmentation tasks, despite their fundamentally different computational mechanisms. While the medium effect size in the EDD2020 dataset (η2 = 0.10) and relatively small sample sizes (n = 5-6 models per type) indicate that subtle differences may exist but remain undetected in the current analysis. Their comparable performance demonstrates that all three architectures can achieve clinically viable segmentation results, and this enables researchers and practitioners to select models based on practical considerations such as GPU memory requirements, inference time, model size, and compatibility with edge devices.
Table 9 presents a performance comparison of CNN-based, transformer-based, and mamba-based segmentation models evaluated on the self-collected dataset and through cross-validation on the test split of the EDD2020 dataset. The cross-validation results on EDD2020 reveal significant performance drops across all architectures, highlighting the challenge of domain generalization in medical image segmentation. The transformer-based PVTV2 + EMCAD achieves the highest IoU (63.35% ± 1.44%) on unseen data, followed closely by FCBFormer (62.91% ± 0.63%) and SegFormer (62.36% ± 1.06%). Among mamba-based models, Swin-UMamba shows the best generalization with an IoU of 62.26% ± 1.72%, while ConvNeXt + UPerNet leads the CNN-based approaches with 60.87% ± 0.72% IoU. Similar patterns are also observed in pixel accuracy and dice scores, with FCBFormer and EMCAD achieving the highest values (around 75% for both metrics), which confirms their superior performance across different evaluation criteria.
| Model | Self-collected dataset | Cross validation on EDD2020 dataset | GRR (%) | ||||
| Pixel accuracy (%) | IoU (%) | Dice score (%) | Pixel accuracy (%) | IoU (%) | Dice score (%) | ||
| CNN-based | |||||||
| U-Net | 89.22 ± 0.16 | 82.14 ± 0.21 | 88.47 ± 0.17 | 67.77 ± 1.17 | 53.72 ± 1.28 | 67.77 ± 1.17 | 65.41 |
| ResNet + U-net | 92.20 ± 0.14 | 87.30 ± 0.30 | 91.95 ± 0.19 | 71.62 ± 1.09 | 58.52 ± 1.49 | 71.62 ± 1.09 | 67.03 |
| ConvNeXt + UPerNet | 93.05 ± 0.14 | 88.48 ± 0.09 | 92.76 ± 0.10 | 73.60 ± 0.42 | 60.87 ± 0.72 | 73.60 ± 0.42 | 68.79 |
| M2SNet | 92.17 ± 0.17 | 86.93 ± 0.32 | 91.72 ± 0.26 | 71.98 ± 0.24 | 58.80 ± 0.23 | 71.98 ± 0.24 | 67.64 |
| Dilated SegNet | 92.43 ± 0.35 | 87.47 ± 0.51 | 92.04 ± 0.32 | 72.26 ± 0.38 | 59.54 ± 0.52 | 72.26 ± 0.38 | 68.08 |
| PraNet | 92.38 ± 0.29 | 86.35 ± 0.43 | 91.31 ± 0.31 | 70.17 ± 1.45 | 56.81 ± 1.82 | 70.17 ± 1.45 | 65.79 |
| Transformer-based | |||||||
| SwinV2 + UPerNet | 93.15 ± 0.11 | 88.50 ± 0.18 | 92.84 ± 0.12 | 72.96 ± 0.71 | 60.29 ± 0.62 | 72.96 ± 0.71 | 68.12 |
| SegFormer | 93.39 ± 0.231 | 88.94 ± 0.38 | 93.14 ± 0.27 | 74.36 ± 1.12 | 62.36 ± 1.06 | 74.36 ± 1.12 | 70.11 |
| SETR-MLA | 90.09 ± 0.43 | 83.37 ± 0.24 | 89.19 ± 0.37 | 71.78 ± 2.48 | 58.08 ± 2.76 | 71.78 ± 2.48 | 69.67 |
| TransUNet | 90.67 ± 0.35 | 84.55 ± 0.55 | 90.02 ± 0.40 | 70.25 ± 1.24 | 56.77 ± 1.43 | 70.25 ± 1.24 | 67.14 |
| PVTV2 + EMCAD | 93.33 ± 0.19 | 88.74 ± 0.22 | 93.01 ± 0.16 | 75.24 ± 1.31 | 63.35 ± 1.441 | 75.24 ± 1.31 | 71.38 |
| FCBFormer | 93.04 ± 0.21 | 87.96 ± 0.34 | 92.48 ± 0.28 | 75.32 ± 0.551 | 62.91 ± 0.63 | 75.32 ± 0.551 | 71.521 |
| Mamba-based | |||||||
| Swin-UMamba | 92.57 ± 0.10 | 87.78 ± 0.10 | 92.20 ± 0.06 | 74.43 ± 1.23 | 62.26 ± 1.72 | 74.43 ± 1.23 | 70.93 |
| Swin-UMamba-D | 93.39 ± 0.19 | 89.06 ± 0.201 | 93.19 ± 0.141 | 73.83 ± 1.68 | 61.77 ± 1.48 | 73.83 ± 1.68 | 69.36 |
| UMamba-Bot | 88.47 ± 0.20 | 81.43 ± 0.14 | 87.38 ± 0.22 | 67.03 ± 2.52 | 52.76 ± 2.86 | 67.03 ± 2.52 | 64.78 |
| UMamba-Enc | 87.72 ± 0.11 | 80.74 ± 0.13 | 86.64 ± 0.16 | 66.35 ± 1.96 | 52.74 ± 2.31 | 66.35 ± 1.96 | 65.33 |
| VM-UNETV2 | 93.09 ± 0.29 | 88.38 ± 0.34 | 92.76 ± 0.33 | 73.82 ± 1.73 | 61.41 ± 2.09 | 73.82 ± 1.73 | 69.49 |
GRR quantifies the ability of each model to maintain performance when applied to unseen data distributions. Across all evaluated models, the GRR values range from 64.78% to 71.52%, indicating that even the best-performing model loses 28.48% of its performance when generalizing unseen data. Among these models, FCBFormer achieves the highest GRR of 71.52%, indicating its superior generalization. Several models across different architectural paradigms also show comparable generalization, with SegFormer, PVTV2 + EMCAD, and Swin-UMamba all exceeding 70% for their GRR values. Notably, the simplest models (U-Net, UMamba-Bot, and UMamba-Enc) demonstrate the worst generalization, with GRR values of approximately 65%.
These results suggest that transformer-based models generally demonstrate better generalization to unseen conditions, while certain mamba-based models also show promising potential for medical image segmentation tasks. The hybrid approaches that combine different architectural elements (such as Swin-UMamba and FCBFormer) appear particularly effective at balancing performance on familiar data with generalization to new domains.
Figure 9 shows examples of segmentation output visualizations of different models for the cross-dataset evaluation. For each architectural category, models with the highest performance metrics on both the self-collected dataset and the EDD2020 dataset are included: ConvNeXt + UPerNet (strong performer on both datasets), SegFormer and Swin-UMamba-D (best on self-collected data), and PVTV2 + EMCAD, FCBFormer, and Swin-UMamba (superior on EDD2020). The results reveal significant generalization challenges across all architectures. While models can produce approximate segmentations for more distinct pathologies like Sus1, cancer1, and polyp1, they struggle considerably with unfamiliar conditions and subtle abnormalities. For cases with ambiguous boundaries or unseen classes such as BE1, HGD1, and challenging anomalies (HardA1), all models generate inconsistent, fragmented masks with poor boundary adherence across multiple runs. These qualitative findings align with the quantitative GRR results, reinforcing that current state-of-the-art segmentation approaches, regardless of their architectural paradigm.

The comprehensive comparative study of 17 state-of-the-art models provides several key insights into automated disease segmentation approaches. Quantitative and qualitative evaluations demonstrate that modern DL architectures effectively segment UGI diseases with IoU values ranging from 80.74% to 89.06% and 61.12% to 77.53% on the self-collected dataset and EDD2020 dataset, respectively. Results reveal clear performance stratification correlating with architectural design choices rather than fundamental computational paradigms. Models incorporating hierarchical feature extraction and pre-trained encoders consistently outperform those without these characteristics across all architecture types. Statistical analysis shows no significant differences between architectural paradigms (P = 0.69 for self-collected dataset, P = 0.47 for EDD2020), suggesting well-designed models from any architectural group can achieve clinically viable results.
This study is positioned as a clinical translational validation study, offering actionable insights for real-world deployment and presenting several key advantages over prior research. First, it provides a comprehensive evaluation of 17 segmentation models across three major architectural paradigms, representing the largest systematic comparison in UGI disease segmentation to date. This extensive evaluation offers deeper insights into how architectural design choices influence segmentation performance, enabling clinicians to select models tailored to specific diagnostic challenges. Second, the self-collected dataset (3313 images, 9 classes) significantly surpasses existing public datasets in both size (8.5 × more images) and class diversity (nearly double the coverage). This ensures robust evaluation of model generalizability across diverse clinical scenarios, making the findings more applicable to real-world endoscopic practices. Third, the introduction of PET scores and GRR provides a novel framework for assessing the clinical deployment potential of segmentation models, directly addressing the gap between theoretical performance and practical application in routine diagnostic workflows. Fourth, this study systematically identifies the strengths and weaknesses of different architectural families, offering actionable recommendations for improving diagnostic accuracy, reducing missed lesions, and addressing critical challenges such as lighting variability, boundary delineation, and dataset constraints. By focusing on clinical applicability rather than purely technical innovation, this study provides a strong foundation for developing automated systems that can assist endoscopists, streamline workflows, and improve patient outcomes in real-world settings.
Each architecture family also exhibits distinct strengths and limitations. CNN-based models excel with well-defined lesions like polyps and ulcers, where localized receptive fields effectively capture sharp transitions, but struggle with diffuse pathologies like GERD and under low-lighting conditions. This limitation stems from their inherently restricted receptive fields that cannot effectively capture global context. Transformer-based architectures address this limitation through their global attention mechanisms, demonstrating superior resilience to contextual complexity, particularly in multi-class scenarios and cases requiring broader contextual understanding like GERD and BE. However, their computational complexity presents challenges for real-time clinical applications. Mamba-based models offer a promising middle ground, with their SSMs showing potential for sequential tissue pattern recognition while maintaining computational efficiency. Qualitative results from this study suggest that mamba models may exhibit better performance in segmenting varices, which are characterized by elongated and irregular anatomical structures that extend along the esophageal wall. While the specific mechanisms driving this observation are not yet fully understood, it is possible that their long-sequence modeling capabilities allow them to capture the spatial progression of varices across multiple frames or regions more effectively than other architectures. However, given the variability in performance observed among mamba variants, further quantitative validation is required to confirm whether these architectural advantages consistently translate to improved segmentation accuracy for varices or other sequential pathologies. Despite performance variability among different mamba-based models, mamba models show potential for future UGI disease segmentation by efficiently balancing local feature extraction with contextual awareness.
Real-time processing in clinical endoscopy is crucial for smooth video operation and timely decision-making during examination procedures, with systems typically operating at 30-60 FPS and advanced setups reaching 120 FPS. Segmentation models must align with these requirements, particularly for high-resolution images commonly used in practice. Lightweight models like U-Net (274.73 FPS) and ConvNeXt + UPerNet (176.99 FPS) perform well at lower resolutions but experience significant FPS drops for larger resolutions (e.g., 512 × 512), making models like FCBFormer (46.66 FPS) less suitable for resource-constrained environments. Deployment feasibility depends heavily on hardware and the clinical setting: When integrated into specialized medical equipment (e.g., ENDOANGEL® UGI Endoscope Image Auxiliary Diagnostic Equipment[73]), computational demands are managed by the equipment itself, ensuring real-time performance without burdening hospital resources. However, standalone software running on older hospital computers, which often lack advanced GPUs, requires lightweight and optimized models to ensure compatibility and usability. Edge devices such as the NVIDIA Jetson series are ideal for lightweight models at lower resolutions due to their power efficiency, while high-performance GPUs like NVIDIA A100 on hospital servers can handle larger resolutions and computationally intensive models at higher FPS. Optimizing models for edge devices through techniques such pruning, quantization, and hardware accelerators is essential to ensure real-time feasibility in clinical settings, bridging the gap between theoretical performance and practical application.
Direct comparisons with traditional medical image segmentation methods or expert annotations were not possible in this study, representing a limitation. However, benchmarks from existing literature provide context for evaluating model performance. For example, prior studies report endoscopist miss rates of 11.6% for UGI cancer detection up to 3 years before diagnosis[74], and inter-observer variability ranging from poor (κ < 0.2) to moderate (0.4 < κ < 0.6) when assessing endoscopy images[75]. These studies suggest that experienced clinicians also face challenges in detecting subtle or complex lesions, particularly under challenging imaging conditions. The models evaluated demonstrate potential to complement human expertise by improving segmentation consistency and identifying regions of interest that may otherwise be overlooked during routine endoscopy. Future directions include multi-expert annotation protocols, adaptive preprocessing pipelines to mitigate imaging artifacts, and clinical trials to validate the diagnostic improvements and workflow efficiency offered by automated segmentation systems.
Despite promising results, significant challenges persist across all evaluated architectures. Firstly, lighting variability significantly impacts segmentation performance, as observed in qualitative evaluations where overexposed regions often result in missed lesions and underexposed areas lead to incomplete boundary delineation. This could be mitigated through sophisticated preprocessing algorithms that normalize illumination across images, while exposure to diverse lighting conditions through self-supervised pre-training would improve model generalization in real clinical scenarios. Additionally, endoscopic imaging variability, including specular reflections, mucus, and inconsistent lighting, compounds these challenges, as evidenced by the failure to consistently delineate smaller or more subtle lesions like GP1 (Figure 6), GP2 (Figure 6), HardA1 (Figure 8), and HardA2 (Figure 8). To tackle the challenge of imprecise lesion boundaries, future research should develop specialized loss functions that heavily weight boundary precision while simultaneously leveraging medical anatomical knowledge to better detect subtle tissue transitions. Moreover, all models face challenges with overlapping features and ambiguous boundaries in multi-label scenarios, particularly for suspicious regions and composite lesions. While CNNs, transformers and mamba-based models have their own strengths, none consistently outperform the others, highlighting the need for improved training strategies and architectural designs, which could be improved by leveraging weighted loss functions like focal loss with class-specific weights and context-aware segmentation using attention mechanisms.
These challenges are further compounded by dataset limitations, including endoscopic imaging variability, retrospective data collection, and class imbalance. The self-collected dataset is comparatively larger than existing public multi-class disease segmentation datasets but is sourced from only two hospitals within a single region, which introduces selection bias that affects the ability of the model to generalize to broader populations and clinical settings. The dataset generalization is further reflected in its moderate GRR value of around 0.7, indicating only moderate performance when applied to other regions. Variations in patient demographics, disease prevalence, and imaging protocols further impact model robustness, emphasizing the need for multi-institutional datasets to reduce bias and improve generalization. Despite being validated through structured methodologies, including multi-expert review and independent clinical verification, medical annotations are inherently subjective due to inter-observer variability, which may penalize algorithms for clinically valid predictions that differ from the ground truth. Future research should prioritize quantifying this variability to contextualize algorithm performance more effectively. Furthermore, class imbalance, such as underrepresented disease classes like varices and GERD in the self-collected dataset and suspicious lesions in the EDD2020 dataset, exacerbates overfitting to dominant classes and reduces sensitivity for rarer pathologies. Weighted loss functions and targeted data augmentation strategies offer promising solutions to mitigate these disparities and improve model robustness.
The technical challenges in UGI disease segmentation can be addressed through several promising research directions aimed at enhancing model performance and robustness. Future work should pursue multi-modal learning approaches that integrate complementary information sources like text information for additional context and incorporate anatomical priors and landmarks for location-specific pathologies. To address data scarcity, self-supervised learning approaches could leverage the vast repositories of unlabeled endoscopic images, while spatio-temporal modeling techniques could enhance consistency in video endoscopy sequences. Aside from that, multi-task learning, which integrates classification and detection with segmentation, has the potential to enhance model accuracy. Ensuring task consistency across these tasks may further reduce misidentifications by leveraging shared information. Furthermore, adoption of advanced DL algorithms and attention mechanisms could significantly improve the capture of complex spatial relationships and contextual information, addressing the current performance limitations in UGI disease segmentation systems. Beyond technical improvements, future studies should focus on rigorous clinical validation to confirm the reliability and applicability of these models in varied clinical environments and across diverse patient populations. This involves testing the algorithms against real-world data, comparing outputs to expert interpretations, and evaluating their impact on patient outcomes. Clinical validation is a pivotal step in translating these systems from research prototypes to practical tools in routine medical care.
This study represents a clinical translational validation of automated UGI disease segmentation models, offering actionable insights for real-world deployment. Among 17 state-of-the-art models, hierarchical architectures with pre-trained encoders, such as Swin-UMamba-D, demonstrated superior performance, while SegFormer offered an optimal balance between efficiency and accuracy. These advancements offer substantial medical value by reducing missed diagnoses, improving diagnostic precision, streamlining treatment planning, and enhancing patient outcomes while alleviating physician workload. Despite these advancements, clinical translation remains limited by challenges such as lighting variability, imprecise boundary delineation, multi-label segmentation complexities, and dataset limitations. Addressing these issues through multi-modal learning, self-supervised techniques, spatio-temporal modeling, and rigorous clinical validation is essential to improve model robustness and applicability in diverse healthcare settings.
| 1. | Gore RM, Levine MS. Diseases of the Upper GI Tract. In: Diseases of the Abdomen and Pelvis 2018-2021: Diagnostic Imaging - IDKD Book [Internet]. Cham (CH): Springer; 2018. [PubMed] |
| 2. | Treuting PM, Arends MJ, Dintzis SM. Upper Gastrointestinal Tract. In: Treuting PM, Dintzis SM editors. Comparative Anatomy and Histology. Academic Press, 2012: 191-211. |
| 3. | Wang S, Zheng R, Li J, Zeng H, Li L, Chen R, Sun K, Han B, Bray F, Wei W, He J. Global, regional, and national lifetime risks of developing and dying from gastrointestinal cancers in 185 countries: a population-based systematic analysis of GLOBOCAN. Lancet Gastroenterol Hepatol. 2024;9:229-237. [RCA] [PubMed] [DOI] [Full Text] [Cited by in Crossref: 212] [Cited by in RCA: 195] [Article Influence: 97.5] [Reference Citation Analysis (0)] |
| 4. | Rose TC, Pennington A, Kypridemos C, Chen T, Subhani M, Hanefeld J, Ricciardiello L, Barr B. Analysis of the burden and economic impact of digestive diseases and investigation of research gaps and priorities in the field of digestive health in the European Region-White Book 2: Executive summary. United European Gastroenterol J. 2022;10:657-662. [RCA] [PubMed] [DOI] [Full Text] [Full Text (PDF)] [Cited by in Crossref: 1] [Cited by in RCA: 31] [Article Influence: 7.8] [Reference Citation Analysis (0)] |
| 5. | Everhart JE, Ruhl CE. Burden of digestive diseases in the United States part I: overall and upper gastrointestinal diseases. Gastroenterology. 2009;136:376-386. [RCA] [PubMed] [DOI] [Full Text] [Cited by in Crossref: 490] [Cited by in RCA: 431] [Article Influence: 25.4] [Reference Citation Analysis (6)] |
| 6. | Richter JE. The enormous burden of digestive diseases on our healthcare system. Curr Gastroenterol Rep. 2003;5:93-94. [RCA] [PubMed] [DOI] [Full Text] [Cited by in Crossref: 4] [Cited by in RCA: 5] [Article Influence: 0.2] [Reference Citation Analysis (1)] |
| 7. | Camilleri M, Dubois D, Coulie B, Jones M, Kahrilas PJ, Rentz AM, Sonnenberg A, Stanghellini V, Stewart WF, Tack J, Talley NJ, Whitehead W, Revicki DA. Prevalence and socioeconomic impact of upper gastrointestinal disorders in the United States: results of the US Upper Gastrointestinal Study. Clin Gastroenterol Hepatol. 2005;3:543-552. [RCA] [PubMed] [DOI] [Full Text] [Cited by in Crossref: 321] [Cited by in RCA: 274] [Article Influence: 13.0] [Reference Citation Analysis (0)] |
| 8. | Al-Worafi YM. Epidemiology and Burden of Digestive Diseases in Developing Countries. In: Al-worafi YM, editor. Handbook of Medical and Health Sciences in Developing Countries. Springer Cham, 2023. |
| 9. | Correa P, Piazuelo MB. The gastric precancerous cascade. J Dig Dis. 2012;13:2-9. [RCA] [PubMed] [DOI] [Full Text] [Full Text (PDF)] [Cited by in Crossref: 629] [Cited by in RCA: 609] [Article Influence: 43.5] [Reference Citation Analysis (5)] |
| 10. | Gullo I, Grillo F, Mastracci L, Vanoli A, Carneiro F, Saragoni L, Limarzi F, Ferro J, Parente P, Fassan M. Precancerous lesions of the stomach, gastric cancer and hereditary gastric cancer syndromes. Pathologica. 2020;112:166-185. [RCA] [PubMed] [DOI] [Full Text] [Cited by in Crossref: 141] [Cited by in RCA: 119] [Article Influence: 19.8] [Reference Citation Analysis (17)] |
| 11. | Morson BC, Sobin LH, Grundmann E, Johansen A, Nagayo T, Serck-Hanssen A. Precancerous conditions and epithelial dysplasia in the stomach. J Clin Pathol. 1980;33:711-721. [RCA] [PubMed] [DOI] [Full Text] [Full Text (PDF)] [Cited by in Crossref: 351] [Cited by in RCA: 305] [Article Influence: 6.6] [Reference Citation Analysis (1)] |
| 12. | Molloy RM, Sonnenberg A. Relation between gastric cancer and previous peptic ulcer disease. Gut. 1997;40:247-252. [RCA] [PubMed] [DOI] [Full Text] [Cited by in Crossref: 58] [Cited by in RCA: 66] [Article Influence: 2.3] [Reference Citation Analysis (0)] |
| 13. | Waldum H, Fossmark R. Gastritis, Gastric Polyps and Gastric Cancer. Int J Mol Sci. 2021;22:6548. [RCA] [PubMed] [DOI] [Full Text] [Full Text (PDF)] [Cited by in Crossref: 120] [Cited by in RCA: 88] [Article Influence: 17.6] [Reference Citation Analysis (3)] |
| 14. | Li X, Yu HG. [Advances in endoscopic diagnosis of early gastric cancer]. Hainan Yixueyuan Xuebao. 2019;5:392-395. [DOI] [Full Text] |
| 15. | Wu L, Xu Y. [The current state of diagnosis and missed diagnosis in endoscopy for early gastric cancer]. Linchuang Yu Bingli Zazhi. 2015;35:2180-2184. [DOI] [Full Text] |
| 16. | Januszewicz W, Witczak K, Wieszczy P, Socha M, Turkot MH, Wojciechowska U, Didkowska J, Kaminski MF, Regula J. Prevalence and risk factors of upper gastrointestinal cancers missed during endoscopy: a nationwide registry-based study. Endoscopy. 2022;54:653-660. [RCA] [PubMed] [DOI] [Full Text] [Cited by in Crossref: 56] [Cited by in RCA: 50] [Article Influence: 12.5] [Reference Citation Analysis (0)] |
| 17. | Yalamarthi S, Witherspoon P, McCole D, Auld CD. Missed diagnoses in patients with upper gastrointestinal cancers. Endoscopy. 2004;36:874-879. [RCA] [PubMed] [DOI] [Full Text] [Cited by in Crossref: 168] [Cited by in RCA: 145] [Article Influence: 6.6] [Reference Citation Analysis (1)] |
| 18. | Shimada S, Yabuuchi Y, Kawata N, Maeda Y, Yoshida M, Yamamoto Y, Minamide T, Shigeta K, Takada K, Kishida Y, Ito S, Imai K, Hotta K, Ishiwatari H, Matsubayashi H, Ono H. Endoscopic causes and characteristics of missed gastric cancers after endoscopic submucosal dissection. Gastrointest Endosc. 2023;98:735-743.e2. [RCA] [PubMed] [DOI] [Full Text] [Cited by in Crossref: 18] [Cited by in RCA: 16] [Article Influence: 5.3] [Reference Citation Analysis (1)] |
| 19. | Kerkhof M, van Dekken H, Steyerberg EW, Meijer GA, Mulder AH, de Bruïne A, Driessen A, ten Kate FJ, Kusters JG, Kuipers EJ, Siersema PD; CYBAR study group. Grading of dysplasia in Barrett's oesophagus: substantial interobserver variation between general and gastrointestinal pathologists. Histopathology. 2007;50:920-927. [RCA] [PubMed] [DOI] [Full Text] [Cited by in Crossref: 208] [Cited by in RCA: 194] [Article Influence: 10.2] [Reference Citation Analysis (2)] |
| 20. | Choi J, Shin K, Jung J, Bae HJ, Kim DH, Byeon JS, Kim N. Convolutional Neural Network Technology in Endoscopic Imaging: Artificial Intelligence for Endoscopy. Clin Endosc. 2020;53:117-126. [RCA] [PubMed] [DOI] [Full Text] [Full Text (PDF)] [Cited by in Crossref: 45] [Cited by in RCA: 39] [Article Influence: 6.5] [Reference Citation Analysis (5)] |
| 21. | Ali S, Dmitrieva M, Ghatwary N, Bano S, Polat G, Temizel A, Krenzer A, Hekalo A, Guo YB, Matuszewski B, Gridach M, Voiculescu I, Yoganand V, Chavan A, Raj A, Nguyen NT, Tran DQ, Huynh LD, Boutry N, Rezvy S, Chen H, Choi YH, Subramanian A, Balasubramanian V, Gao XW, Hu H, Liao Y, Stoyanov D, Daul C, Realdon S, Cannizzaro R, Lamarque D, Tran-Nguyen T, Bailey A, Braden B, East JE, Rittscher J. Deep learning for detection and segmentation of artefact and disease instances in gastrointestinal endoscopy. Med Image Anal. 2021;70:102002. [RCA] [PubMed] [DOI] [Full Text] [Cited by in Crossref: 140] [Cited by in RCA: 75] [Article Influence: 15.0] [Reference Citation Analysis (0)] |
| 22. | Dosovitskiy A, Beyer L, Kolesnikov A, Weissenborn D, Zhai X, Unterthiner T, Dehghani M, Minderer M, Heigold G, Gelly S, Uszkoreit J, Houlsby N. An Image is Worth 16x16 Words: Transformers for Image Recognition at Scale. Available from: arXiv:2010.11929. [DOI] [Full Text] |
| 23. | Pogorelov K, Randel KR, Griwodz C, Eskeland SL, de Lange T, Johansen D, Spampinato C, Dang-nguyen D, Lux M, Schmidt PT, Riegler M, Halvorsen P. KVASIR: A Multi-Class Image Dataset for Computer Aided Gastrointestinal Disease Detection. Proceedings of the 8th ACM on Multimedia Systems Conference; 2017 Jun 20-23; Taipei, Taiwan. New York: Association for Computing Machinery, 2017: 164-169. |
| 24. | Jha D, Smedsrud PH, Riegler MA, Halvorsen P, de Lange T, Johansen D, Johansen HD. Kvasir-SEG: A Segmented Polyp Dataset. In: Ro YM, Cheng WH, Kim J, Chu WT, Cui P, Choi JW, Hu MC, De Neve W, editors. Proceedings of the 26th International Conference on Multimedia Modeling; 2020 Jan 5-8; Daejeon, South Korea. Springer Cham. |
| 25. | Bernal J, Sánchez FJ, Fernández-Esparrach G, Gil D, Rodríguez C, Vilariño F. WM-DOVA maps for accurate polyp highlighting in colonoscopy: Validation vs. saliency maps from physicians. Comput Med Imaging Graph. 2015;43:99-111. [RCA] [PubMed] [DOI] [Full Text] [Cited by in Crossref: 1777] [Cited by in RCA: 529] [Article Influence: 48.1] [Reference Citation Analysis (4)] |
| 26. | Sanderson E, Matuszewski BJ. FCN-Transformer Feature Fusion for Polyp Segmentation. Available from: arXiv:2208.08352. [DOI] [Full Text] |
| 27. | Fan D, Ji G, Zhou T, Chen G, Fu H, Shen J, Shao L. PraNet: Parallel Reverse Attention Network for Polyp Segmentation. Available from: arXiv:2006.11392. [DOI] [Full Text] |
| 28. | Manan MA, Feng J, Yaqub M, Ahmed S, Imran SMA, Chuhan IS, Khan HA. Multi-scale and multi-path cascaded convolutional network for semantic segmentation of colorectal polyps. Alex Eng J. 2024;105:341-359. [RCA] [DOI] [Full Text] [Cited by in Crossref: 3] [Cited by in RCA: 7] [Article Influence: 3.5] [Reference Citation Analysis (0)] |
| 29. | Wang S, Cong Y, Zhu H, Chen X, Qu L, Fan H, Zhang Q, Liu M. Multi-Scale Context-Guided Deep Network for Automated Lesion Segmentation With Endoscopy Images of Gastrointestinal Tract. IEEE J Biomed Health Inform. 2021;25:514-525. [RCA] [PubMed] [DOI] [Full Text] [Cited by in Crossref: 98] [Cited by in RCA: 66] [Article Influence: 13.2] [Reference Citation Analysis (0)] |
| 30. | Grand Challenge. Sub-Challenge Detection of abnormalities in gastroscopic images. [cited September 18, 2025]. Available from: https://endovissub-abnormal.grand-challenge.org/Data/. |
| 31. | Fang YJ, Mukundan A, Tsao YM, Huang CW, Wang HC. Identification of Early Esophageal Cancer by Semantic Segmentation. J Pers Med. 2022;12:1204. [RCA] [PubMed] [DOI] [Full Text] [Full Text (PDF)] [Cited by in Crossref: 46] [Cited by in RCA: 41] [Article Influence: 10.3] [Reference Citation Analysis (1)] |
| 32. | Vietanhdev. Effortless AI-assisted data labeling with AI support from YOLO. [cited September 18, 2025]. Available from: https://github.com/vietanhdev/anylabeling. |
| 33. | Ali S, Ghatwary N, Braden B, Lamarque D, Bailey A, Realdon S, Cannizzaro R, Rittscher J, Daul C, East J. Endoscopy disease detection challenge 2020. Available from: arXiv:2003.03376. [DOI] [Full Text] |
| 34. | Pedregosa F, Varoquaux G, Gramfort A, Michel V, Thirion B, Grisel O, Blondel M, Prettenhofer P, Weiss R, Dubourg V, Vanderplas J, Passos A, Cournapeau D, Brucher M, Perrot M, Duchesnay E. Scikit-learn: Machine Learning in Python. J Mach Learn Res. 2011;12:2825-2830. |
| 35. | Deng J, Dong W, Socher R, Li LJ, Li K, Li FF. ImageNet: A large-scale hierarchical image database. 2009 IEEE Conference on Computer Vision and Pattern Recognition. 2009 Jun 20-25; Miami, FL, United States. IEEE, 2009: 248-255. |
| 36. | Ronneberger O, Fischer P, Brox T. U-Net: Convolutional Networks for Biomedical Image Segmentation. Medical Image Computing and Computer-Assisted Intervention – MICCAI 2015; 2015 Oct 5-9; Munich, Germany. Springer Cham, 2015: 234-241. |
| 37. | He K, Zhang X, Ren S, Sun J. Deep Residual Learning for Image Recognition. 2016 IEEE Conference on Computer Vision and Pattern Recognition (CVPR); 2016 Jun 27-30; Las Vegas, NV, United States. IEEE, 2016: 770-778. |
| 38. | Liu Z, Mao H, Wu C, Feichtenhofer C, Darrell T, Xie S. A ConvNet for the 2020s. 2022 IEEE/CVF Conference on Computer Vision and Pattern Recognition (CVPR); 2022 Jun 18-24; New Orleans, LA, United States. IEEE, 2022: 11966-11976. |
| 39. | Xiao T, Liu Y, Zhou B, Jiang Y, Sun J. Unified Perceptual Parsing for Scene Understanding. Available from: arXiv:1807.10221. [DOI] [Full Text] |
| 40. | Zhao X, Jia H, Pang Y, Lv L, Tian F, Zhang L, Sun W, Lu H. M2SNet: Multi-scale in Multi-scale Subtraction Network for Medical Image Segmentation. Available from: arXiv:2303.10894. [DOI] [Full Text] |
| 41. | Gao SH, Cheng MM, Zhao K, Zhang XY, Yang MH, Torr P. Res2Net: A New Multi-Scale Backbone Architecture. IEEE Trans Pattern Anal Mach Intell. 2021;43:652-662. [RCA] [PubMed] [DOI] [Full Text] [Cited by in Crossref: 811] [Cited by in RCA: 567] [Article Influence: 113.4] [Reference Citation Analysis (0)] |
| 42. | Tomar NK, Jha D, Bagci U. DilatedSegNet: A Deep Dilated Segmentation Network for Polyp Segmentation. Available from: arXiv:2210.13595. [DOI] [Full Text] |
| 43. | Liu Z, Hu H, Lin Y, Yao Z, Xie Z, Wei Y, Ning J, Cao Y, Zhang Z, Dong L, Wei F, Guo B. Swin Transformer V2: Scaling Up Capacity and Resolution. Available from: arXiv:2111.09883. [DOI] [Full Text] |
| 44. | Zheng S, Lu J, Zhao H, Zhu X, Luo Z, Wang Y, Fu Y, Feng J, Xiang T, Torr PH, Zhang L. Rethinking Semantic Segmentation from a Sequence-to-Sequence Perspective with Transformers. Available from: arXiv:2012.15840. [DOI] [Full Text] |
| 45. | Xie E, Wang W, Yu Z, Anandkumar A, Alvarez JM, Luo P. SegFormer: Simple and Efficient Design for Semantic Segmentation with Transformers. In: Ranzato M, Beygelzimer A, Dauphin Y, Liang PS, Wortman Vaughan J, editors. Advances in Neural Information Processing Systems 34. NeurIPS 2021: Proceedings of the 35th Annual Conference on Neural Information Processing Systems; 2021 Dec 6-14; Virtual. Red Hook: Curran Associates, Inc, 2021: 12077-12090. |
| 46. | Chen J, Lu Y, Yu Q, Luo X, Adeli E, Wang Y, Lu L, Yuille AL, Zhou Y. TransUNet: Transformers Make Strong Encoders for Medical Image Segmentation. Available from: arXiv:2102.04306. [DOI] [Full Text] |
| 47. | Wang W, Xie E, Li X, Fan D, Song K, Liang D, Lu T, Luo P, Shao L. PVT v2: Improved baselines with pyramid vision transformer. Comp Visual Med. 2022;8:415-424. [DOI] [Full Text] |
| 48. | Rahman MM, Munir M, Marculescu R. EMCAD: Efficient Multi-Scale Convolutional Attention Decoding for Medical Image Segmentation. 2024 IEEE/CVF Conference on Computer Vision and Pattern Recognition (CVPR); 2024 Jun 16-22; Seattle, WA, United States. IEEE, 2024: 11769-11779. |
| 49. | Liu J, Yang H, Zhou H, Xi Y, Yu L, Li C, Liang Y, Shi G, Yu Y, Zhang S, Zheng H, Wang S. Swin-UMamba: Mamba-Based UNet with ImageNet-Based Pretraining. Available from: arXiv:2402.03302. [DOI] [Full Text] |
| 50. | Ma J, Li F, Wang B. U-Mamba: Enhancing Long-range Dependency for Biomedical Image Segmentation. Available from: arXiv:2401.04722. [DOI] [Full Text] |
| 51. | Zhang M, Yu Y, Jin S, Gu L, Ling T, Tao X. VM-UNET-V2: Rethinking Vision Mamba UNet for Medical Image Segmentation. Available from: arXiv:2403.09157. [DOI] [Full Text] |
| 52. | Lin T, Dollar P, Girshick R, He K, Hariharan B, Belongie S. Feature Pyramid Networks for Object Detection. 2017 IEEE Conference on Computer Vision and Pattern Recognition (CVPR); 2017 Jul 21-26; Honolulu, HI, United States. IEEE, 2017: 936-944. |
| 53. | Zhao H, Shi J, Qi X, Wang X, Jia J. Pyramid Scene Parsing Network. Available from: arXiv:1612.01105. [DOI] [Full Text] |
| 54. | Liu Z, Lin Y, Cao Y, Hu H, Wei Y, Zhang Z, Lin S, Guo B. Swin Transformer: Hierarchical Vision Transformer using Shifted Windows. Available from: arXiv:2103.14030. [DOI] [Full Text] |
| 55. | Wang W, Xie E, Li X, Fan D, Song K, Liang D, Lu T, Luo P, Shao L. Pyramid Vision Transformer: A Versatile Backbone for Dense Prediction without Convolutions. Available from: arXiv:2102.12122. [DOI] [Full Text] |
| 56. | Gu A, Dao T. Mamba: Linear-time sequence modeling with selective state spaces. 2023 Preprint. Available from: arXiv:2312.00752. [DOI] [Full Text] |
| 57. | Bansal S, Madisetty S, Rehman MZ, Raghaw CS, Duggal G, Kumar N. A Comprehensive Survey of Mamba Architectures for Medical Image Analysis: Classification, Segmentation, Restoration and Beyond. Available from: arXiv:2410.02362. [DOI] [Full Text] |
| 58. | Heidari M, Kolahi SG, Karimijafarbigloo S, Azad B, Bozorgpour A, Hatami S, Azad R, Diba A, Bagci U, Merhof D, Hacihaliloglu I. Computation-Efficient Era: A Comprehensive Survey of State Space Models in Medical Image Analysis. Available from: arXiv:2406.03430. [DOI] [Full Text] |
| 59. | Liu Y, Tian Y, Zhao Y, Yu H, Xie L, Wang Y, Ye Q, Jiao J, Liu Y. VMamba: Visual State Space Model. Available from: arXiv:2401.10166. [DOI] [Full Text] |
| 60. | Cardoso MJ, Li W, Brown R, Ma N, Kerfoot E, Wang Y, Murray B, Myronenko A, Zhao C, Yang D, Nath V, He Y, Xu Z, Hatamizadeh A, Zhu W, Liu Y, Zheng M, Tang Y, Yang I, Zephyr M, Hashemian B, Alle S, Zalbagi Darestani M, Budd C, Modat M, Vercauteren T, Wang G, Li Y, Hu Y, Fu Y, Gorman B, Johnson H, Genereaux B, Erdal BS, Gupta Vi, Diaz-Pinto A, Dourson A, Maier-Hein L, Jaeger PF, Baumgartner M, Kalpathy-Cramer J, Flores M, Kirby J, Cooper LAD, Roth HR, Xu D, Bericat D, Floca R, Zhou SK, Shuaib H, Farahani K, Maier-Hein KH, Aylward S, Dogra P, Ourselin S, Feng A. MONAI: An open-source framework for deep learning in healthcare. Available from: arXiv:2211.02701. [DOI] [Full Text] |
| 61. | Paszke A, Gross S, Massa F, Lerer A, Bradbury J, Chanan G, Killeen T, Lin Z, Gimelshein N, Antiga L, Desmaison A, Köpf A, Yang E, DeVito Z, Raison M, Tejani A, Chilamkurthy S, Steiner B, Fang L, Bai J, Chintala S. PyTorch: An Imperative Style, High-Performance Deep Learning Library. Available from: arXiv:1912.01703. [DOI] [Full Text] |
| 62. | Pytorch. Datasets, Transforms and Models specific to Computer Vision. [cited September 19, 2025]. Available from: https://github.com/pytorch/vision. |
| 63. | Huggingface. The largest collection of PyTorch image encoders / backbones. Including train, eval, inference, export scripts, and pretrained weights. [cited September 23, 2025]. Available from: https://github.com/rwightman/pytorch-image-models. |
| 64. | Loshchilov I, Hutter F. Decoupled Weight Decay Regularization. Available from: arXiv:1711.05101. [DOI] [Full Text] |
| 65. | Loshchilov I, Hutter F. SGDR: Stochastic Gradient Descent with Warm Restarts. Available from: arXiv: 1608.03983. [DOI] [Full Text] |
| 66. | facebookresearch. Collection of common code that's shared among different research projects in FAIR computer vision team. [cited September 19, 2025]. Available from: https://github.com/facebookresearch/fvcore. |
| 67. | Virtanen P, Gommers R, Oliphant TE, Haberland M, Reddy T, Cournapeau D, Burovski E, Peterson P, Weckesser W, Bright J, van der Walt SJ, Brett M, Wilson J, Millman KJ, Mayorov N, Nelson ARJ, Jones E, Kern R, Larson E, Carey CJ, Polat İ, Feng Y, Moore EW, VanderPlas J, Laxalde D, Perktold J, Cimrman R, Henriksen I, Quintero EA, Harris CR, Archibald AM, Ribeiro AH, Pedregosa F, van Mulbregt P; SciPy 1. 0 Contributors. SciPy 1.0: fundamental algorithms for scientific computing in Python. Nat Methods. 2020;17:261-272. [RCA] [PubMed] [DOI] [Full Text] [Full Text (PDF)] [Cited by in Crossref: 17028] [Cited by in RCA: 11754] [Article Influence: 1959.0] [Reference Citation Analysis (14)] |
| 68. | Seabold S, Perktold J. Statsmodels: Econometric and Modeling with Python. Proceedings of the 9th Python in Science Conference; 2010 Jun 28-Jul 3; Austin, TX, United States. SciPy Proceedings, 2010: 57-61. |
| 69. | Academic Success Center. Partial Eta Squared. [cited September 19, 2025]. Available from: https://resources.nu.edu/statsresources/eta. |
| 70. | Cohen J. Statistical Power Analysis for the Behavioral Sciences. 2nd ed. New York: Routledge, 1988: 19-74. |
| 71. | Jin Z, Gan T, Wang P, Fu Z, Zhang C, Yan Q, Zheng X, Liang X, Ye X. Deep learning for gastroscopic images: computer-aided techniques for clinicians. Biomed Eng Online. 2022;21:12. [RCA] [PubMed] [DOI] [Full Text] [Full Text (PDF)] [Cited by in Crossref: 15] [Cited by in RCA: 18] [Article Influence: 4.5] [Reference Citation Analysis (0)] |
| 72. | OLYMPUS. Gastroscopes. [cited September 19, 2025]. Available from: https://www.olympus.co.uk/medical/en/Products-and-solutions/Products/Gastroenterology/Gastroscopes.html. |
| 73. | ENDOANGEL. ENDOANGEL® Upper Gastrointestinal Endoscope Image Auxiliary Diagnostic Equipment. [cited September 19, 2025]. Available from: http://en.endoangel.cn/product/5.html. |
| 74. | Menon S, Trudgill N. How commonly is upper gastrointestinal cancer missed at endoscopy? A meta-analysis. Endosc Int Open. 2014;2:E46-E50. [RCA] [PubMed] [DOI] [Full Text] [Full Text (PDF)] [Cited by in Crossref: 286] [Cited by in RCA: 250] [Article Influence: 20.8] [Reference Citation Analysis (6)] |
| 75. | Asfeldt AM, Straume B, Paulssen EJ. Impact of observer variability on the usefulness of endoscopic images for the documentation of upper gastrointestinal endoscopy. Scand J Gastroenterol. 2007;42:1106-1112. [RCA] [PubMed] [DOI] [Full Text] [Cited by in Crossref: 16] [Cited by in RCA: 15] [Article Influence: 0.8] [Reference Citation Analysis (1)] |
Open Access: This article is an open-access article that was selected by an in-house editor and fully peer-reviewed by external reviewers. It is distributed in accordance with the Creative Commons Attribution NonCommercial (CC BY-NC 4.0) license, which permits others to distribute, remix, adapt, build upon this work non-commercially, and license their derivative works on different terms, provided the original work is properly cited and the use is non-commercial. See: https://creativecommons.org/Licenses/by-nc/4.0/