INTRODUCTION
T-STAR, a recently cloned member of STAR gene family, is highly expressed in testis, muscle, and brain and contains a STAR domain, an RNA-binding domain present in a growing family of proteins involved in developmental processes[1-3]. The protein can bind to a variety of signal-transducing proteins and may act as an adaptor in signal-transduction pathways. T-STAR was identified as a protein interacting with the protein RNA-binding motif (RBM) in spermatogenesis. Down-regulation of T-STAR expression was found in SV40-transformed immortal fibroblasts, and this protein may interact with telomerase[4]. In most progressive phase malignant tumor tissues and cancer cell lines, the telomerase activity maintained at a high level, whereas, at a lower or undetectable level in normal cells. The activation of telomerase is involved in tumorigenesis and progression[5-8]. In this study, we transfected the sense or antisense T-STAR gene into human colon cancer cell line HCT-116 to overexpress or inhibit T-STAR protein, and to further observe whether T-STAR gene participates in the regulation of telomerase activity in HCT-116 cells.
MATERIALS AND METHODS
Materials
The eukaryotic expression plasmid, pcDNA3.1 was purchased from Invitrogen. Human T-STAR full length cDNA was a gift by Dr. Chew of Leicester University. The full length cDNA of T-STAR was inserted into pcDNA3.1 vector at EcoRI site in a sense orientation to generate a recombinant sense expression plasmid, pcDNA-STAR. The fragment of T-STAR cDNA digested by ApaI restriction enzyme was ligated in the ApaI site of pcDNA3.1 in an antisense orientation to construct a recombinant antisense plasmid, pcDNA-asSTAR. Human colon cancer cell line HCT-116 was provided by Department of Abdominal Surgery of Southwest Hospital, Chongqing. The transfection reagent of Lipofectamine2000 was purchased from Invitrogen. RPMI1640, fetal calf serum, and other reagents for cell culture were purchased from Hyclone. Monoclonal antibody against T-STAR, mAbT was purchased from Santa Cruz Biotech. Rabbit antigoat IgG polyclonal antibodies HRP-conjugated were purchased from Beijing Zhongshan Biotech (China). RNA PCR reagent kit was from Dalianbo Biotech. Telomerase PCR ELISA reagent kit was from Roche.
Methods
Human colon cancer cell line HCT-116 cells were maintained in RPMI1640 medium, supplemented with 10% heat-inactivated fetal calf serum, 100 U/mL of penicillin and 100 μg/mL of streptomycin and were grown at 37°C, in a humidified incubator containing 5 mL/L CO2. Transfection was performed according to the LipofectAMINE2000 method (Invitrogen) using 2 µg of each plasmid DNA (empty vector pcDNA3.1 as control, antisense plasmid pcDNA-asSTAR and sense plasmid pcDNA-STAR as experimental group). Briefly, adherent cells were seeded in six-well plates (5 × 10⁵ cells per well) grown overnight to 50%-60% confluency and were washed three times with phosphate-buffered saline, and medium was replaced with 500 µL of OPTI-MEM medium before a mixture of LipofectAMINE and DNA was added to the well for 8 h. And then the medium containing transfection mixture was replaced with 2 mL fresh RPMI1640. After 24 h of transfection, the cells were selected in RPMI1640 supplemented with 500 μg/mL G418 (Geneticin, GIBCO) for 10 d. Furthermore, the cells of selected single colonies were grown in same medium with 200 μg/mL G418 for another two weeks. Total RNA was extracted from each group of transfected cells using TRIzol reagent (Invitrogen Life Technologies). Concentration and purity were confirmed by spectrophotometry and electrophoresis on the denaturing formaldehyde-agarose gel. Reverse transcription reactions were performed on 5 μg of the isolated total RNA using the ProSTAR RT-PCR kit (Stratagene, La Jolla, CA). The following specific primers were used for PCR assay, for human T-STAR gene: P1-5’CAGGATGGGACATGCTTTG3’, P2-5’ TCTGTAGACGCCCTTTGCT3’, for inner control β-actin: P1-5’GTGGGC CGCTCTAGGCACCAA3’, P2-5’CTCTTTGATGTCACGCACGATTTC3’. All PCR reactions were incubated at 95°C for 5 min, and then cycled at 95°C for 45 s, 48°C for 30 s and 72°C for 1 min for 35 cycles and, finally, at 72°C for 10 min for extension. The PCR products were electrophoresed on 10 g/L agarose gel to calculate the amount of T-STAR mRNA expression. The densities of target DNA bands of each group on the electrophoresis were analysed by software of Quantity One, and was normalized to inner control β-actin. The relative quantities are given as mean ± SD. The experiment was done in triplicates. Total cellular proteins were isolated from each group of transfected cells. Briefly, 90% confluency live cells were washed twice with 10 mmol/L PBS, and then were completely lysed with 200 μL 1 × SDS loading buffer. The lysate was transferred to a new 1.5 mL eppendorf tube, and heated to 100°C for 10 min. Then cellular genomic DNA was broken by sonication. About 10 μL protease inhibitor of PMSF per mL extract was mixed together. Protein concentration was determined according to Bradford, and samples were stored at -20°C. For western blot analysis, 40 μg total cellular proteins were separated on a 4%-15% sodium dodecyl sulfate-polyacrylamide gel. After electrotransfer to nitrocellulose membranes (BioRad), uniformity of loading and transfer was confirmed by Poncea staining. The membranes were blocked overnight in TS complete (20 mol/L Tris-HCl, 150 mol/L NaCl, 5% non-fat dry milk, and 0.1% Tween 20) at 4°C. Blots were incubated for 1 h at room temperature with T-STAR mAb (Santa Cruz Biotech.) antibodies. Blots were washed and then incubated with horseradish peroxidase-conjugated secondary antibody (1:2000) (Sigma, St. Louis, MO) at room temperature for 2 h. The immune complexes were detected by the automated image documentation systems and bands density was analyzed by Quantity One software. The telomerase activity was measured with PCR ELISA kit[9].
Statistical analysis
Data are expressed as mean ± SD. Differences between experimental groups were assessed for significance by using the two-tailed unpaired Student’s t test. A P value of < 0.05 was considered to be statistically significant.
RESULTS
Cellular T-STAR mRNA expression level
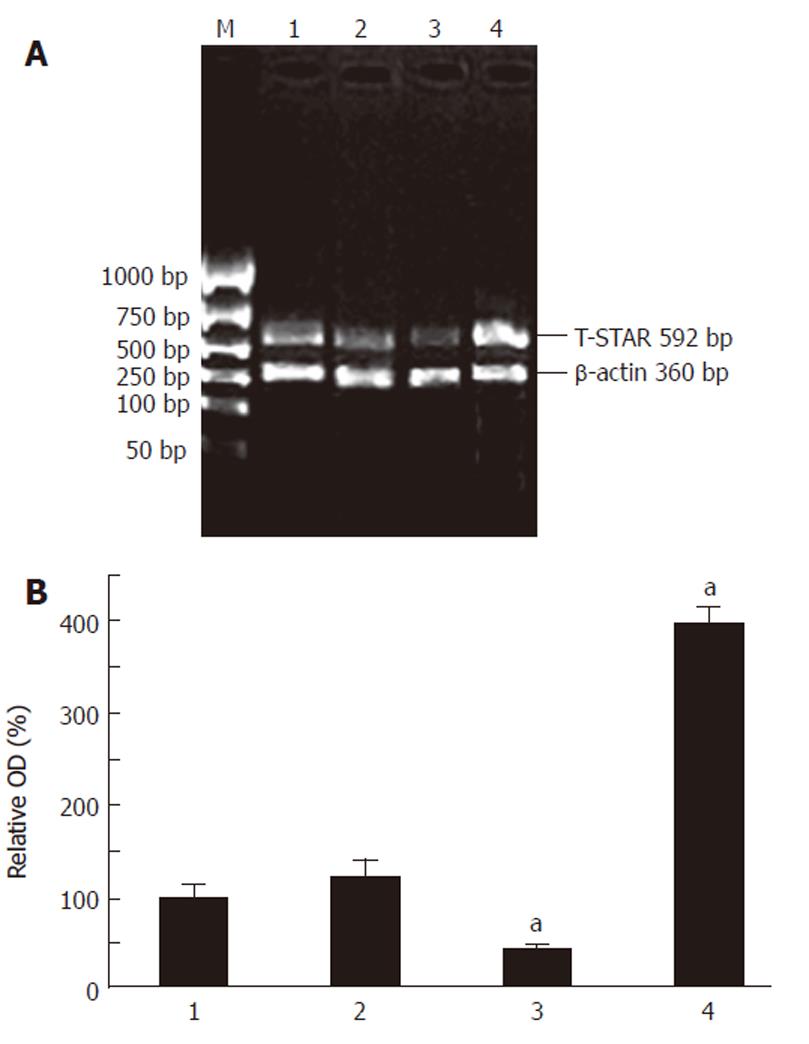
Three clear bands were present at 5S, 18S and 28S on the electrophoresis of total RNA of each group of cells. The brightness of the band at 28S was about 2-fold compared with that at 18S. There was no significant degradation with the mRNA, which could be applied in further experiments (data not shown). Both cDNA of T-STAR gene and β-actin gene simultaneously being reverse transcribed from the mRNA were electrophoresed on an agarose gel (Figure 1A). The semi-quantitative analysis was applied to the bands of T-STAR cDNA (Figure 1B). Compared with the average expression level of HCT-pcDNA transfected control cell group, T-STAR mRNA expression was increased to 296% in HCT-STAR group (P < 0.01), decreased to 59% in HCT-asSTAR group (P < 0.01), and remained slightly changed in HCT-116 group (P < 0.01).
Figure 1 A: The quantitation of T-STAR gene cDNA by RT-PCR from mRNA on electrophoresis of agarose gel; B: The relative expression levels of T-STAR mRNA of each group on electrophoresis of agarose gel, aP < 0.
01 vs 2. M: Marker; 1: HCT; 2: HCT-pcDNA; 3: HCT-asSTAR; 4: HCT-STAR.
T-STAR protein expression level
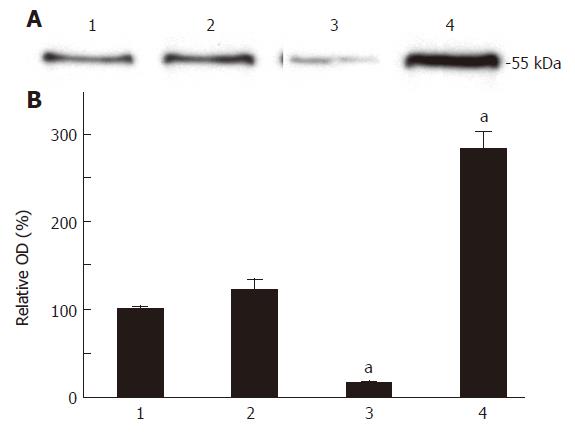
The T-STAR protein could be specifically detected at the molecular weight Mr55 on the immuno-blots in all the HCT-116 cell groups transfected with different constructs (Figure 2A). The T-STAR protein amount was enhanced in HCT-STAR group, reduced in HCT-asSTAR group, and not significantly changed in HCT-116 group in contrast to HCT-pcDNA group. Densitometry analysis showed that the T-STAR protein expression was increased about 180.8% in HCT-STAR cells (P < 0.01), decreased about 83.80% in HCT-asSTAR cells (P < 0.01) compared with HCT-pcDNA cells (Figure 2B).
Figure 2 A: Western blot analysis of the T-STAR protein expression level of each group of cells; B: Densitometry analysis of the amount of T-STAR protein expression in each group of cells, aP < 0.
01 vs 2. 1: HCT; 2: HCT-pcDNA; 3: HCT-asSTAR; 4: HCT-STAR.
Telomerase activity
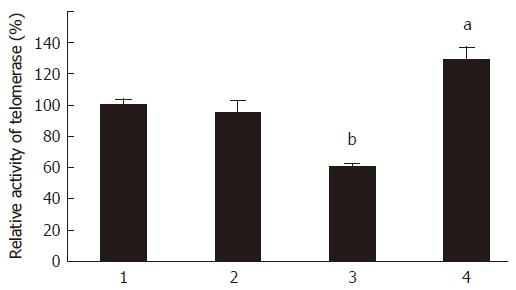
No significant changes of cellular telomerase activity were observed between HCT-116 cell group and HCT-pcDNA transfected cell group (Figure 3). Interestingly, the telomerase activities were significantly decreased in HCT-asSTAR group (P < 0.01), in which the expression of T-STAR gene was inhibited; whereas, the telomerase activities were significantly increased in the HCT-STAR group (P < 0.05) with up-regulation of T-STAR gene expression.
Figure 3 Quantitation analysis of telomerase activity of each HCT cell groups, aP < 0.
05 vs 2, bP < 0.01 vs 2. 1: HCT; 2: HCT-pcDNA; 3: HCT-asSTAR; 4: HCT-STAR.
DISCUSSION
T-STAR is a 55 kDa protein, one of three members of the SAM68 family of RNA-binding proteins with proline and tyrosine-rich regions that have been shown to be involved in various gene expression pathways including the developmental processes and/or extracellular signals to control the cellular fate of mRNA[10,11]. T-STAR gene is localized to chromosome 8q24.3, and the full length cDNA ranged in size from 1.2 kb to 1.9 kb. T-STAR is highly expressed in testis, muscle, and brain[10]. The STAR proteins have multiple functions in pre-mRNA splicing, signalling and cell cycle control. T-STAR generally acts as a growth suppressor, which is down-regulated upon immortalization of many cell lines[9-11]. Our previous study found that T-STAR may interact with hTERT, participating in processes of cell growth and proliferation. In this study, we successfully established stable colon cancer cell lines in which T-STAR gene was specially up-regulated or down-regulated both at protein and mRNA levels in HCT-STAR cells or HCT-asSTAR cells. Meanwhile, the changes of telomerase activities had a parallel fashion with the expression level of T-STAR in those two cell lines, which was enhanced in HCT-STAR and reduced in HCT-asSTAR. Similar results have been found in our previous study in other tumor tissues or cell lines (unpublished data). The current data further demonstrated that the expression of T-STAR is positively correlated with hTERT and telomerase activity. In other words, it is possible that up-regulation of T-STAR may lead to hTERT and telomerase activity increase in tumor cells, and vice versa.
Telomeres are thought to play a critical role in cellular immortalization and carcinogenesis[12]. Our study on different pathologic types of tumor tissues found that T-STAR mainly expressed in adenoma cells. T-STAR may also be involved in cellular immortalization which is one of the basic characteristics of tumor cells[2,4,13]. Kool et al[4] have found that T-STAR is down-regulated in SV40-transformed immortalized fibroblasts (VH10/SV) compared with the corresponding nonimmortal SV40-transformed cells. In normal cells, T-STAR expression is clearly present and comparable with expression levels in SV40-transformed precrisis cells. No changes are observed in T-STAR expression as cells progress toward senescence. The down-regulation in the immortalized cells was not restricted to VH10/SV, but was also observed in other fibroblast cell lines transformed by SV40 large T[5,14]. Interestingly, the common feature of the SV40-transformed cell lines showing down-regulation of T-STAR is that they displayed a distinct proliferative crisis before immortal clones arose. In contrast, both immortal cell lines that do not show abrogation of T-STAR expression, arose without a clear crisis. These data suggest that loss of T-STAR expression might be a prerequisite to escape from crisis. If immortalization occurs in earlier stages after SV40 transformation, these immortal cells will gradually overgrow the population before crisis and apparently do not need the downregulation of T-STAR. This could indicate that T-STAR plays a role during crisis, and that immortalization cannot occur unless T-STAR expression is down-regulated. T-STAR is likely one of important components in proliferative crisis or immortalization pathway[15,16]. So far, there is rarely experimental data to investigate the T-STAR expression in cell lines characterized with high telomerase activity and that immortalization has already been completed. Recent observation has shown that the mature male germ cells, as one kind of immortalized cells, with high telomerase activities also maintained abounding T-STAR protein[2], which is consistent with our results. That is T-STAR expression might be positively correlated with telomerase activity in some kinds of immortalized cells, and T-STAR might be one component in the systems of telomerase activity regulation. Although the exact mechanism of this is unclear yet, from the analysis of T-STAR known functions, it can be speculated that T-STAR might play a role in phosphorylation and pre-mRNA splicing of hTERT.
Telomerase consists of an RNA component, telo-merase RNA (TER), which includes the template for synthesis of telomere DNA, and a protein catalytic component, the telomerase reverse transcriptase (TERT), which mediates RNA template-dependent synthesis of telomere DNA. The phosphorylation[17,18] by PKC, AKT and PTK or dephosphorylation by PP2A for hTERT, the key component of the telomerase complex, can modulate telomerase activity[19-21]. The interaction of hTERT with c-Ab1 tyrosine kinase binding domain SH3 may result in phosphorylation and inhibit telomerase activity in vitro or in vivo[21-23]. Tyrosine phosphorylation of Sam68, the homologues of T-STAR and as an adaptor protein in signal transduction, promotes its interaction with SH2 containing proteins. The association of Sam68 with SH3 domain-containing proteins, and its tyrosine phosphorylation may negatively regulate its RNA binding activity[24,25]. T-STAR can form hetero-multimers[4,9,13] with Sam68 to inhibit the interaction of Sam68 with its target protein. So T-STAR might interfere with Sam68 binding with Ab1 SH3 by reverse phosphorylation, and lead to impairment of Ab1 SH3 function of increasing telomerase activity. Another possible mechanism is that T-STAR may take part in the splicing of hTERT pre-mRNA. Different length of hTERT transcripts by alternative-splicing sites exists in cells[26-28], but only the full length transcripts for hTERT is functional, which is associated with telomerase activity. The selective-splicing for hTERT may be one of the modes that regulate telomerase activity. The 3’-UTR of T-STAR is the binding site for target mRNA[29]. T-STAR may play a role in processing of target pre-mRNA and selection of splicing sites[30], and also interact with the protein involved in the selective splicing[30,31]. We assume that T-STAR might control pre-mRNA splicing for hTERT. The enhancement of full length transcripts for hTERT may up-regulate telomerase activity. However, the exact mechanism needs to be further investigated.


