Copyright
©The Author(s) 2003.
World J Gastroenterol. Jun 15, 2003; 9(6): 1327-1332
Published online Jun 15, 2003. doi: 10.3748/wjg.v9.i6.1327
Published online Jun 15, 2003. doi: 10.3748/wjg.v9.i6.1327
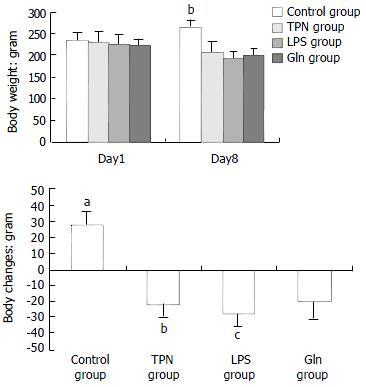
Figure 1 Graphs of body weight changes.
(a) Graphs of body weights of animals at the start and end of the experiment; Day 1 means the date when experiments started; Day 8 means the date when experiments ended; bP < 0.001, vs control group, TPN group, and Gln group; (b) The illustration of body weight increase or decrease at the endpoint of the experiment;aP < 0.001, vs TPN group, LPS group and Gln group; bP < 0.02, vs LPS group; cP < 0.03, vs Gln group.
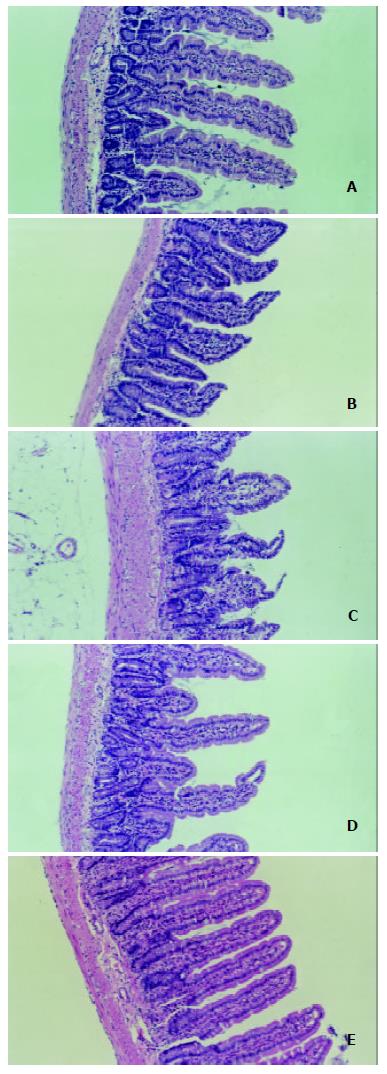
Figure 2 Alterations of structure in mucous membrane of small intestine under microscope.
A. The normal structure of jejunum mucosa in normal group rats; B. The normal structure of ileal mucosa in normal group rats; C. Slice of the structure of ileal mucosa in TPN group. The section shows an evident damage in mucosal architecture. The villi become shorter, blunted and swollen. Infiltration of leukocytes occurs within the lamina propria. The lymphatic ducts in lamina propria reveal dilatation and edematous; D. Slice of the jejunal mucosa of LPS group. The villi are more sparse and shorter than control group. It also shows infiltration of leukocytes within lamina propria, and dilatation of lymphatic ducts in lamina propria; E. The section of ileum mucosa of Gln group. The morphology of ileal mucosa is similar to that of control group (B).
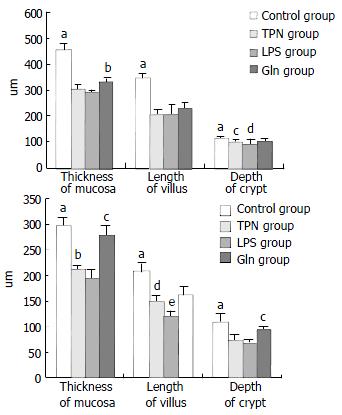
Figure 3 Graphs of morphometry of small intestinal mucosa.
(a) Morphometry of jejunal mucous membrane; aP < 0.01, vs TPN group, LPS group and Gln group; bP < 0.01, vs TPN group and LPS group; cP < 0.02, vs LPS group; dP < 0.04, vs Gln group; (b) Morphometry of ileal mucous membrane; aP< 0.004, vs TPN group, LPS group and Gln group; bP < 0.005, vs LPS group; cP < 0.02, vs Gln group; dP < 0.02, vs Gln group; eP < 0.001, vs TPN group and Gln group.
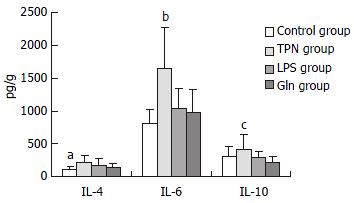
Figure 4 Graph of interleukins in mucous membrane of small intestine.
aP < 0.02, vs TPN group;bP < 0.001, vs Control group, LPS group, Gln group; cP < 0.01, vs Gln group.
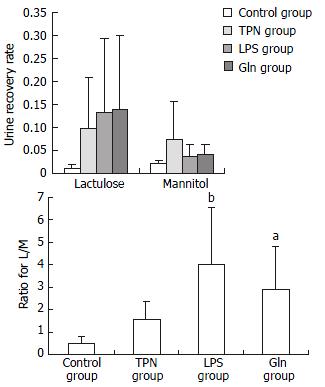
Figure 5 Illustration of dual sugar test.
(a) Recovery rate of urine for lactulose and mannitol; (b) Graphic of intestinal permeability expressed by L/M ratio. aP < 0.003, vs control group; bP < 0.001, vs control groups and TPN groups.
- Citation: Ding LA, Li JS. Effects of glutamine on intestinal permeability and bacterial translocation in TPN-rats with endotoxemia. World J Gastroenterol 2003; 9(6): 1327-1332
- URL: https://www.wjgnet.com/1007-9327/full/v9/i6/1327.htm
- DOI: https://dx.doi.org/10.3748/wjg.v9.i6.1327


