©The Author(s) 2001.
World J Gastroenterol. Apr 15, 2001; 7(2): 275-280
Published online Apr 15, 2001. doi: 10.3748/wjg.v7.i2.275
Published online Apr 15, 2001. doi: 10.3748/wjg.v7.i2.275
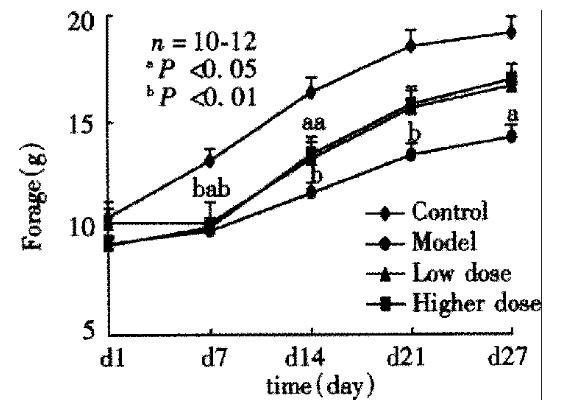
Figure 1 Daily food intake of rats in four groups.
Rats of blank control group were fed with common forage. Rats of other three groups were fed with model forage. ErBao and saline were administered (ig) from the d 8 to d 28. Data are presented as the meanÀSE form 12 rats. aStatistically significant difference from control, P < 0.05, bP < 0. 01. At d 7, food intake of model control group, low dose group, and high dose group all was significantly lower than blank control group (t = 3.76, P < 0.01; t = 2.58,P < 0.05; t = 2.83, P < 0.01, respectively). At d 14 food intake of the model control group, low dose group, and high dose group was still lower than blank control group (t = 4.76, P < 0.01; t = 2.53, P < 0.05; t = 2.38, P < 0.05, respectively). At d 21, only model control group was lower than blank control group (t = 4.71, P < 0.01). At d 27, still only model control group was lower than blank control group (t = 2.33, P < 0.05).
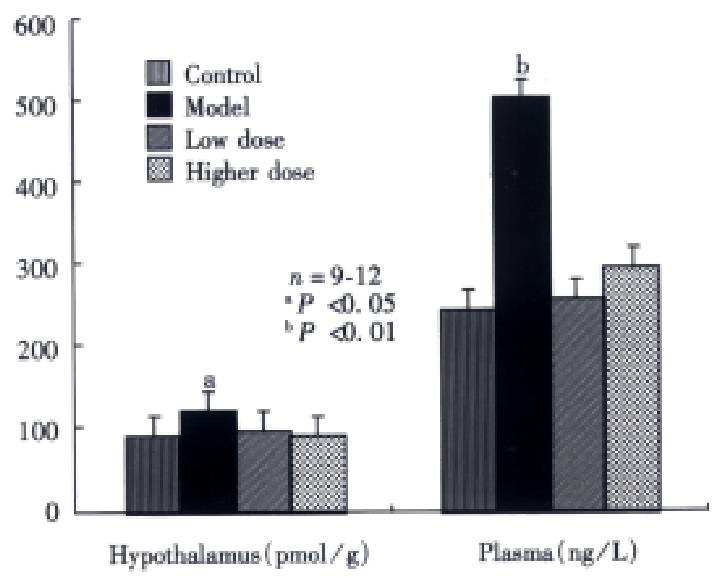
Figure 2 CCK-8 level in the four groups.
Data are presented as the mean ± SE from 12 rats. aStatistically significant difference from control, t = 2.55, P < 0.05; bt = 5.81, P < 0.01.
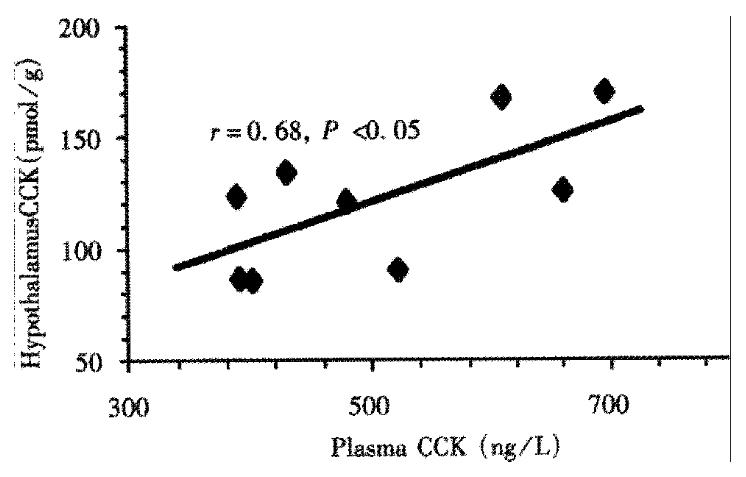
Figure 3 Correlation between hypothalamus CCK-8 and plasma CCK-8 level in model control group.
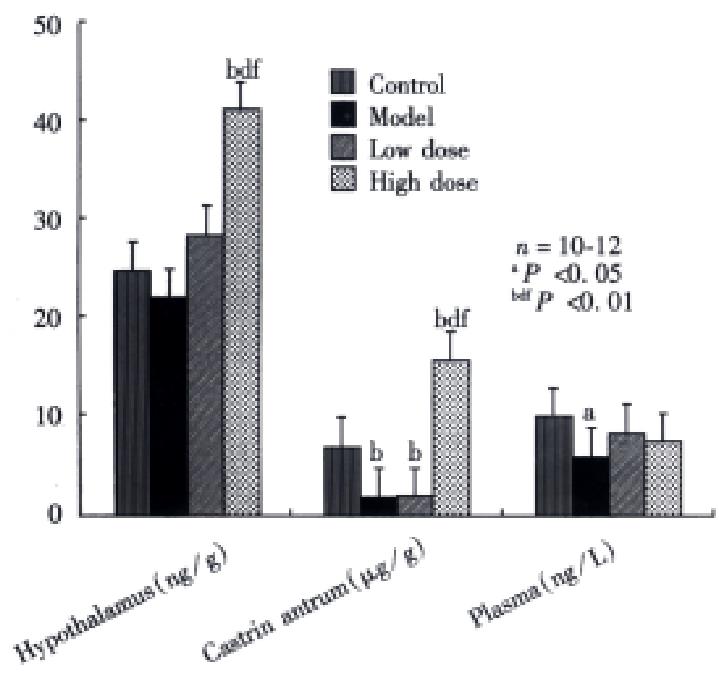
Figure 4 β-EP level between groups.
Data are presented as the mean ± SE from 9-10 rats. aStatistically significant difference from blank control, bP < 0.05, dP < 0.01; from model control, fP < 0.01; from low dose, P < 0.01. In hypothalamus, β- EP level in the high dose group was higher than in the blank control group (t = 4.79, P< 0.01), model control group (t = 4. 82, P < 0.01), and low dose group (t = 3.55, P<0.01). In gastric antrum, β-EP levels of model control group and low dose group were lower than in the blank control group (t = 9.05, P < 0.01; t = 10.79, P < 0.01), but β-EP level of high dose group increased more significantly than blank control group (t = 7. 75, P < 0.01), model control group (t = 11.34, P < 0.01), and low dose group (t = 12.76, P < 0.01). In plasma, β-EP level of model control group was lower than in the blank control group (t = 1.79, P < 0.05).
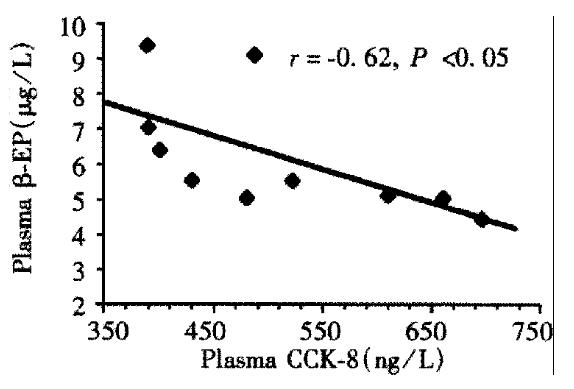
Figure 5 Correlation between plasma CCK-8 and plasma β-EP level in model control group.
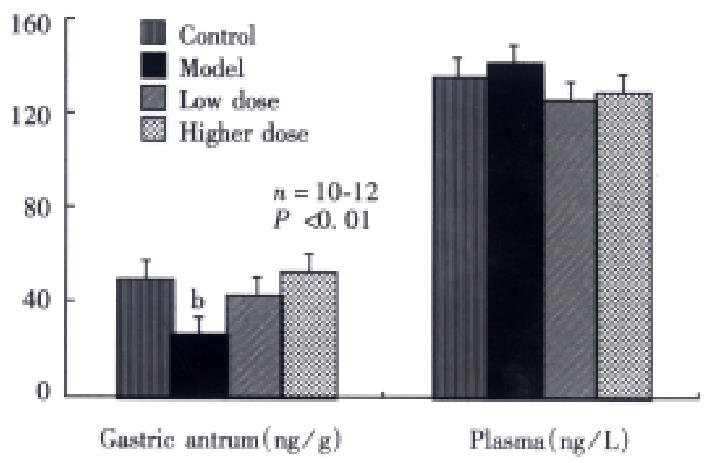
Figure 6 Gastrin level in four groups.
Data are presented as the mean ± SE from 10-12 rats.bStatistically significant difference from blank control, t = 2.53, P < 0.01.
- Citation: Du YP, Zhang YP, Wang SC, Shi J, Wu SH. Function and regulation of cholecystokinin octapeptide, β-endorp hin and gastrin in anorexic infantile rats treated with ErBao Granules. World J Gastroenterol 2001; 7(2): 275-280
- URL: https://www.wjgnet.com/1007-9327/full/v7/i2/275.htm
- DOI: https://dx.doi.org/10.3748/wjg.v7.i2.275


