
















Copyright: ©Author(s) 2026.
World J Gastroenterol. Dec 28, 2026; 32(48): 122612
Published online Dec 28, 2026. doi: 10.3748/wjg.122612
Published online Dec 28, 2026. doi: 10.3748/wjg.122612
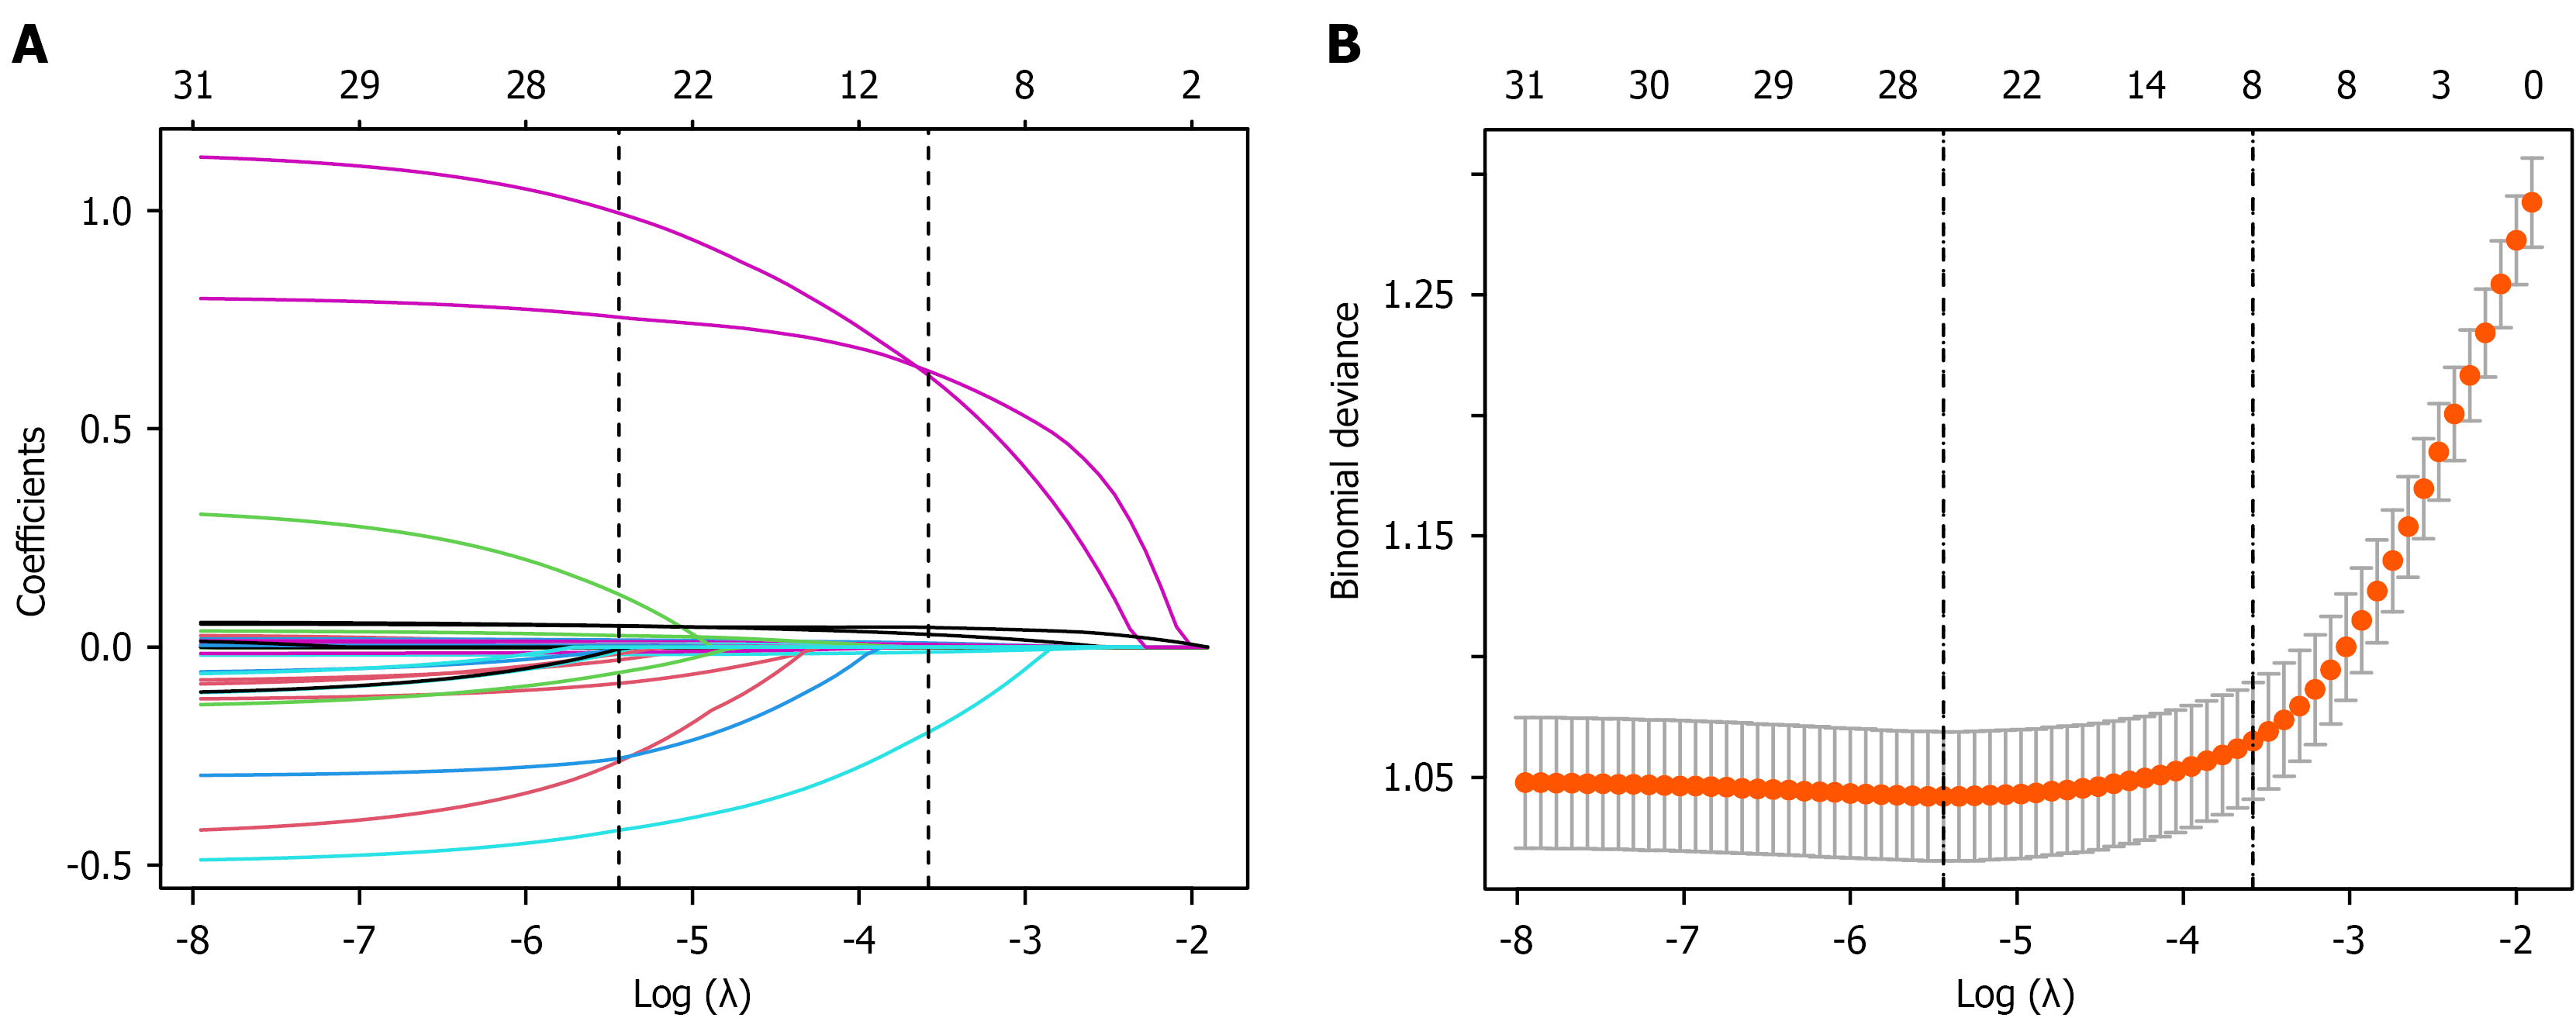
Figure 1 Predictor selection using the least absolute shrinkage and selection operator regression method.
A: Coefficient profile plot showing the trajectories of predictor coefficients across the log (λ) sequence. The dotted vertical lines indicate the optimal λ values selected according to the minimum criterion and the one-standard-error (1-SE) criterion. Predictors included in the final model were selected based on the 1-SE criterion; B: Ten-fold cross-validation plot used to determine the optimal tuning parameter (λ) in the least absolute shrinkage and selection operator model. The dotted vertical lines represent the λ values corresponding to the minimum criterion and the 1-SE criterion.
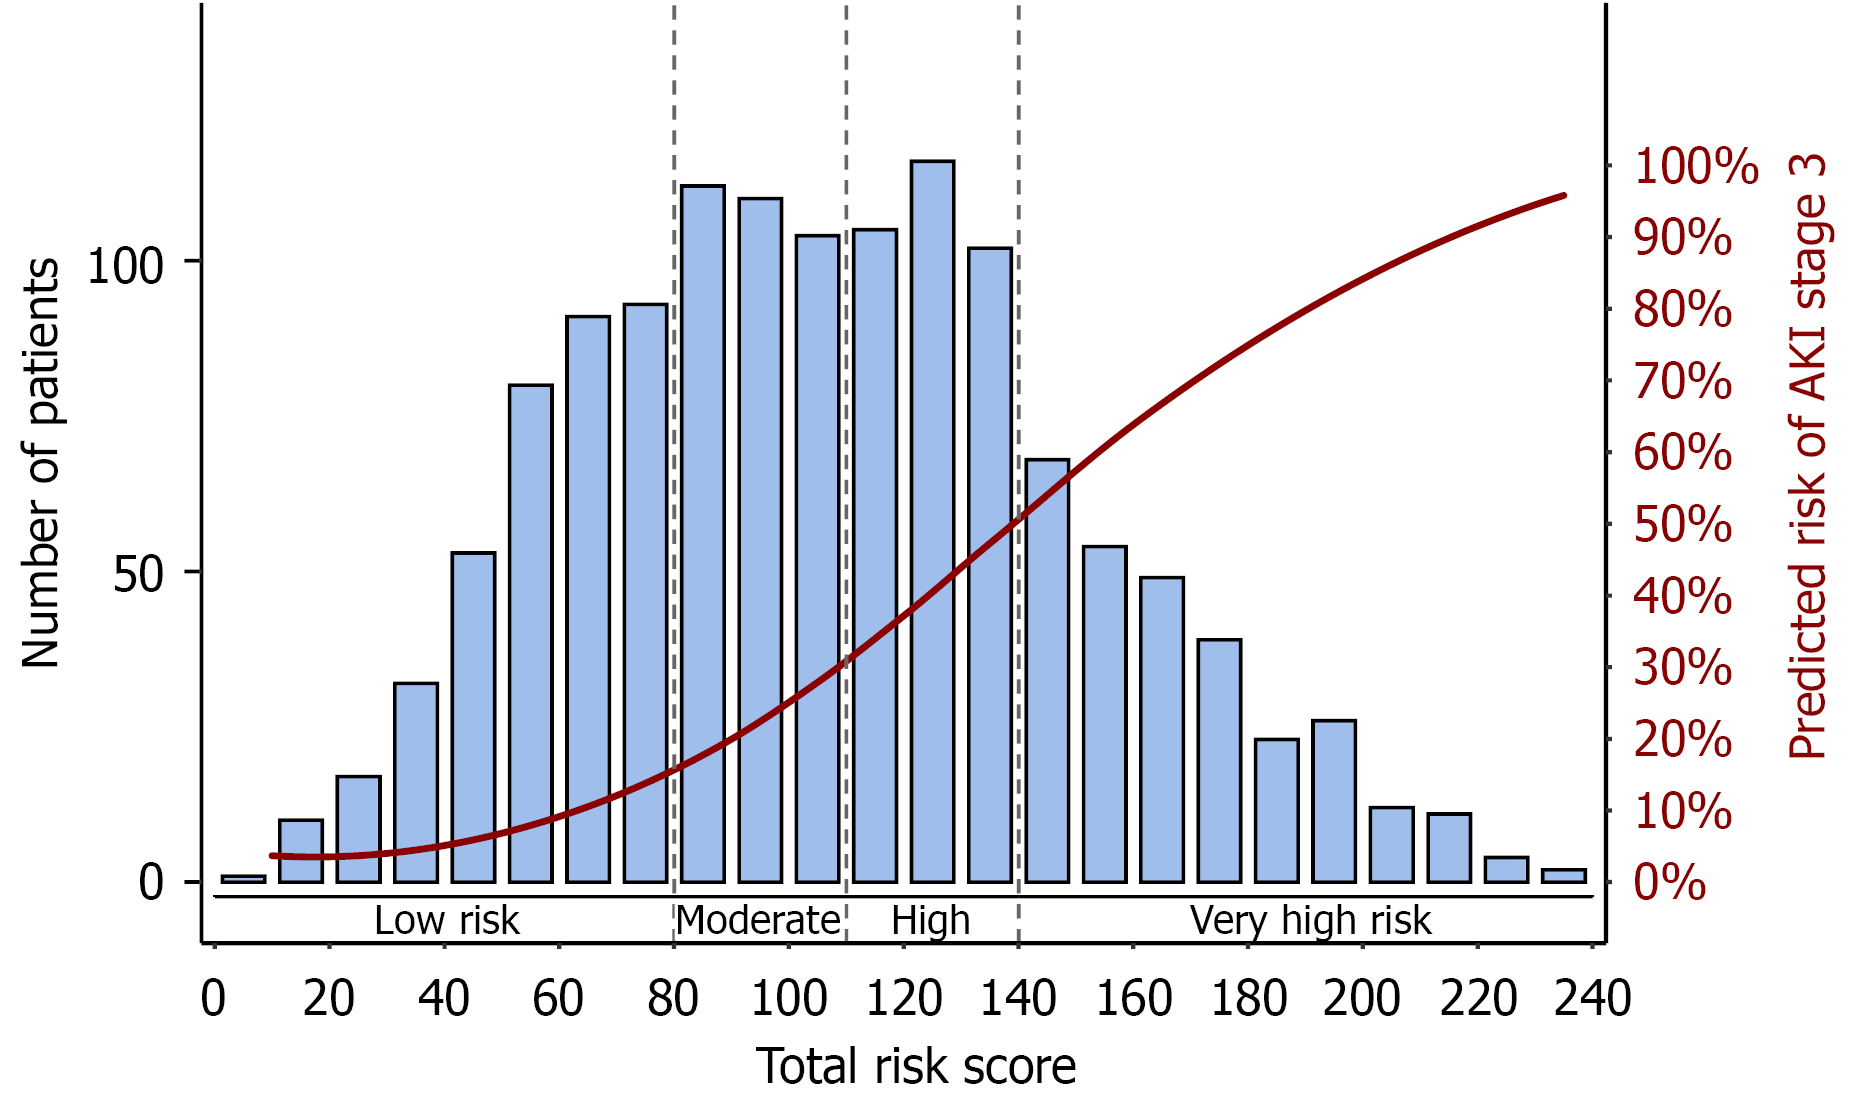
Figure 2 Distribution of chronic liver failure organ failure-acute kidney injury risk scores and predicted risk of the primary outcome in the derivation cohort.
Bar heights represent the number of patients at each total risk-score value (left y-axis), whereas the solid line denotes the predicted probability of the primary outcome (right y-axis).
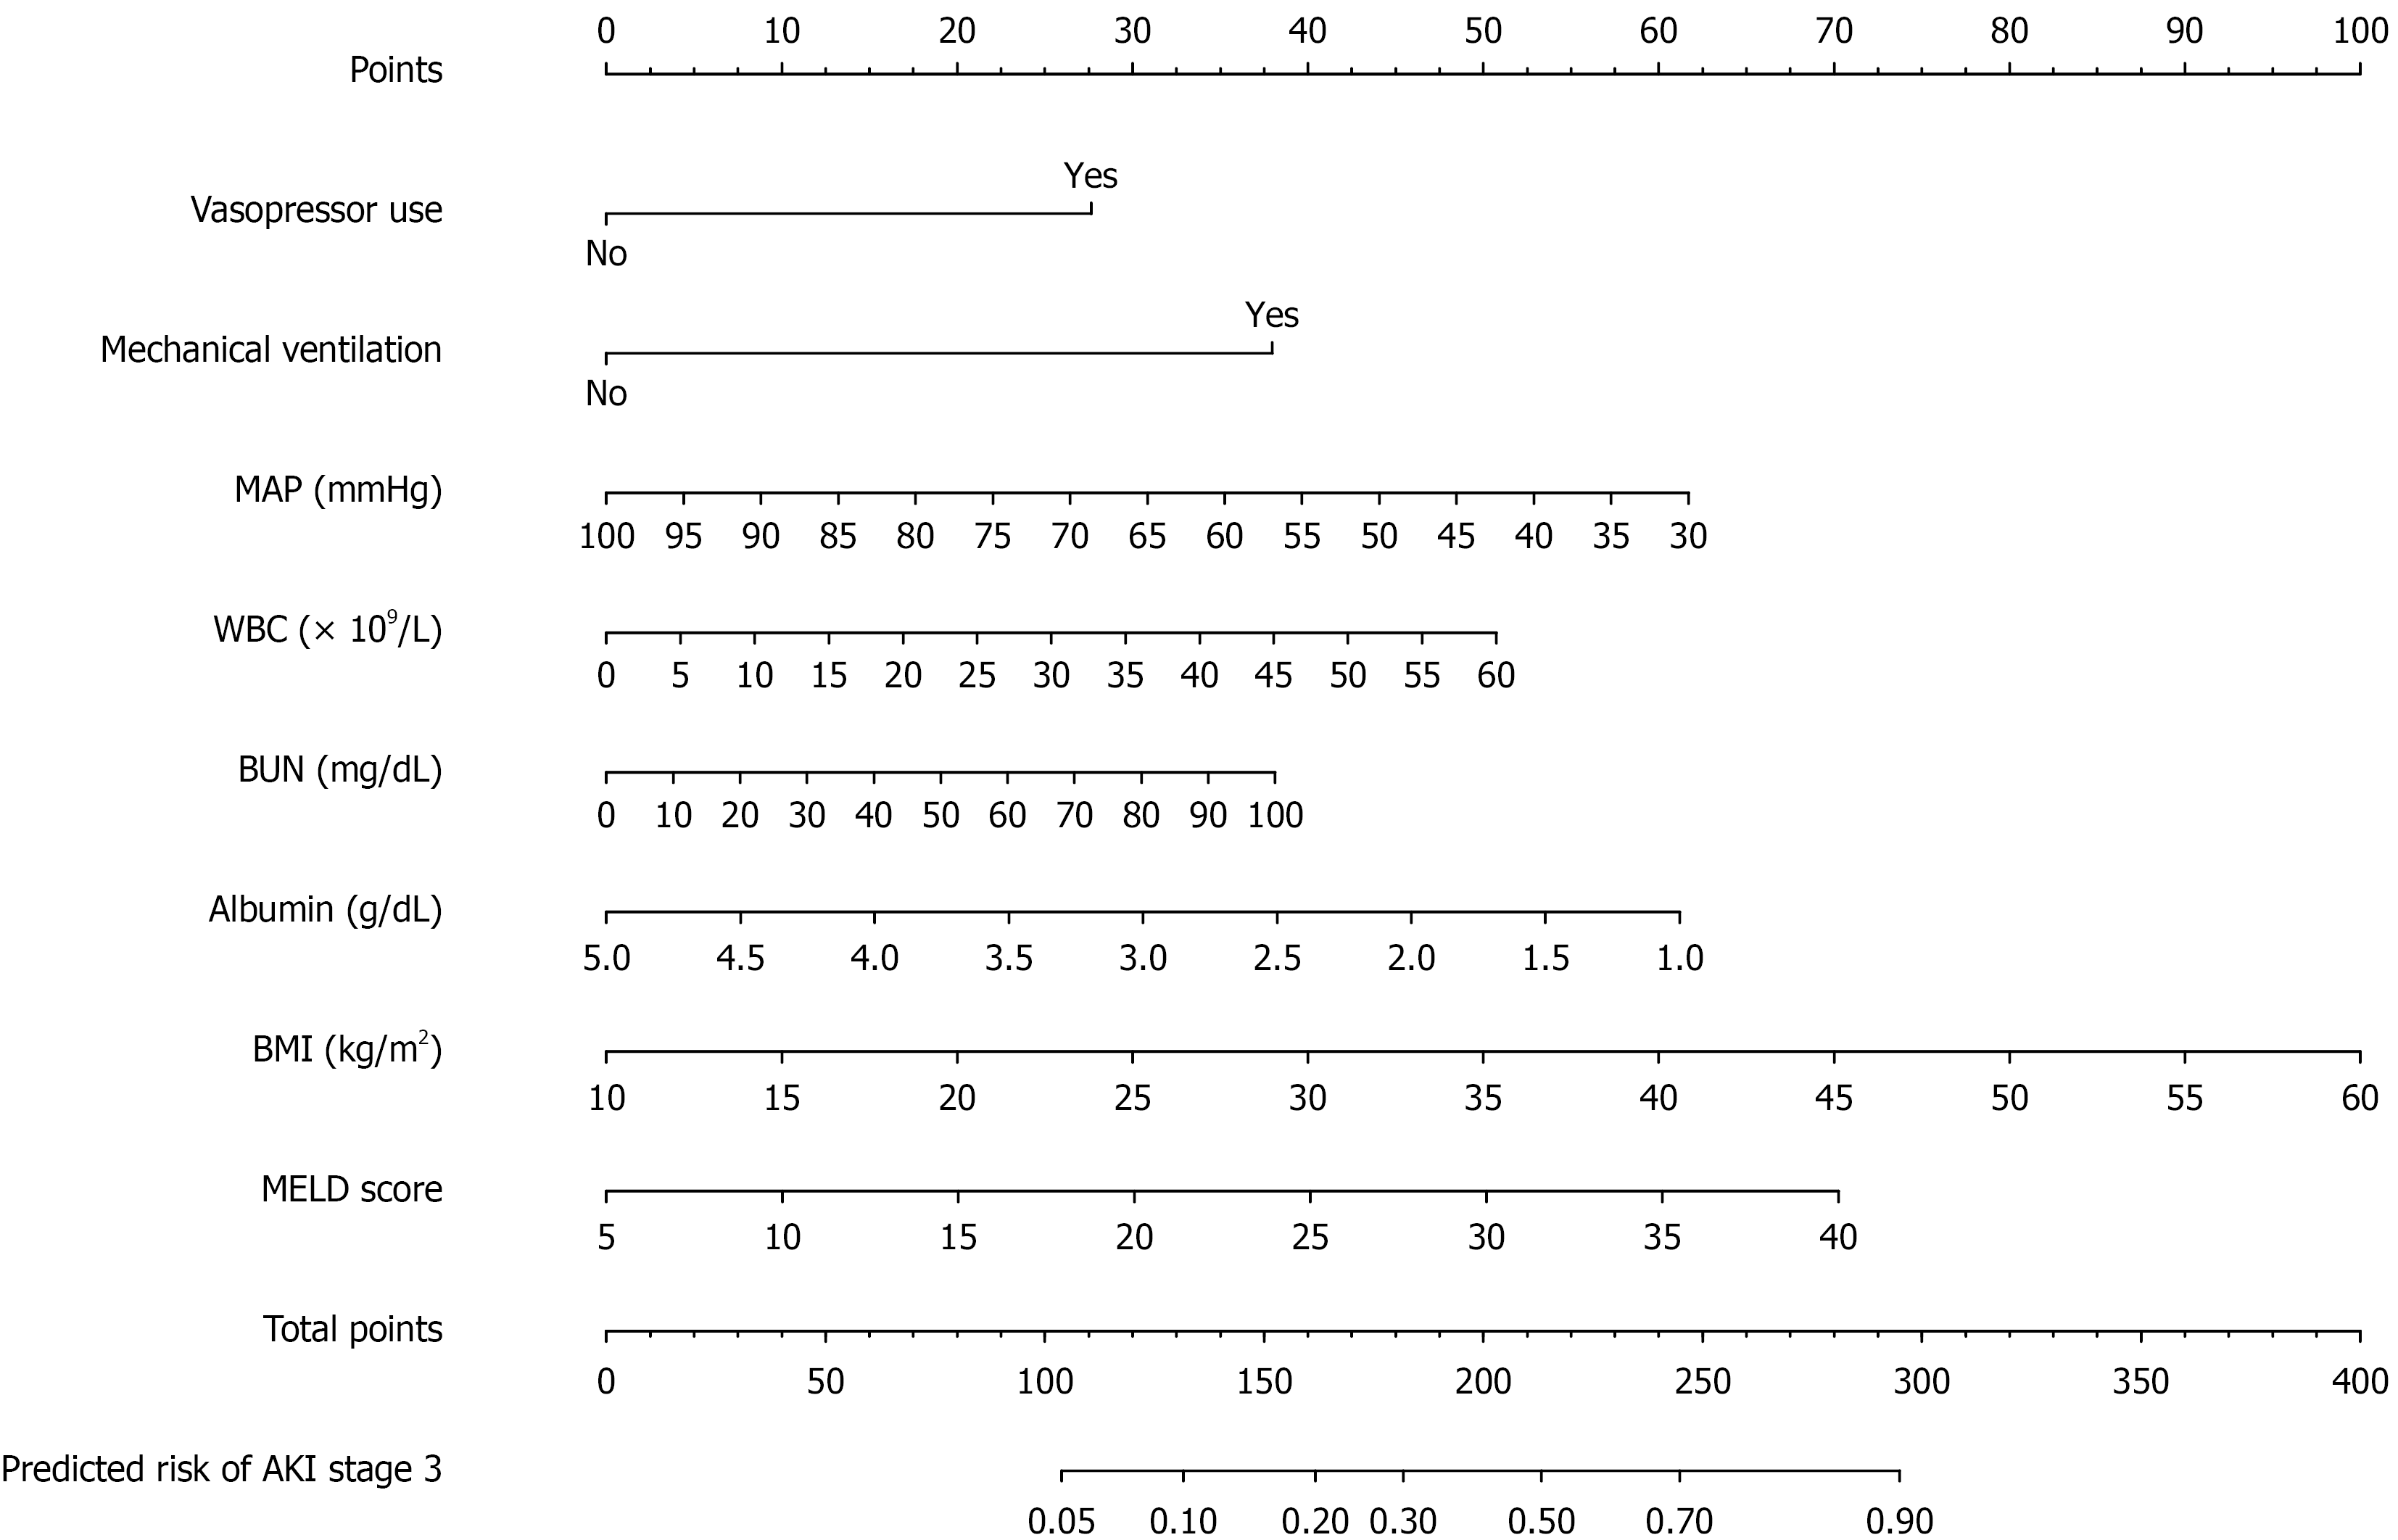
Figure 3 Nomogram of the chronic liver failure organ failure-acute kidney injury score for predicting the 14-day risk of KDIGO stage 3 acute kidney injury in patients with acute-on-chronic liver failure.
Points assigned to each predictor are summed to generate a total score, which corresponds to the predicted probability of stage 3 acute kidney injury within 14 days of intensive care unit admission. MAP: Mean arterial pressure; WBC: White blood cell; BMI: Body mass index; BUN: Blood urea nitrogen; MELD: Model for end-stage liver disease; AKI: Acute kidney injury.
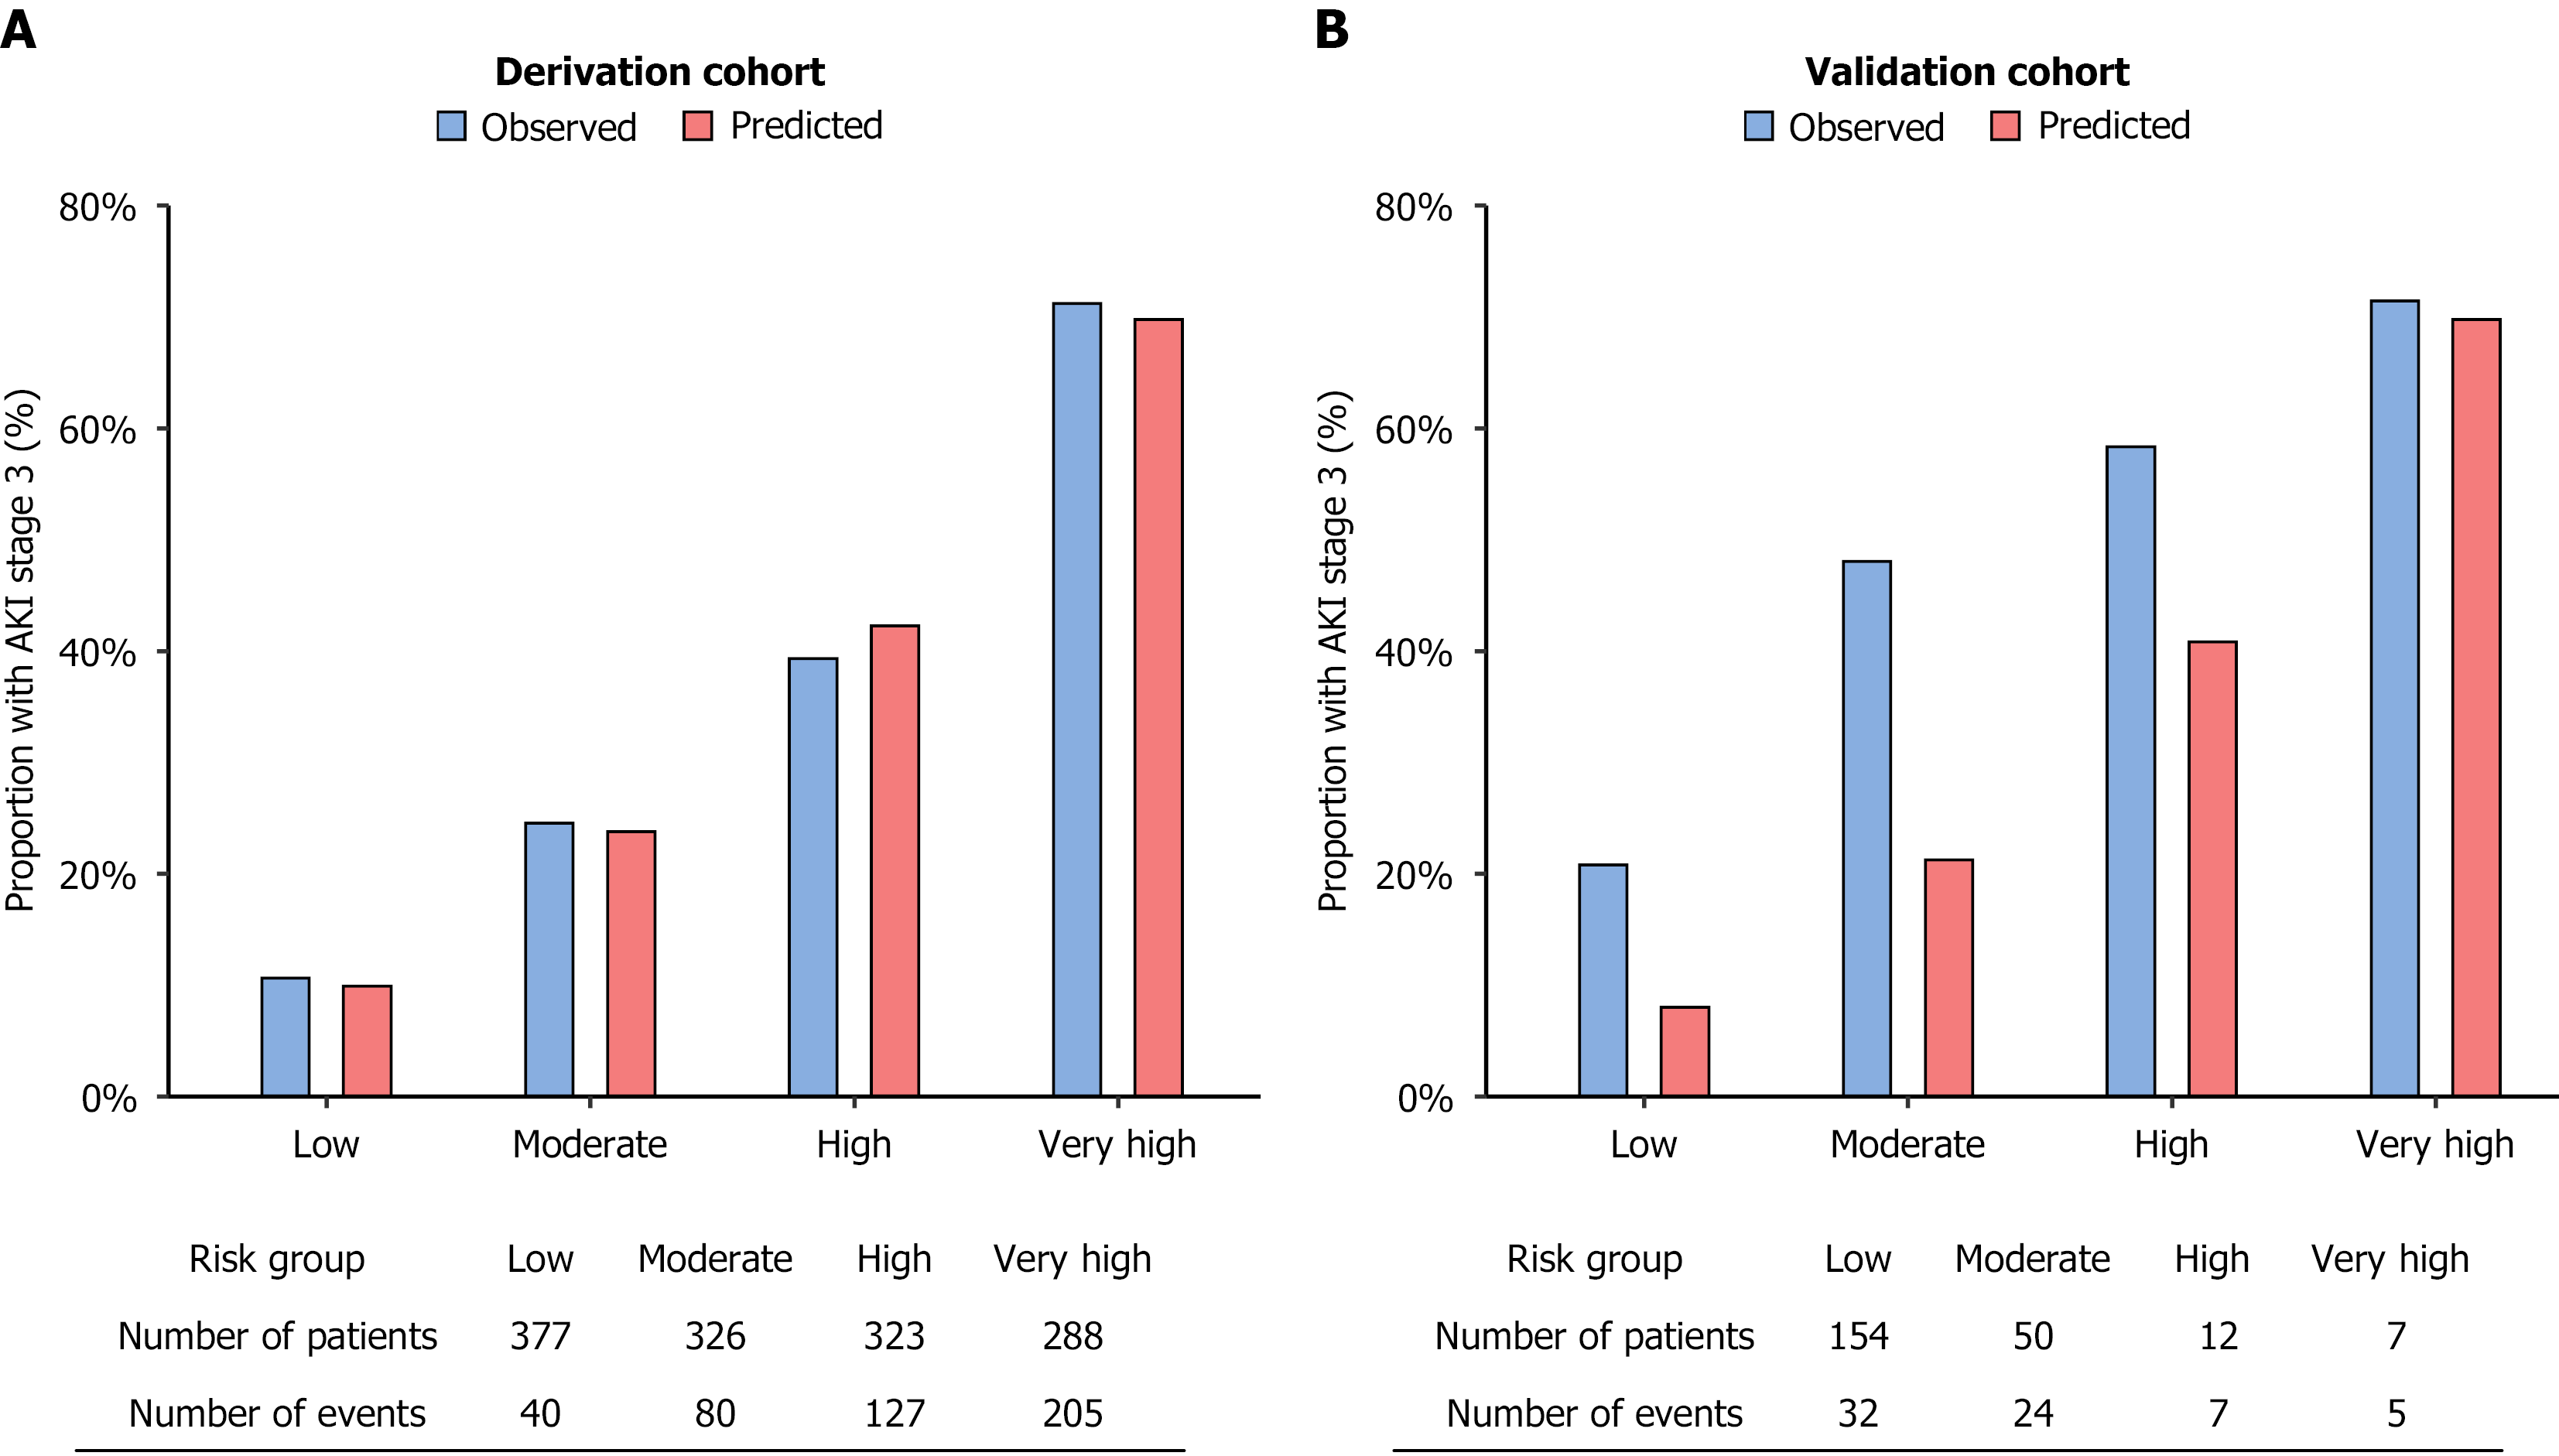
Figure 4 Comparison of observed and predicted risks of KDIGO stage 3 acute kidney injury across chronic liver failure organ failure-acute kidney injury risk categories in the derivation and validation cohorts.
A: Derivation cohort; B: Validation cohort. Bars represent observed and predicted event rates within 14 days of intensive care unit admission. The number of patients and events in each risk category is shown below the x-axis. AKI: Acute kidney injury.
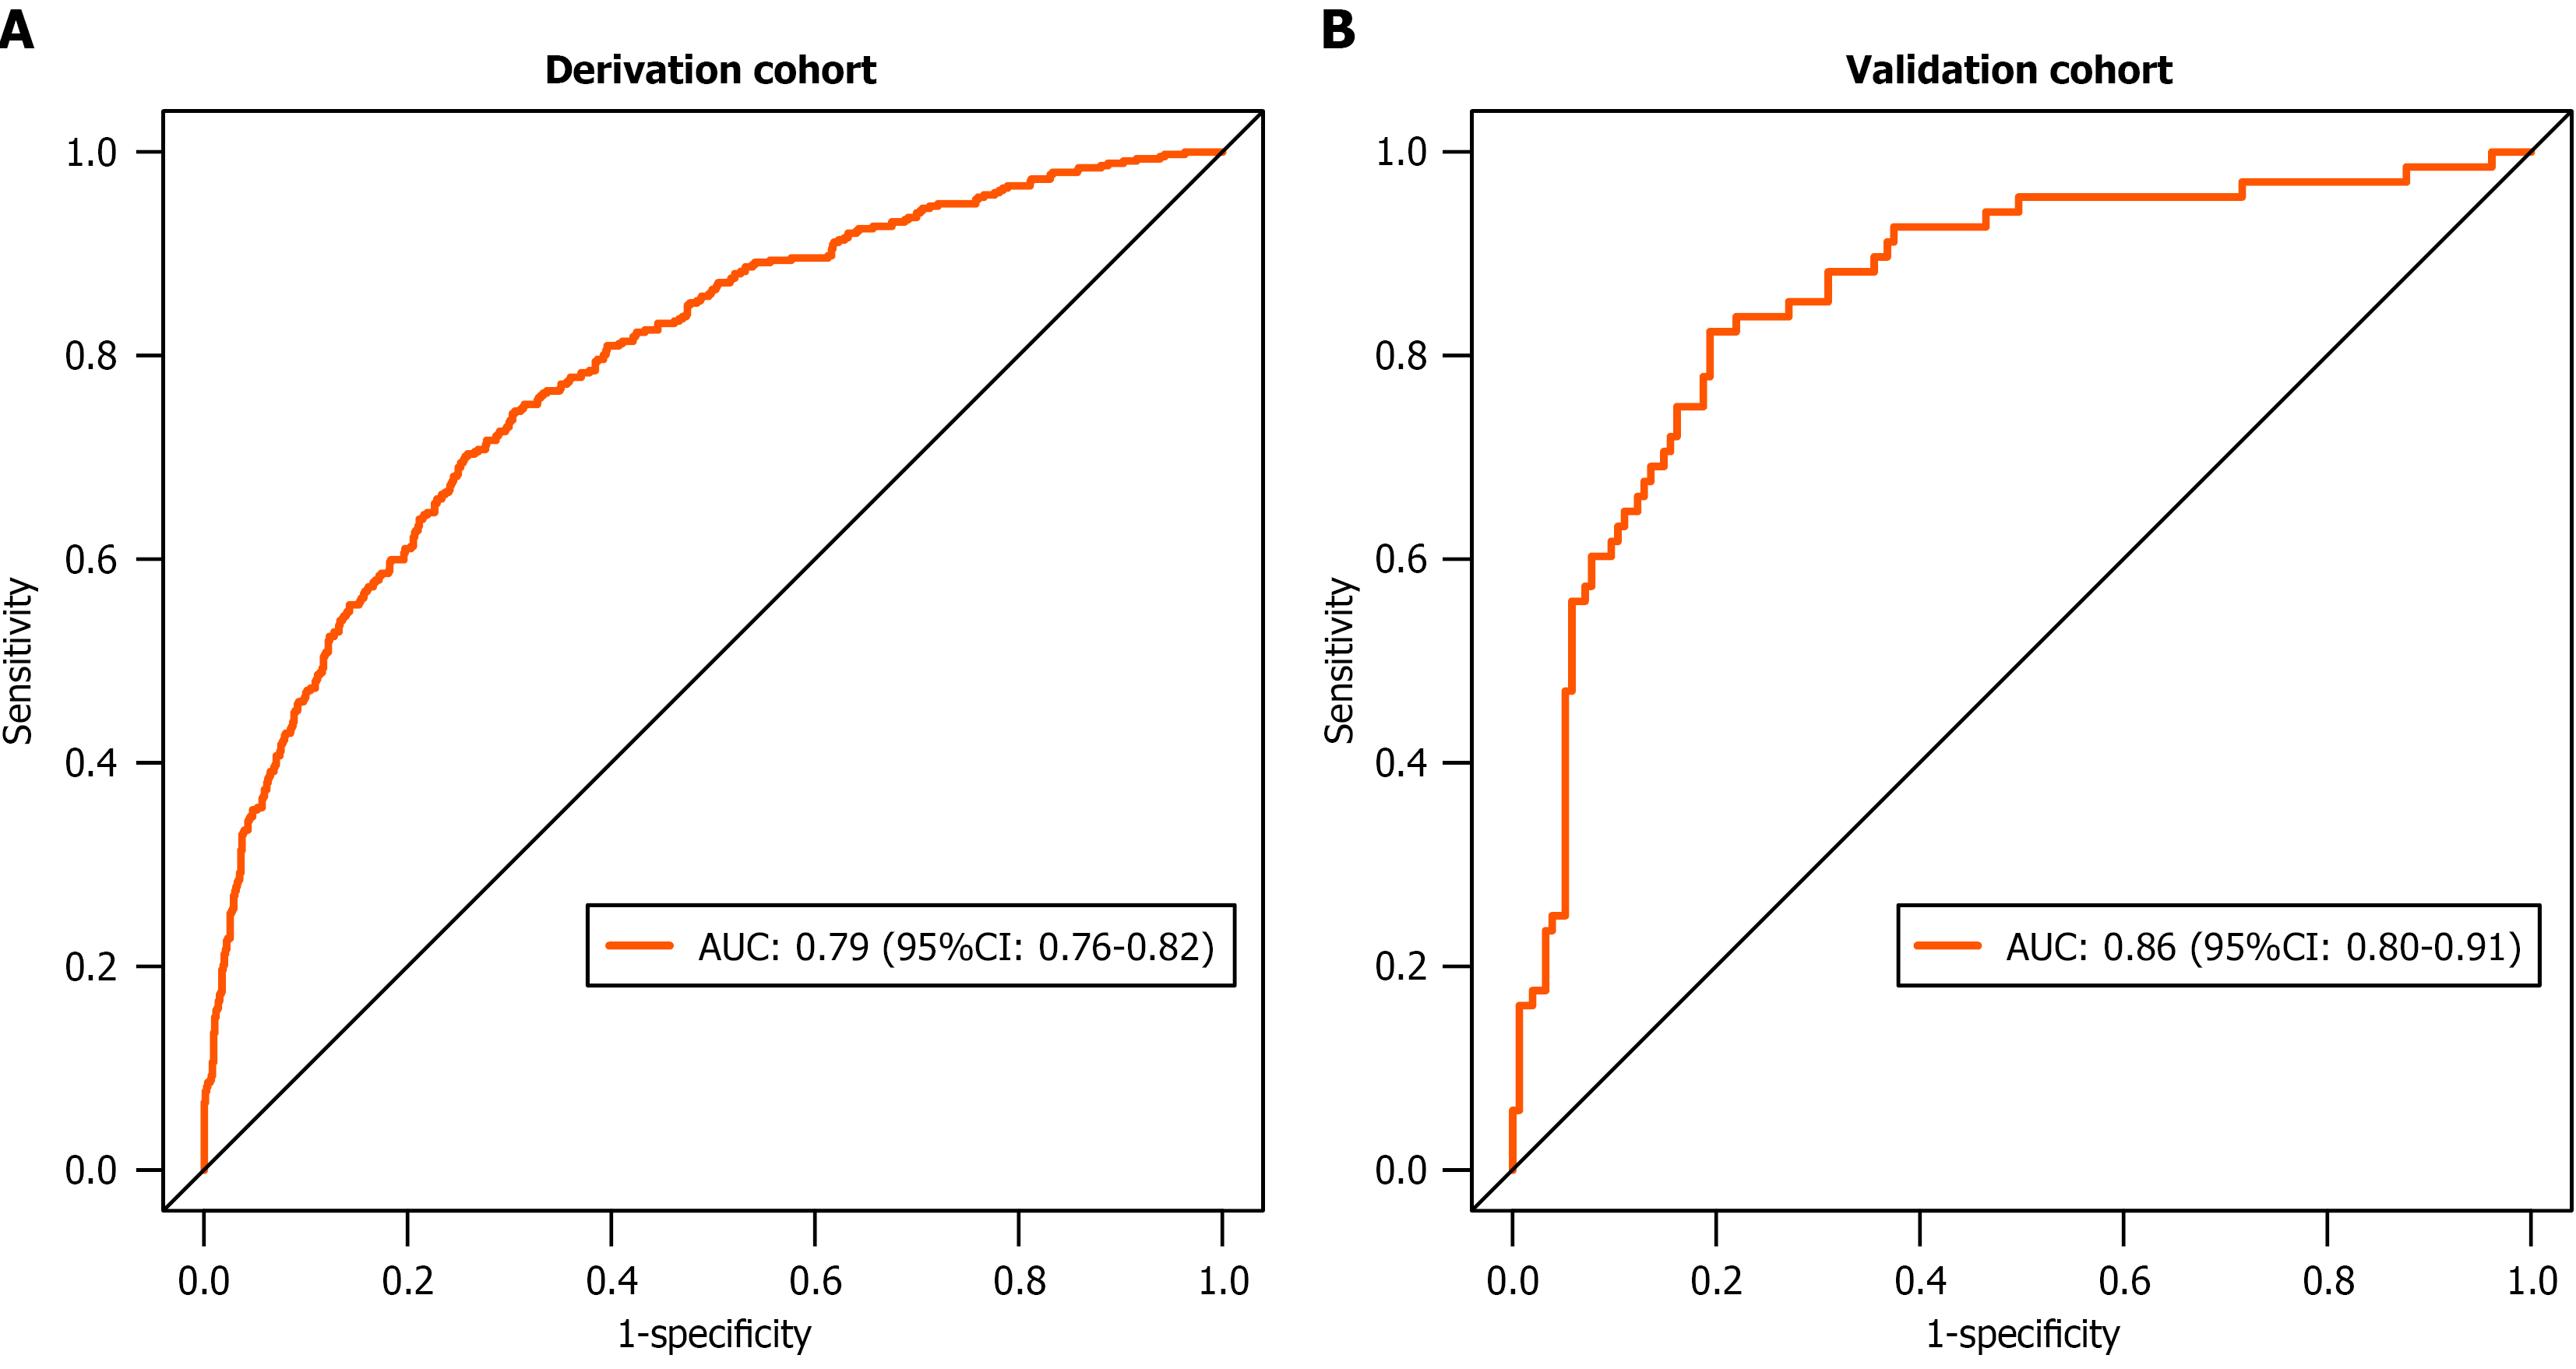
Figure 5 Receiver operating characteristic curves of the chronic liver failure organ failure-acute kidney injury score in the derivation and validation cohorts.
A: Derivation cohort; B: Validation cohort. The score demonstrated good discriminative performance for predicting KDIGO stage 3 acute kidney injury within 14 days, with areas under the curve of 0.79 (95% confidence interval: 0.76-0.82) and 0.86 (95%CI: 0.80-0.91), respectively. AUC: Area under the curve; CI: Confidence interval.
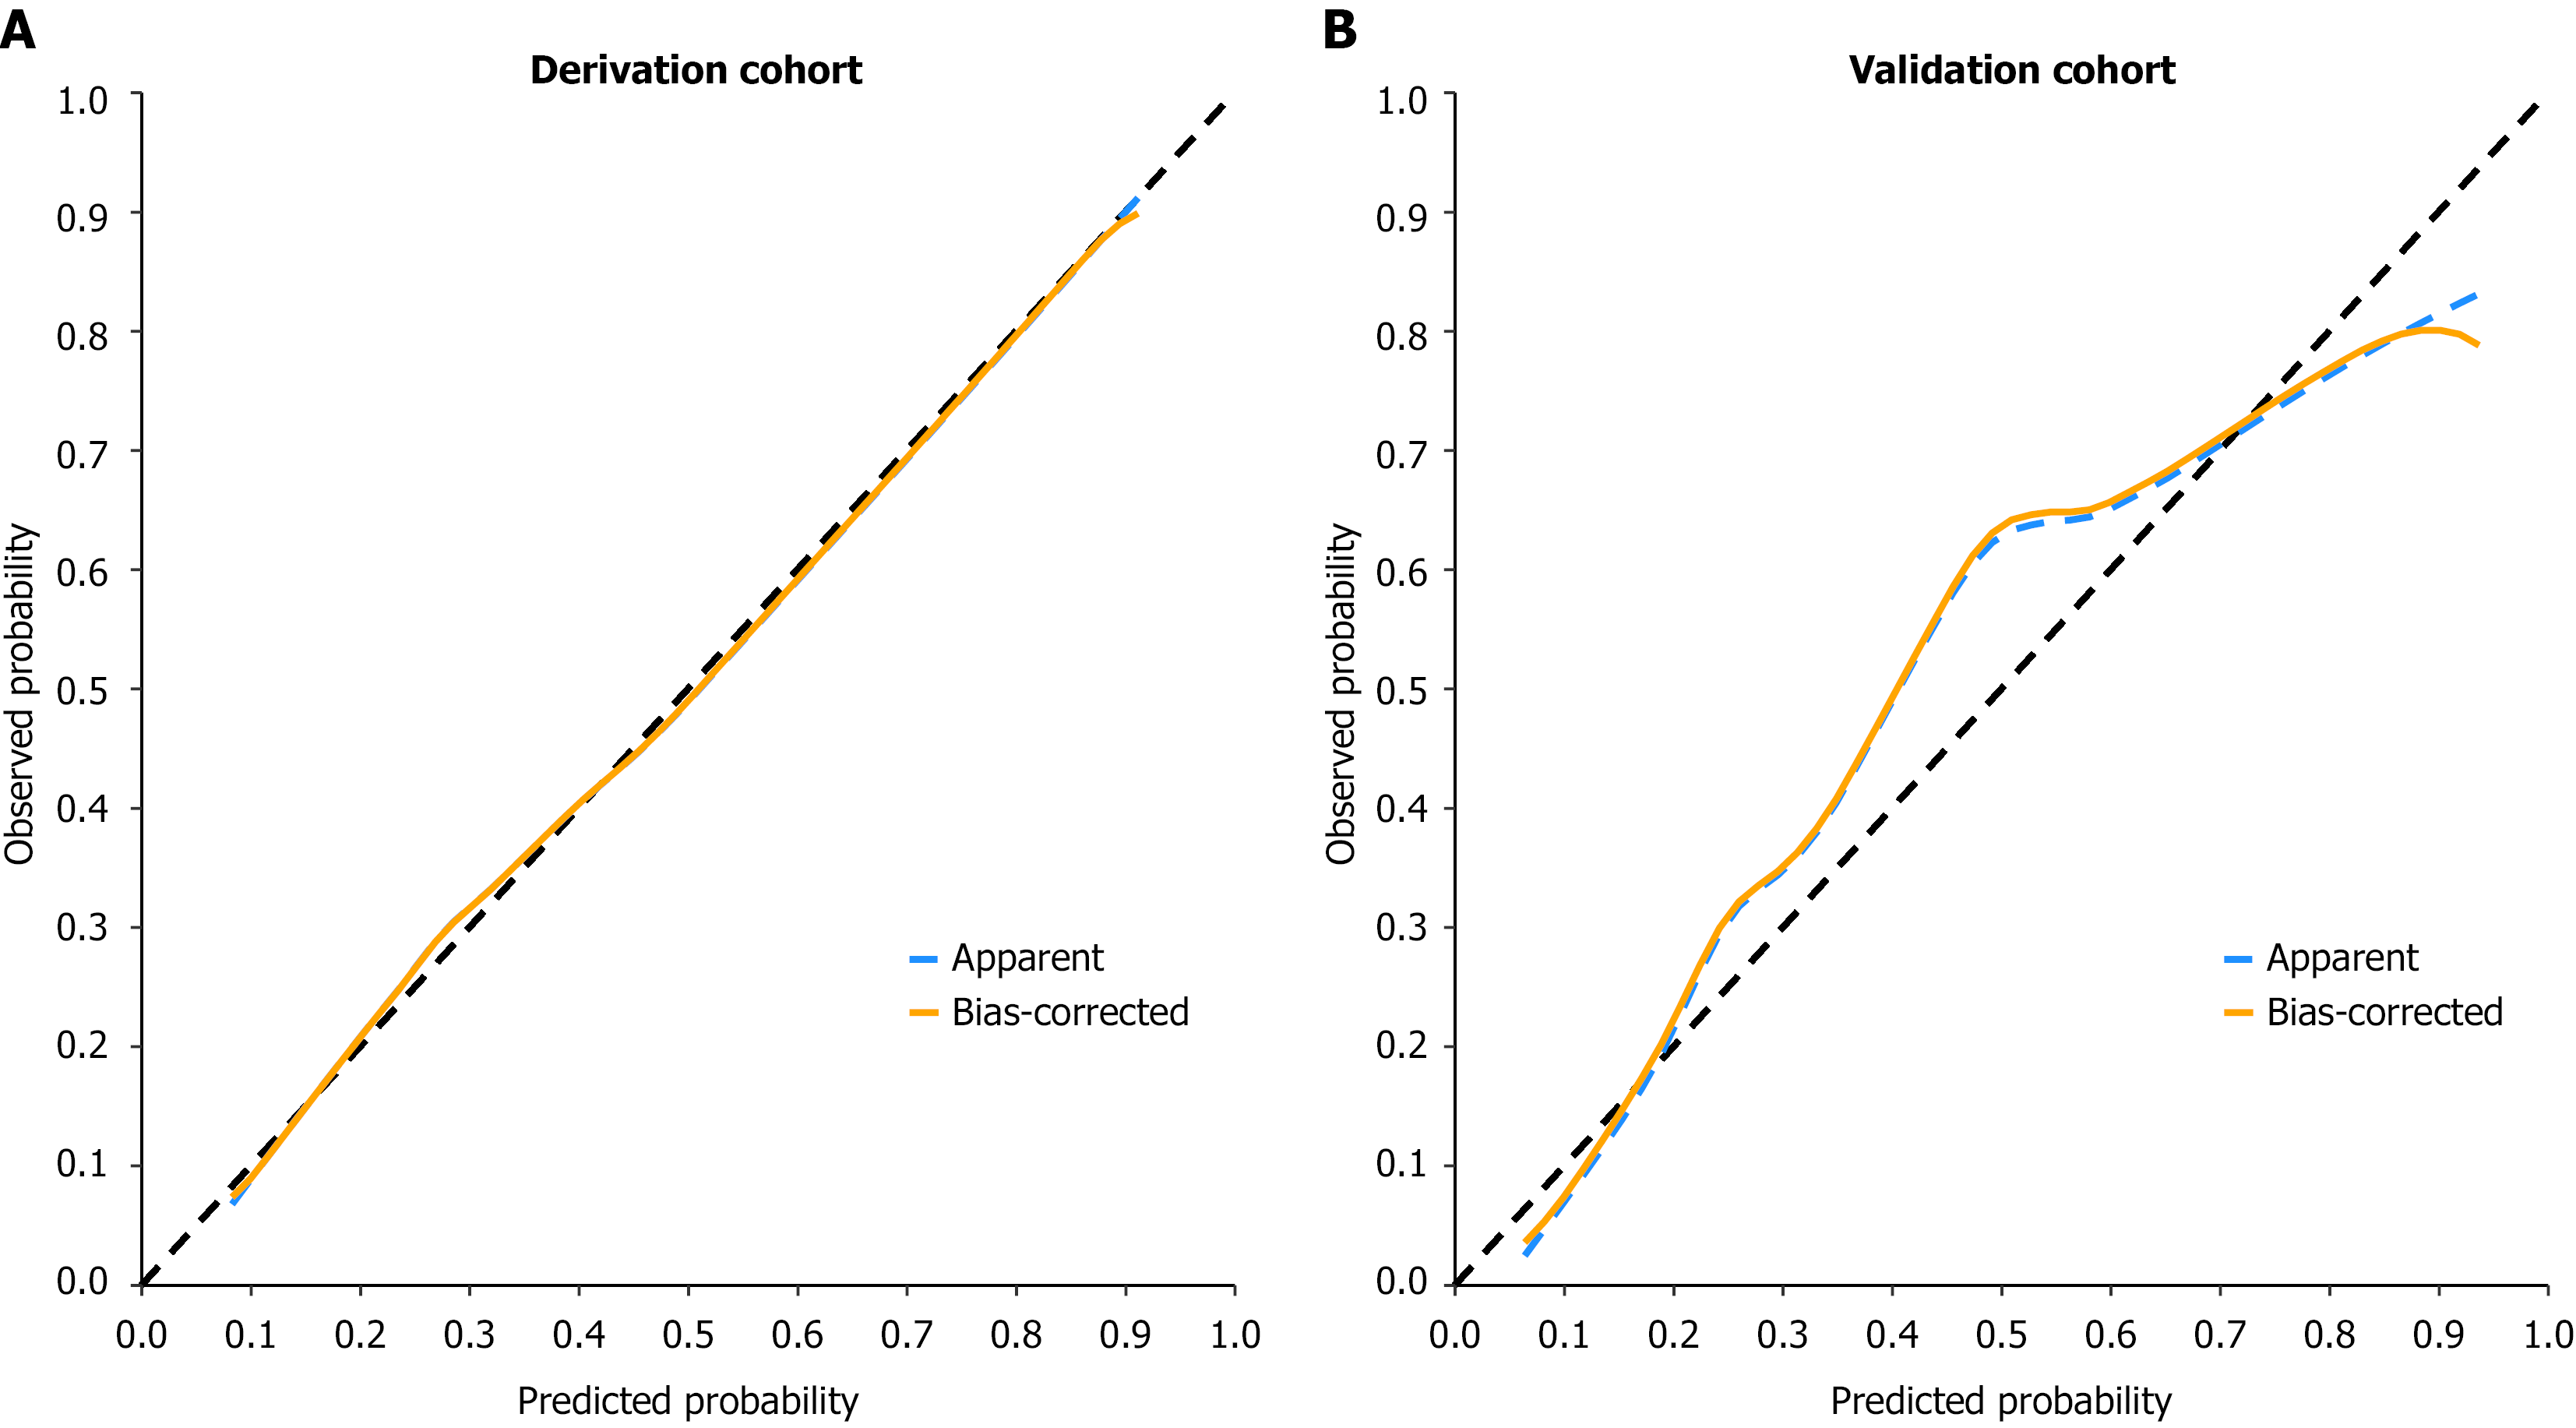
Figure 6 Calibration plots for the chronic liver failure organ failure-acute kidney injury score predicting KDIGO stage 3 acute kidney injury within 14 days in the derivation and validation cohorts.
A: Derivation cohort; B: Validation cohort. The apparent and bias-corrected calibration curves are shown in blue and orange, respectively. The dashed diagonal line represents ideal calibration, where predicted probabilities correspond exactly to observed event probabilities.
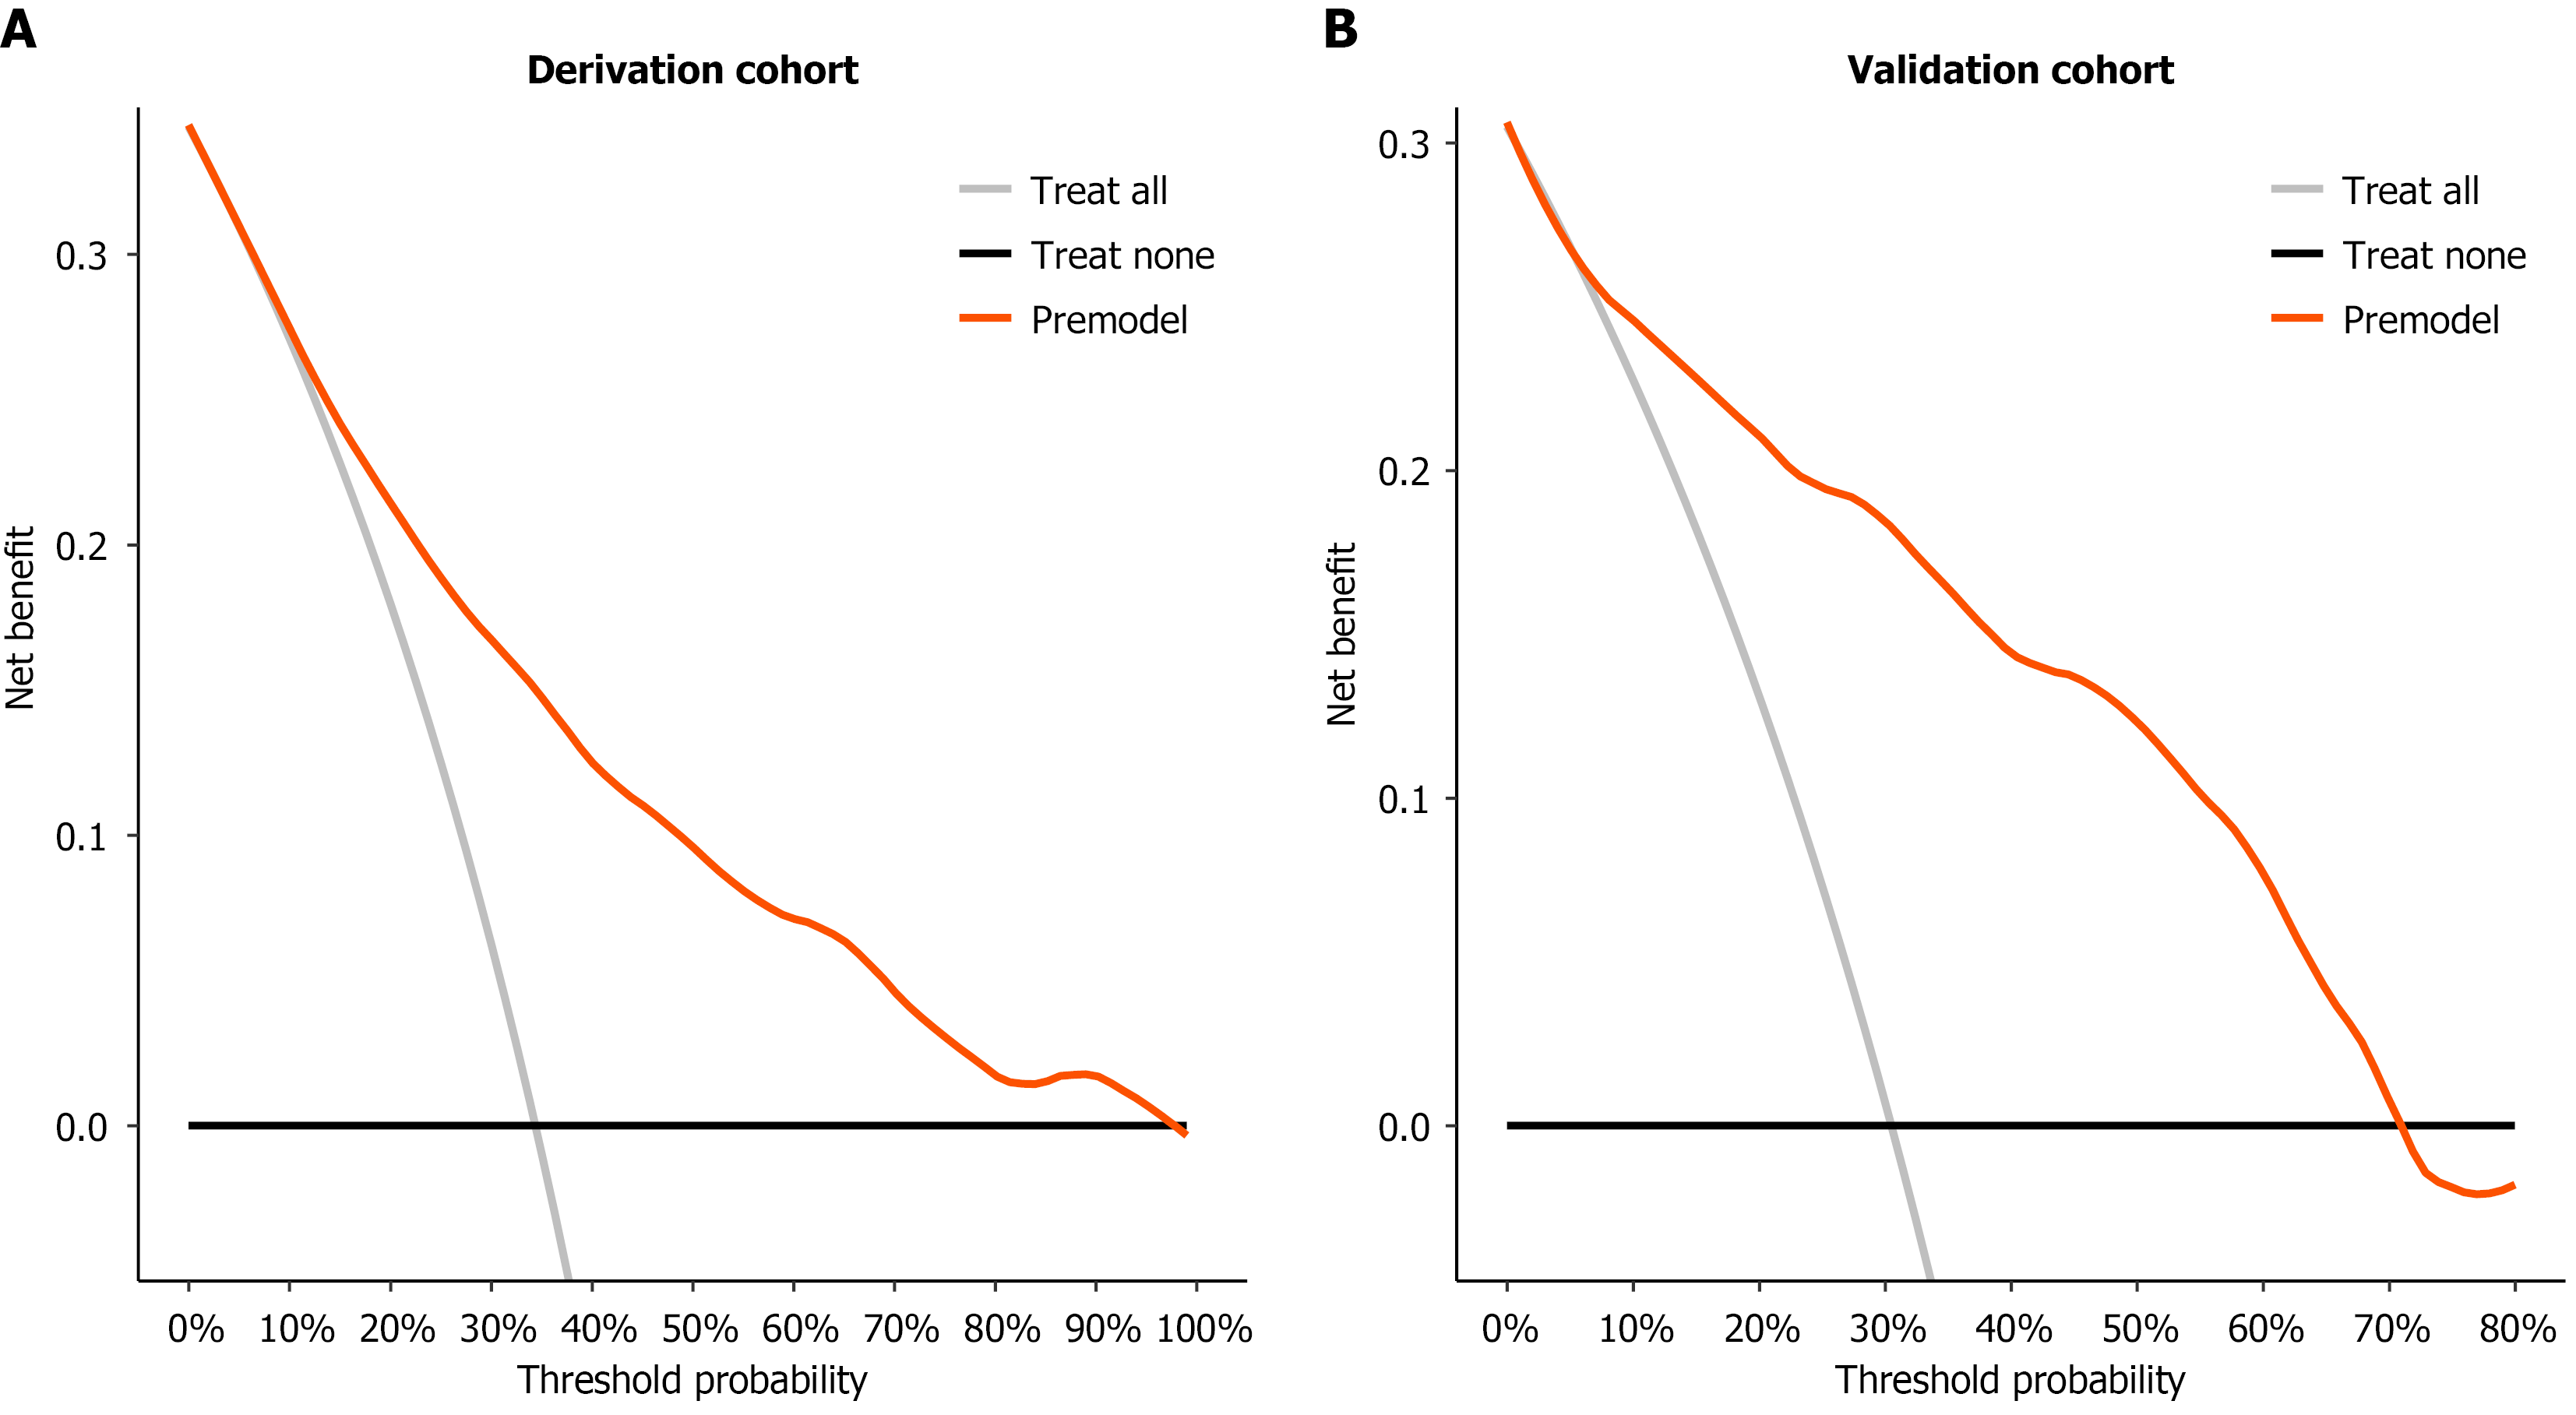
Figure 7 Decision curve analysis of the chronic liver failure organ failure-acute kidney injury score in the derivation and validation cohorts.
A: Derivation cohort; B: Validation cohort. The orange curve represents the net benefit of the chronic liver failure organ failure-acute kidney injury model for predicting KDIGO stage 3 acute kidney injury within 14 days. The gray line indicates the strategy of treating all patients, whereas the black line indicates the strategy of treating no patients.
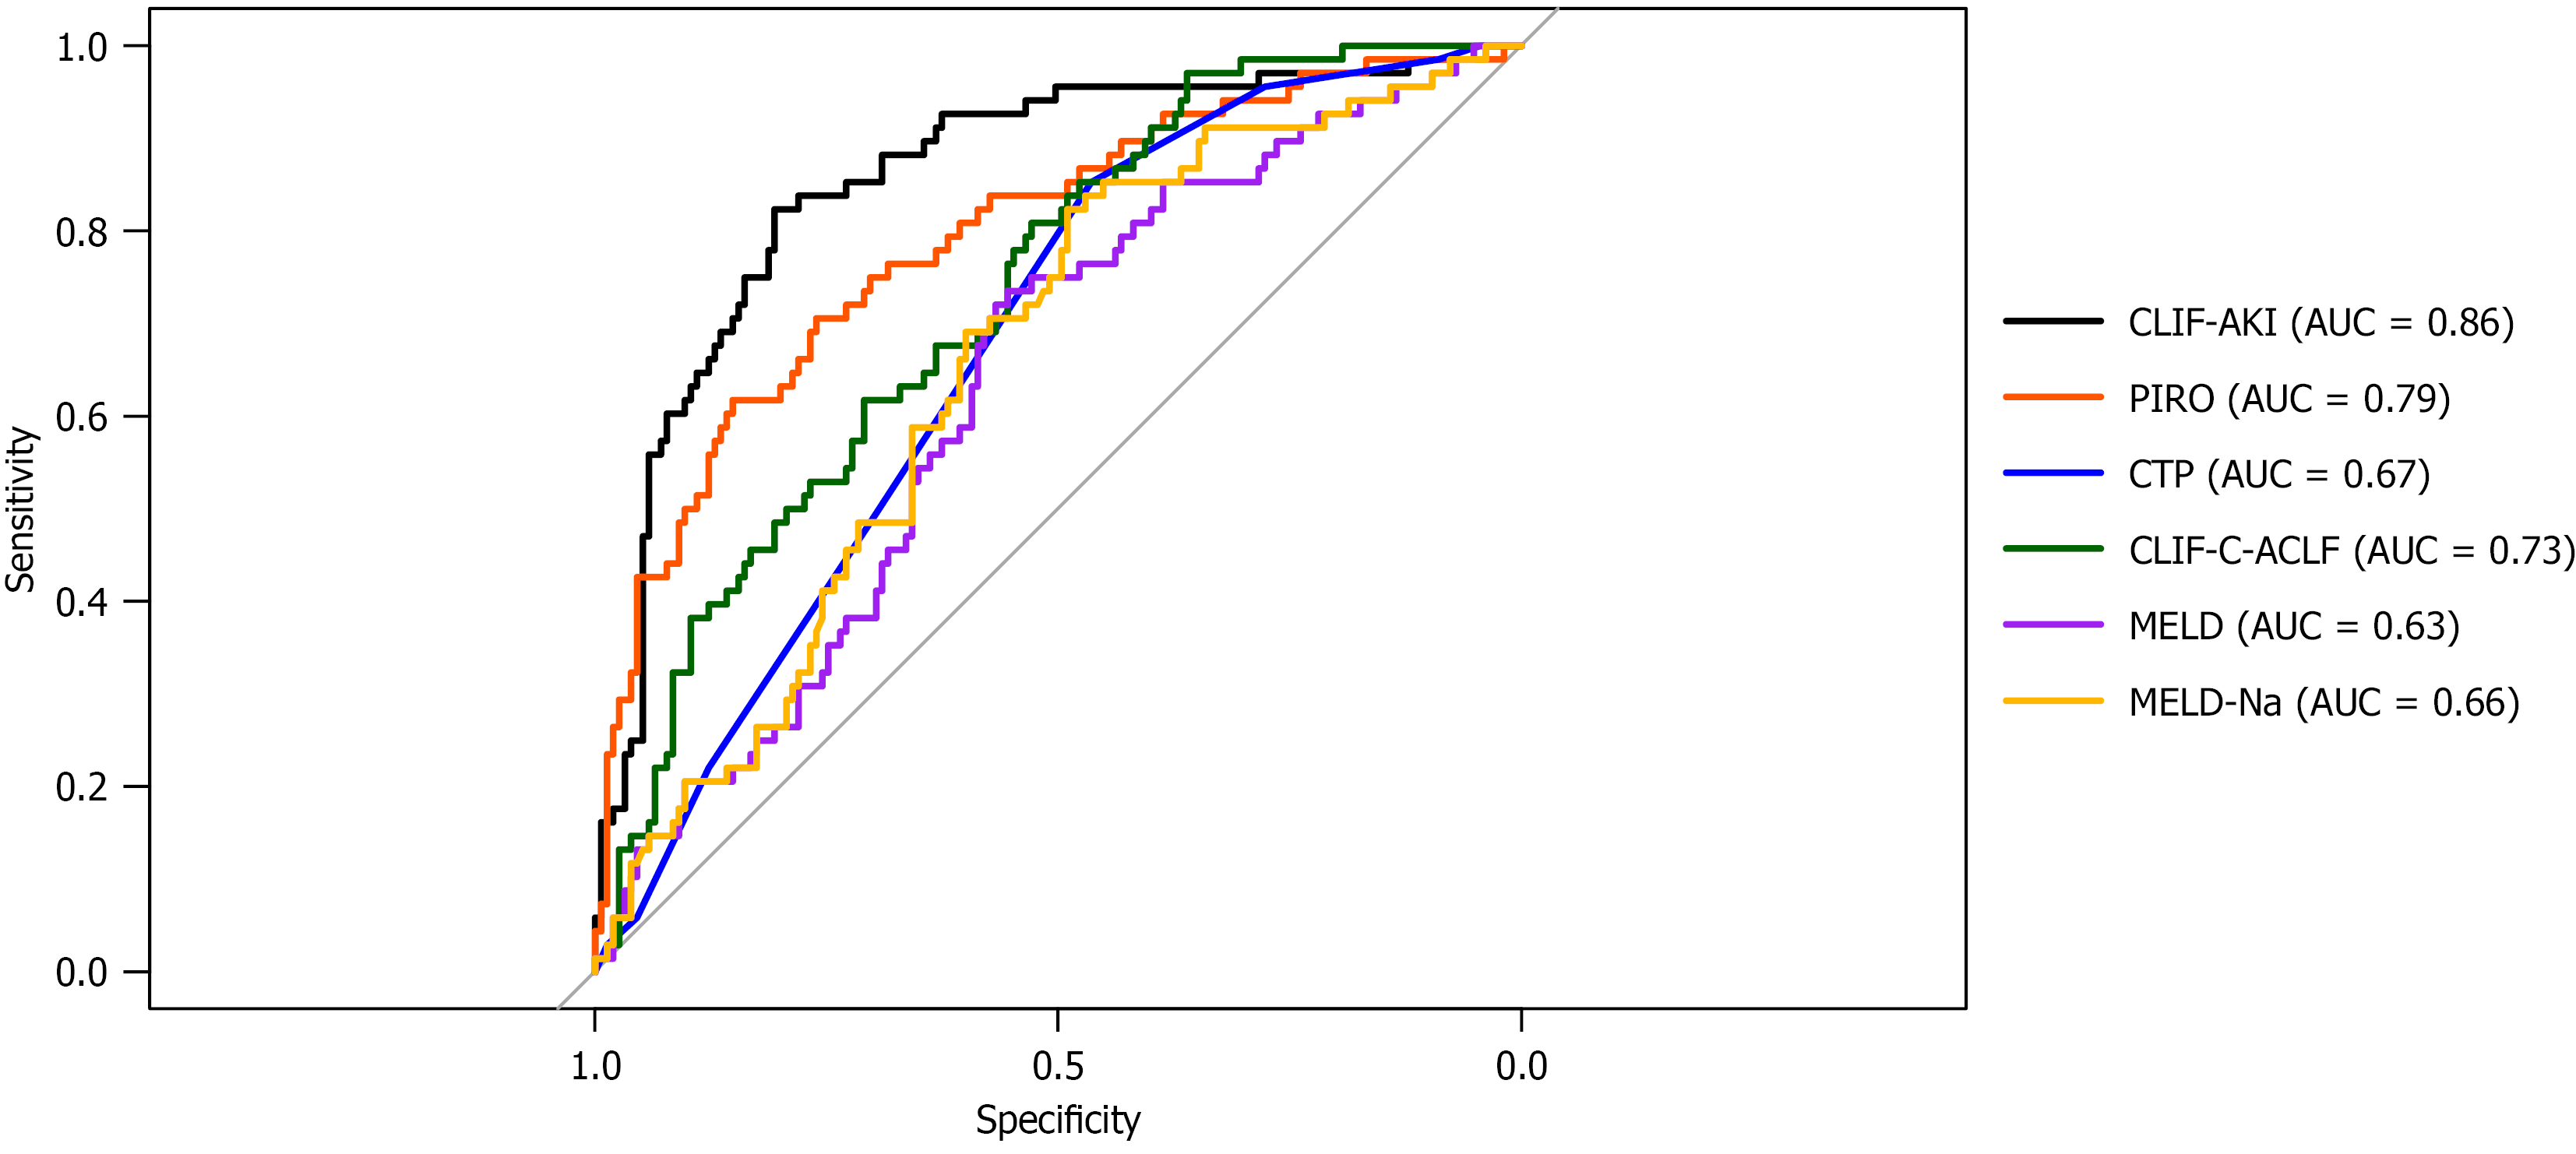
Figure 8 Receiver operating characteristic curves comparing the performance of the chronic liver failure organ failure-acute kidney injury score with that of the PIRO, Child-Turcotte-Pugh, chronic liver failure consortium acute-on-chronic liver failure, model for end-stage liver disease, and model for end-stage liver disease-sodium scores in the external validation cohort.
The curves illustrate the ability of each model to predict KDIGO stage 3 acute kidney injury within 14 days of intensive care unit admission. The area under the curve for each model is indicated in the figure. CLIF-AKI: Chronic liver failure organ failure-acute kidney injury; CTP: Child-Turcotte-Pugh; CLIF-C-ACLF: Chronic liver failure consortium acute-on-chronic liver failure; MELD: Model for end-stage liver disease; MELD-Na: Model for end-stage liver disease-sodium; AUC: Area under the curve.
- Citation: Wang N, Tan YW, Zhang PF, Zhou XB, Zhu L. CLIF-AKI score predicts KDIGO stage 3 acute kidney injury in intensive care unit patients with acute-on-chronic liver failure. World J Gastroenterol 2026; 32(48): 122612
- URL: https://www.wjgnet.com/1007-9327/full/v32/i48/122612.htm
- DOI: https://dx.doi.org/10.3748/wjg.122612