
















Copyright: ©Author(s) 2026.
World J Gastroenterol. Dec 21, 2026; 32(47): 122370
Published online Dec 21, 2026. doi: 10.3748/wjg.122370
Published online Dec 21, 2026. doi: 10.3748/wjg.122370
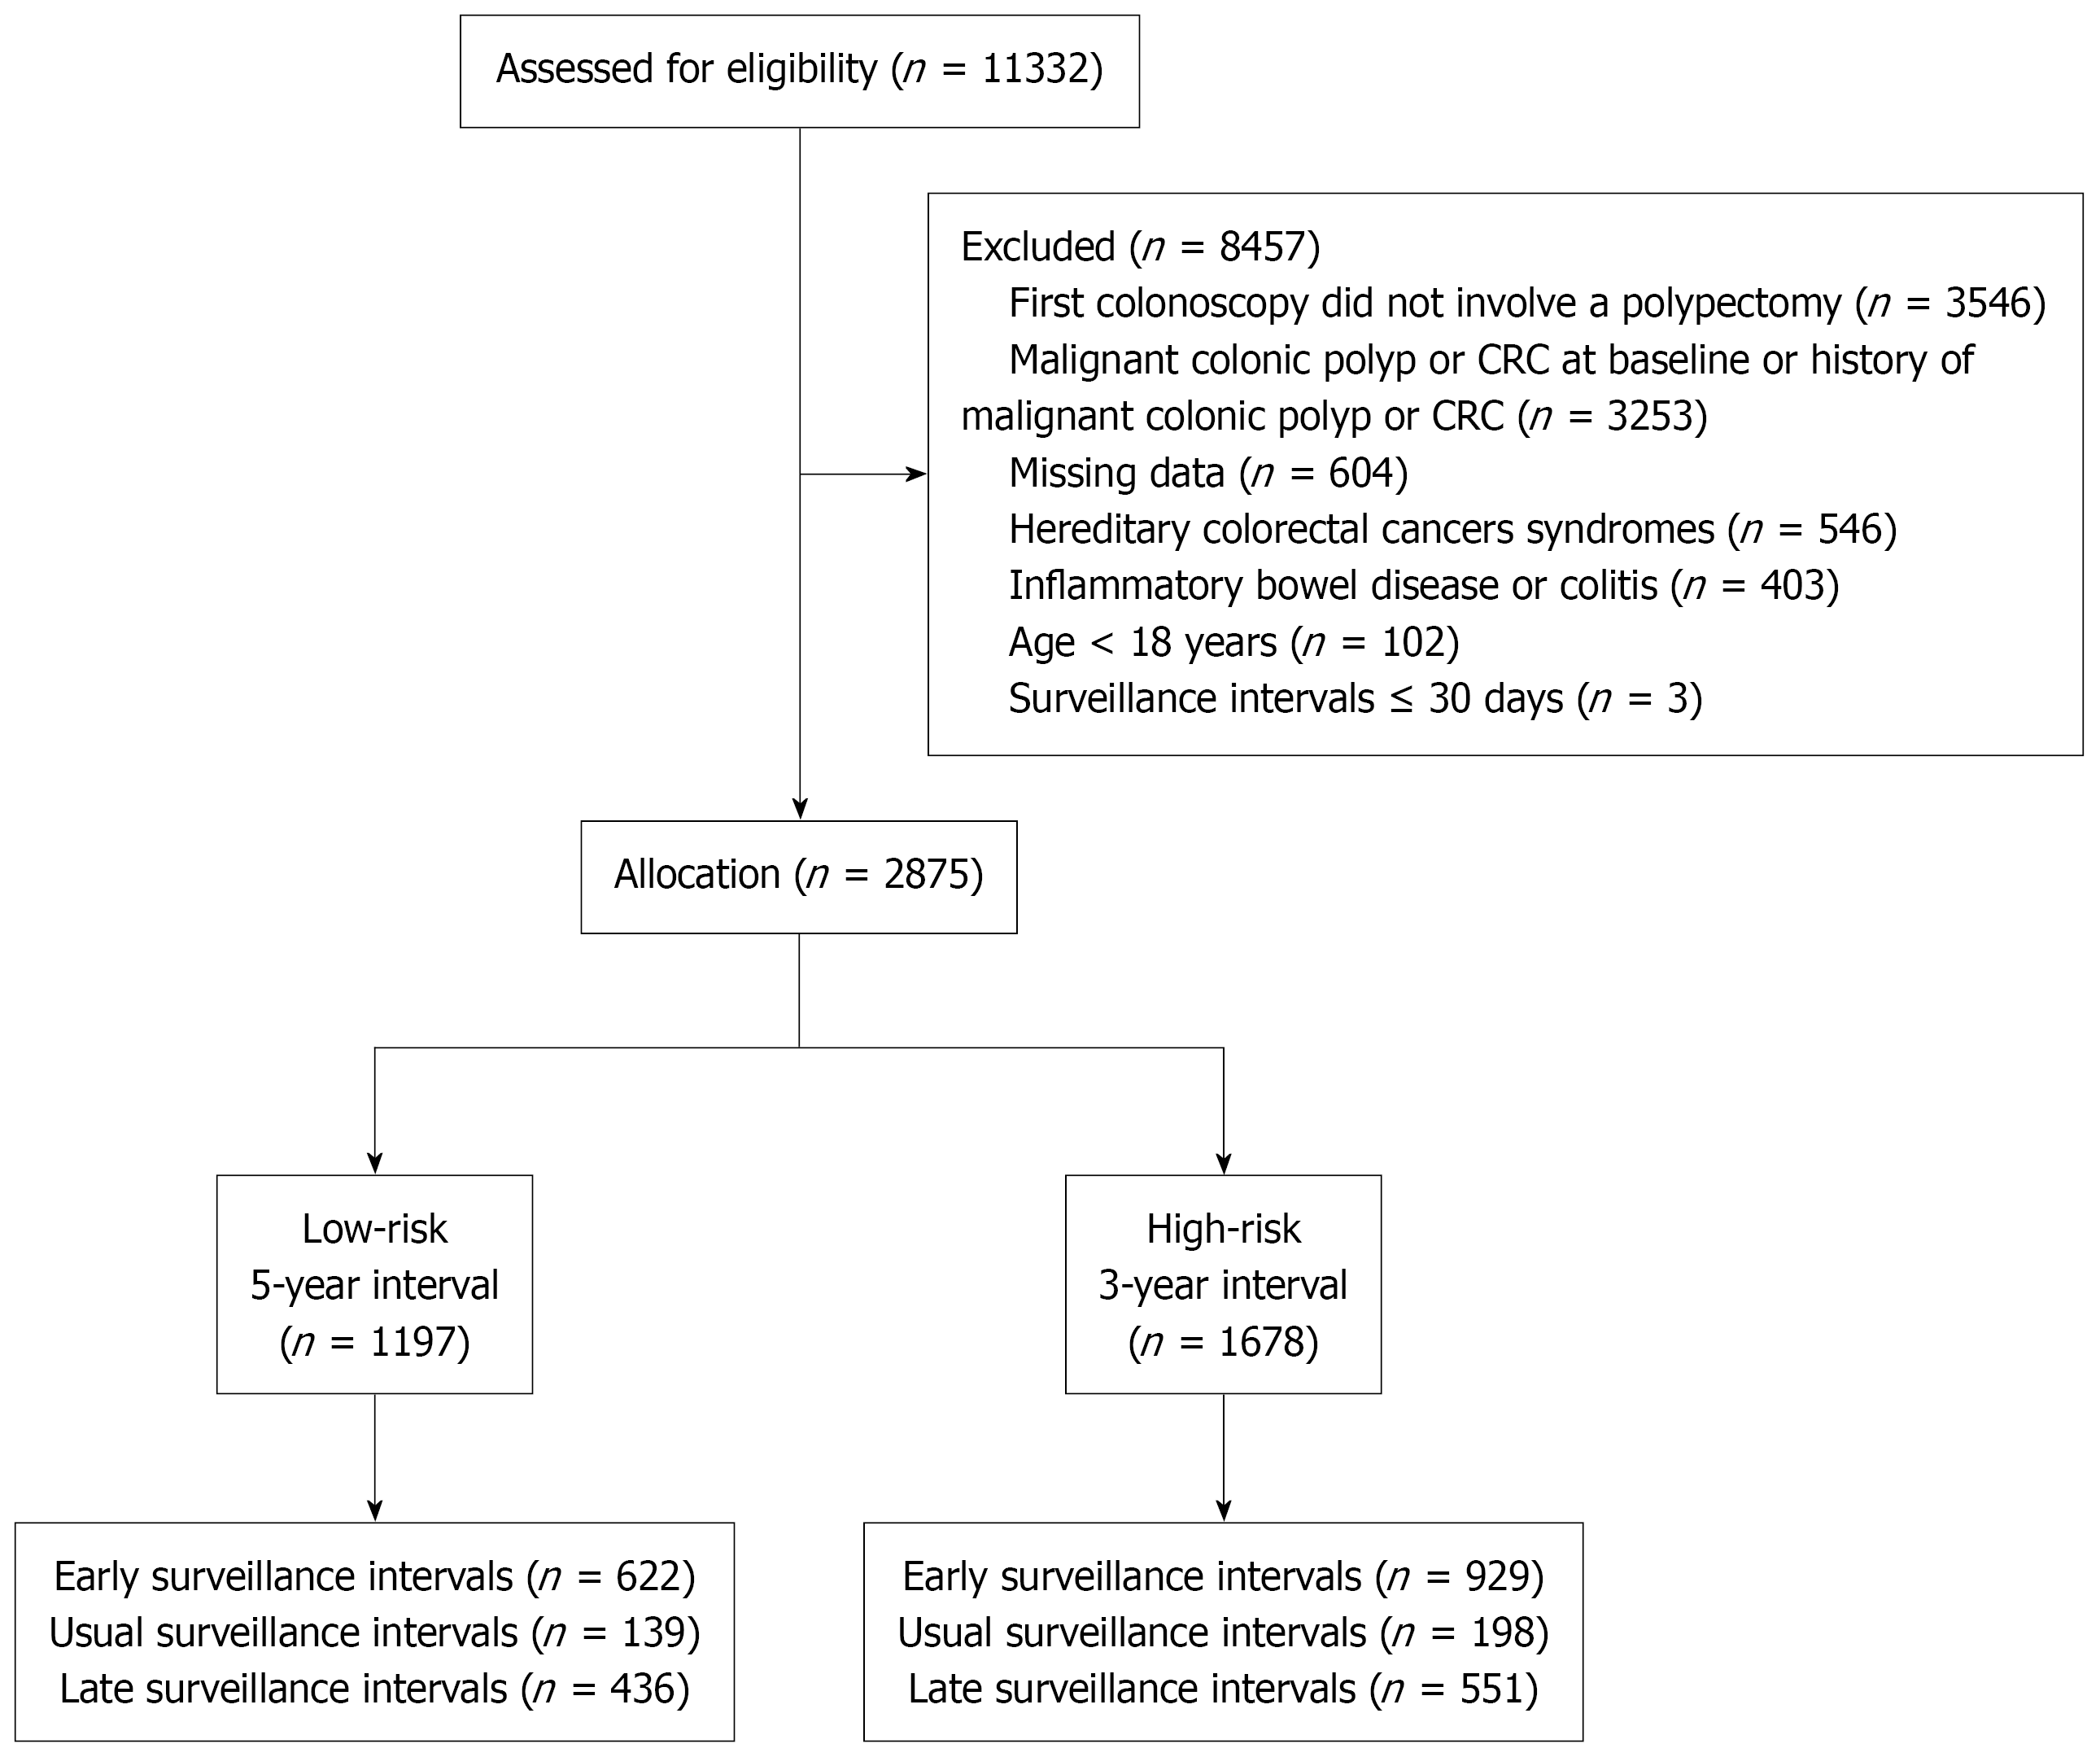
Figure 1 Patient selection and allocation flowchart based on the Strengthening the Reporting of Observational Studies in Epidemiology Guidelines of 11332 patients assessed for eligibility, 8457 were excluded (see exclusion criteria listed in the figure).
The remaining 2875 post-polypectomy patients were allocated to a low-risk group (n = 1197; recommended 5-year surveillance interval) or a high-risk group (n = 1678; recommended 3-year surveillance interval). Each risk group was further subdivided by actual surveillance timing into early, usual, and late interval subgroups. CRC: Colorectal cancer.
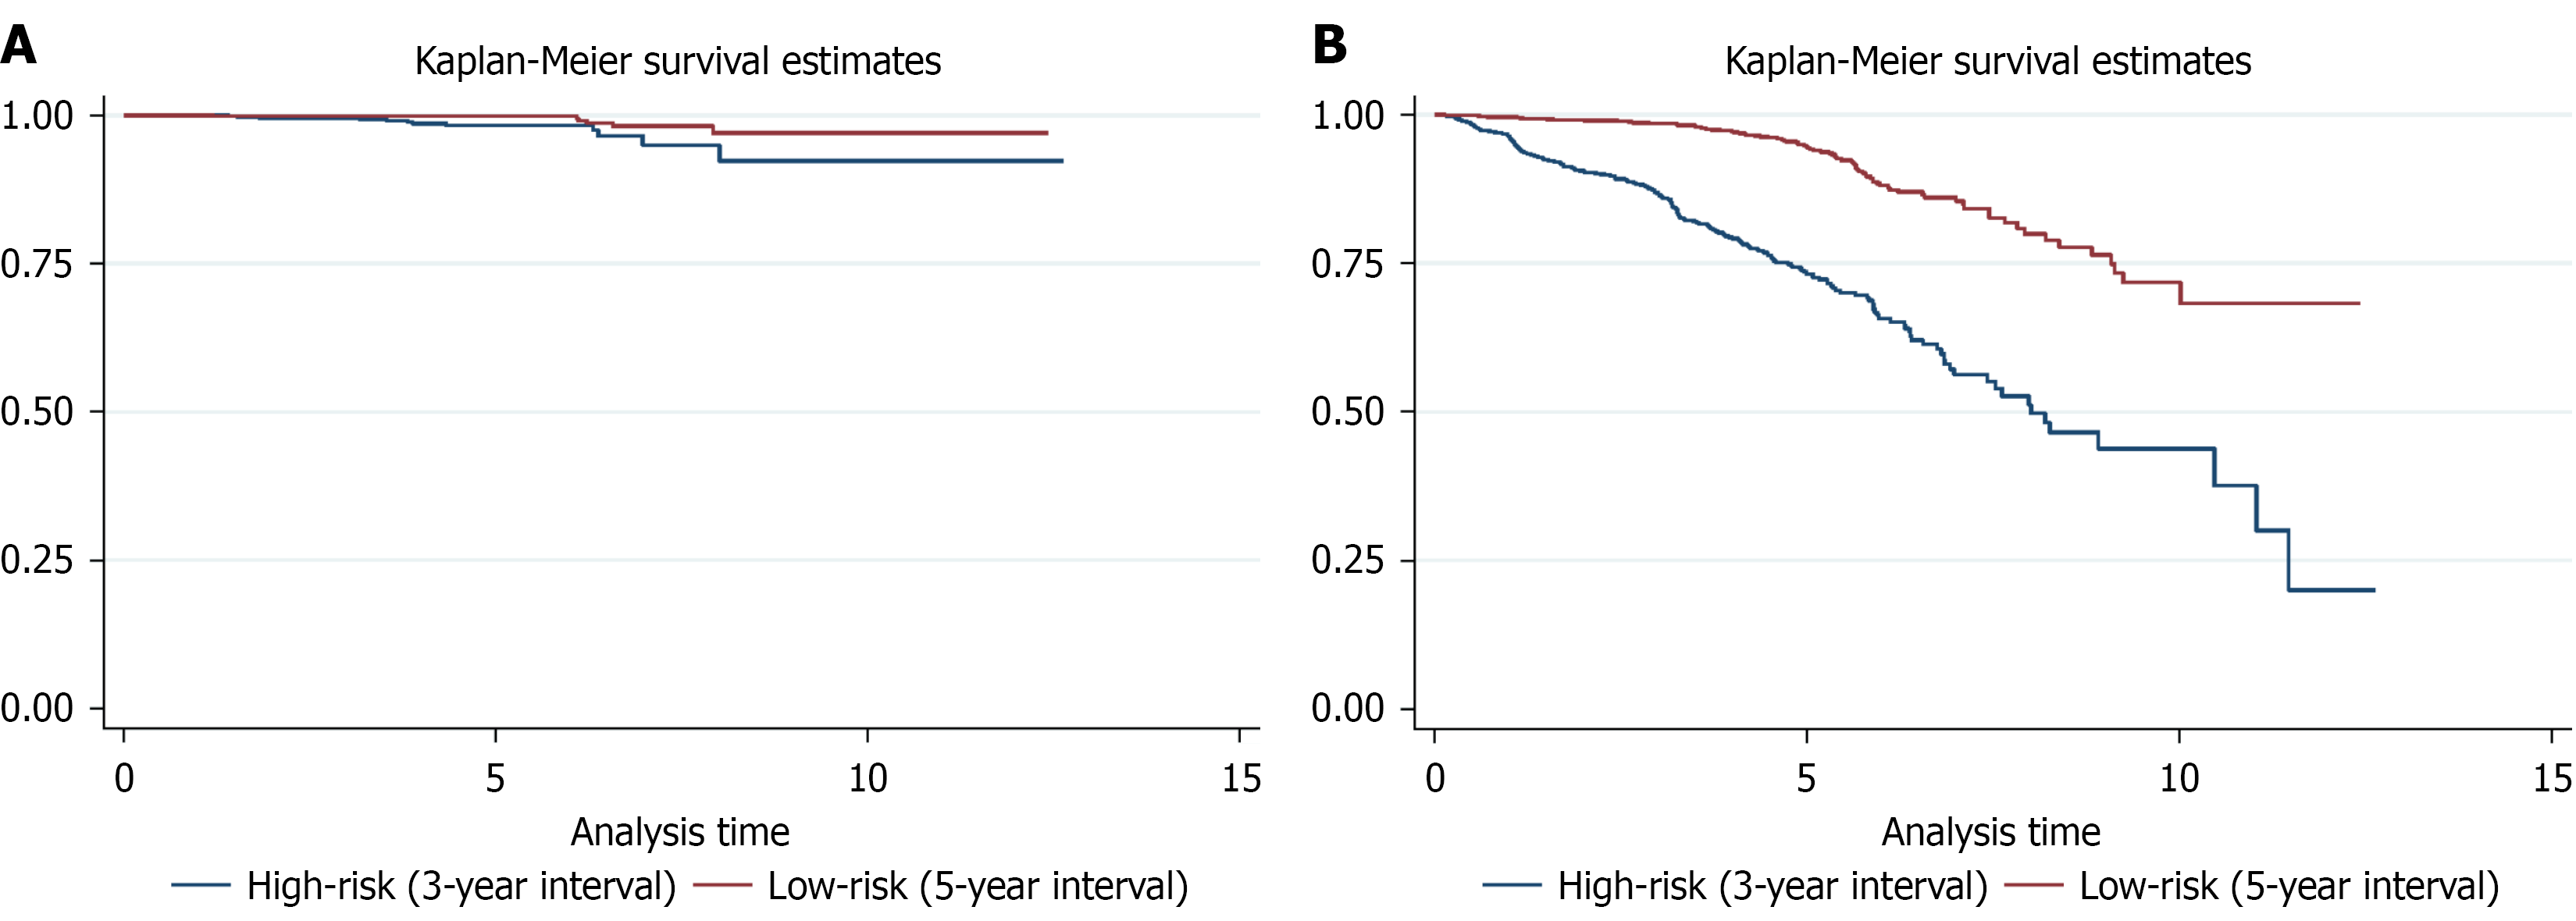
Figure 2 Kaplan-Meier estimates by risk group.
A: Kaplan-Meier estimates of colorectal cancer-free survival by risk group. Kaplan-Meier survival curves illustrate the probability of remaining free of colorectal cancer (CRC) over time (years) for the high-risk group (blue line; recommended 3-year surveillance interval) and the low-risk group (red line; recommended 5-year surveillance interval). Both groups maintained CRC-free survival rates above 99% within guideline-recommended intervals. The high-risk group showed a gradual decline beyond 7 years, whereas the low-risk group remained relatively stable throughout the follow-up period; B: Kaplan-Meier estimates of event-free survival for CRC and advanced polyps by risk group. Kaplan-Meier survival curves illustrate the probability of remaining free of both CRC and advanced polyps over time (years) for the high-risk group (blue line; recommended 3-year surveillance interval) and the low-risk group (red line; recommended 5-year surveillance interval). Event-free survival declined more steeply in the high-risk group, falling below 80% at approximately 3-4 years. The low-risk group maintained event-free survival above 80% for up to 7-8 years, with a more gradual decline thereafter. The marked separation between curves supports risk-stratified surveillance interval recommendations.
- Citation: Pongprasobchai N, Kositamongkol C, Mepramoon E, Phisalprapa P. Incidence of colorectal cancer and advanced polyps by post-polypectomy surveillance interval: Real-world evidence from Thailand. World J Gastroenterol 2026; 32(47): 122370
- URL: https://www.wjgnet.com/1007-9327/full/v32/i47/122370.htm
- DOI: https://dx.doi.org/10.3748/wjg.122370