
















Copyright: ©Author(s) 2026.
World J Gastroenterol. Aug 28, 2026; 32(32): 120450
Published online Aug 28, 2026. doi: 10.3748/wjg.120450
Published online Aug 28, 2026. doi: 10.3748/wjg.120450
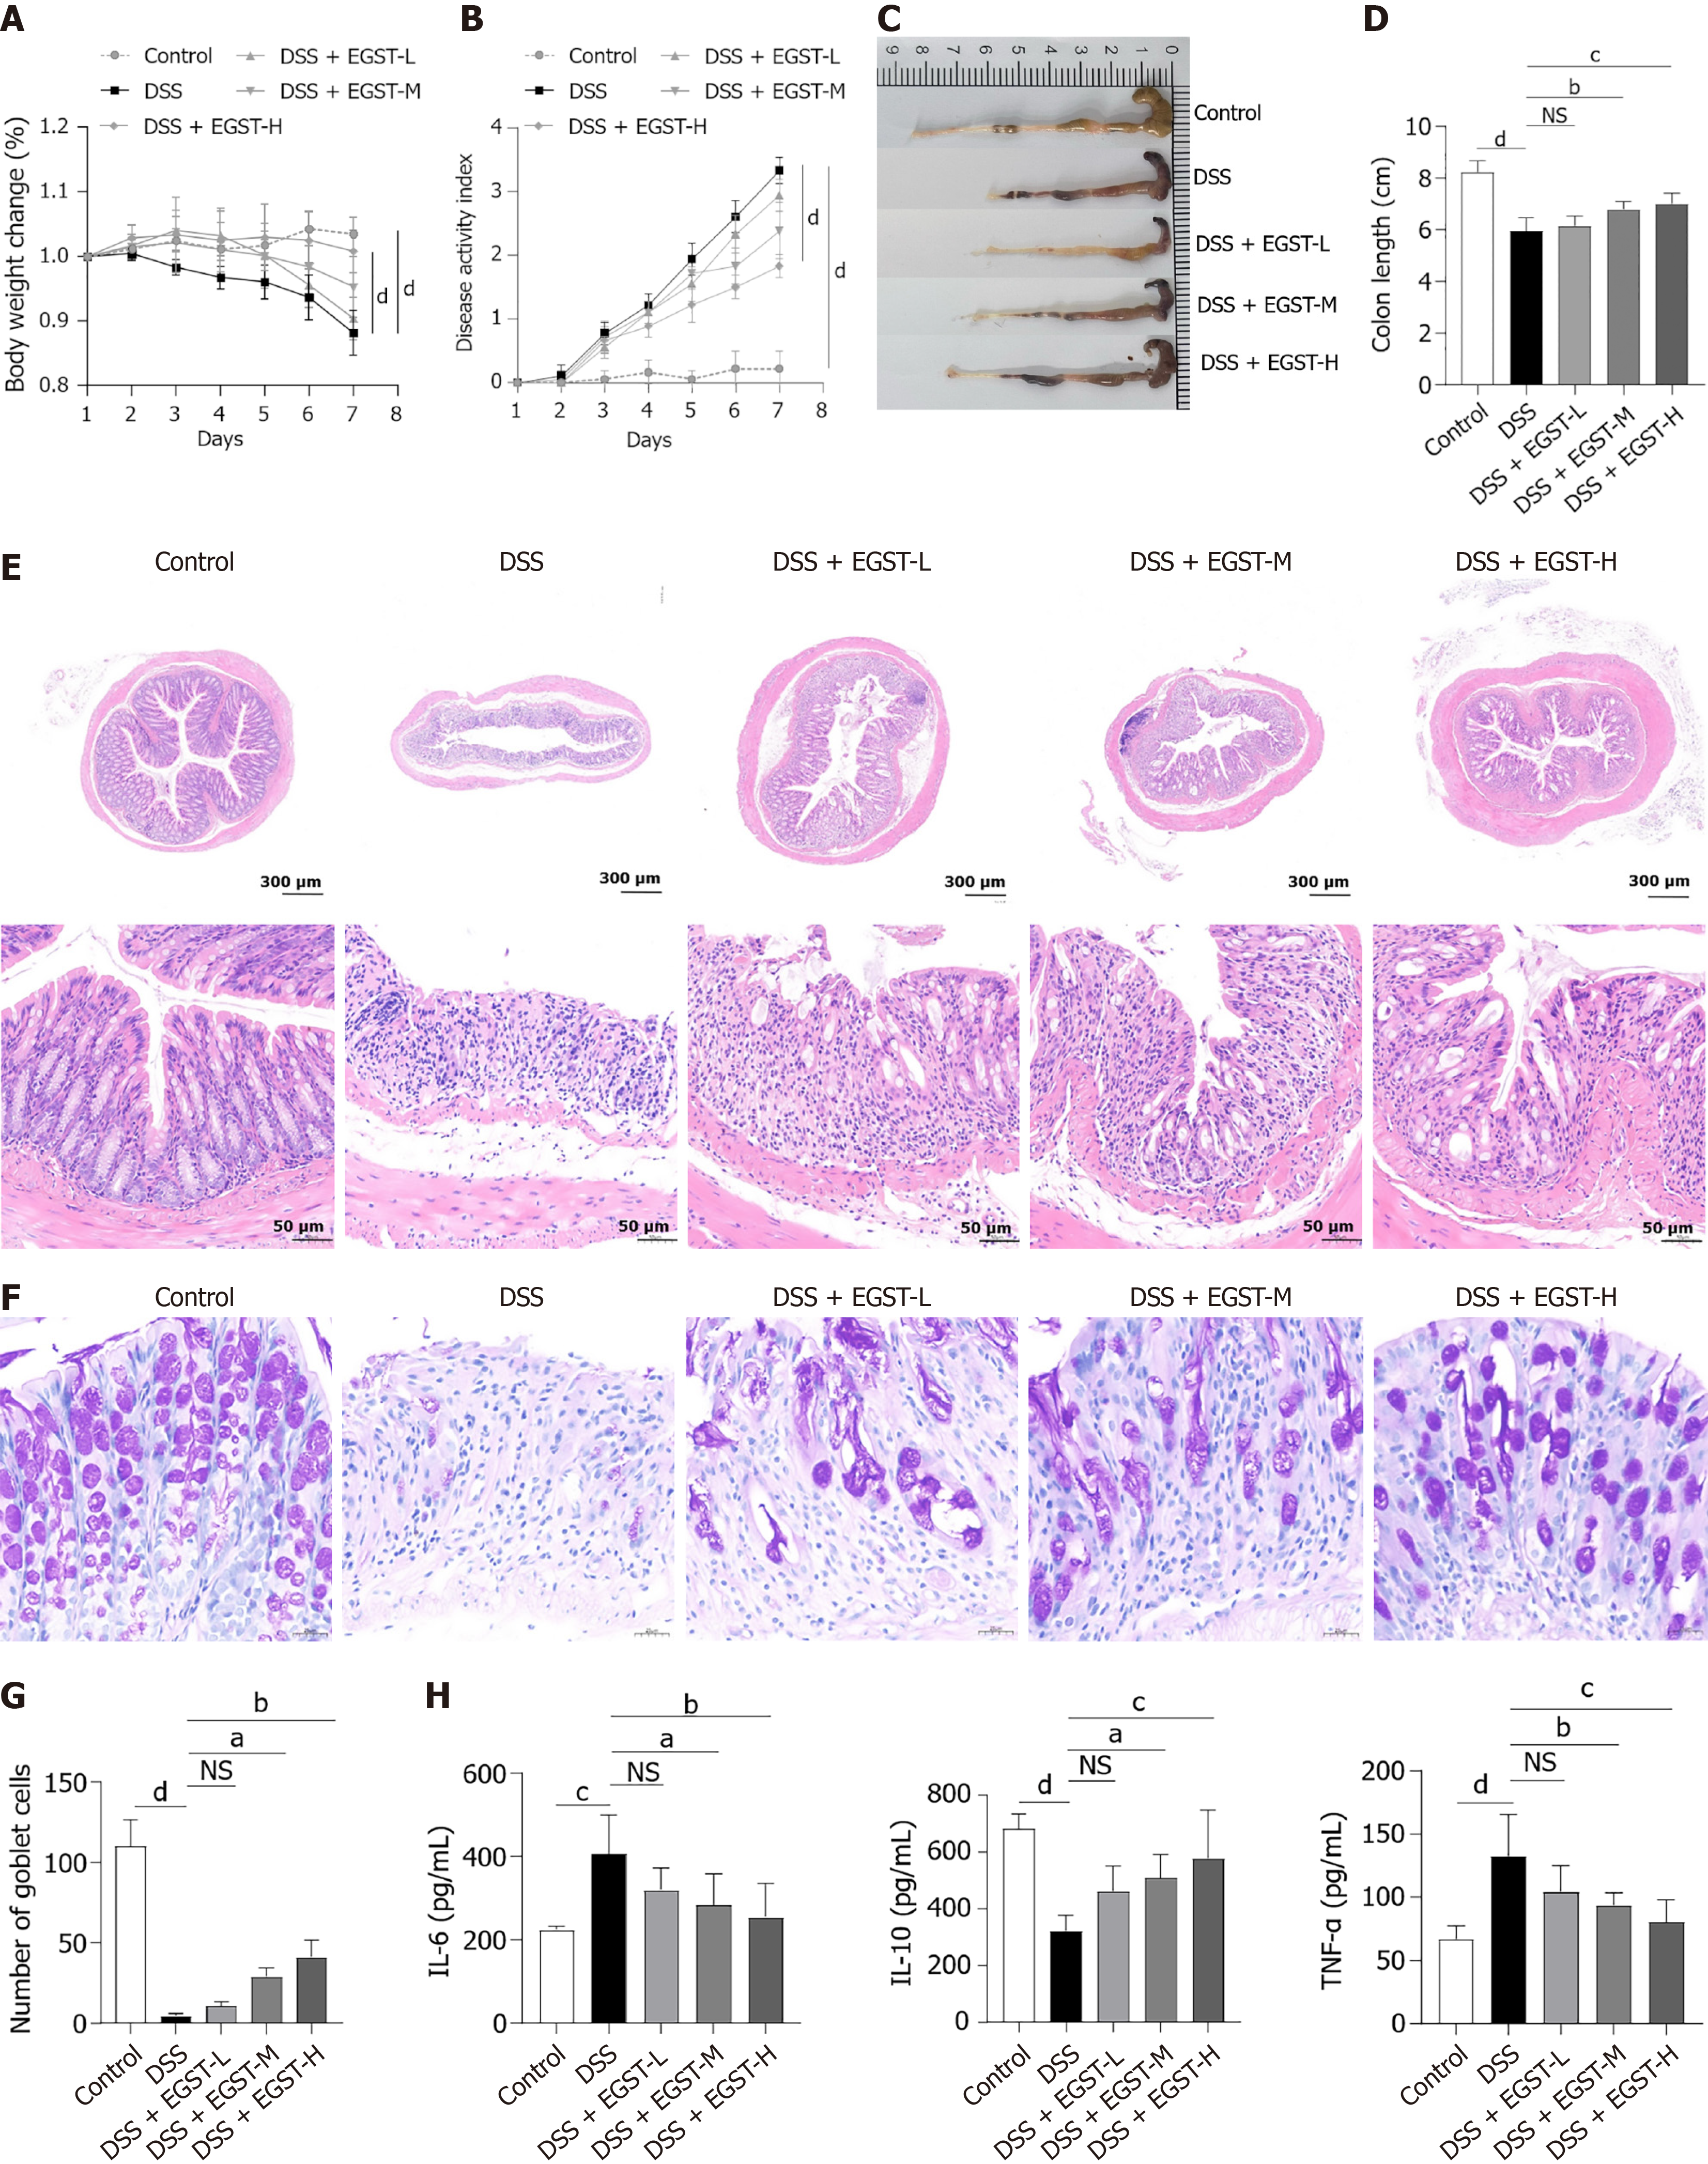
Figure 1 Extracts from Gleditsia sinensis thorns alleviates dextran sulfate sodium-induced colitis in mice.
A: Changes in body weight; B: Disease activity index scores; C: Representative images of the colon from each group of mice; D: Colon length measurement; E: Hematoxylin and eosin staining of colon tissue sections (40 × and 200 × magnifications); F: Periodic acid-Schiff staining (40 × magnification); G: Histogram showing periodic acid-Schiff staining results; H: Enzyme-linked immunosorbent assay analysis of serum interleukin-6, interleukin-10, and tumor necrosis factor-α levels. Data are presented as mean ± SD (n = 6). aP < 0.05, bP < 0.01, cP < 0.001, and dP < 0.0001. DSS: Dextran sulfate sodium; EGST: Extracts from Gleditsia sinensis thorns; NS: Not significant.
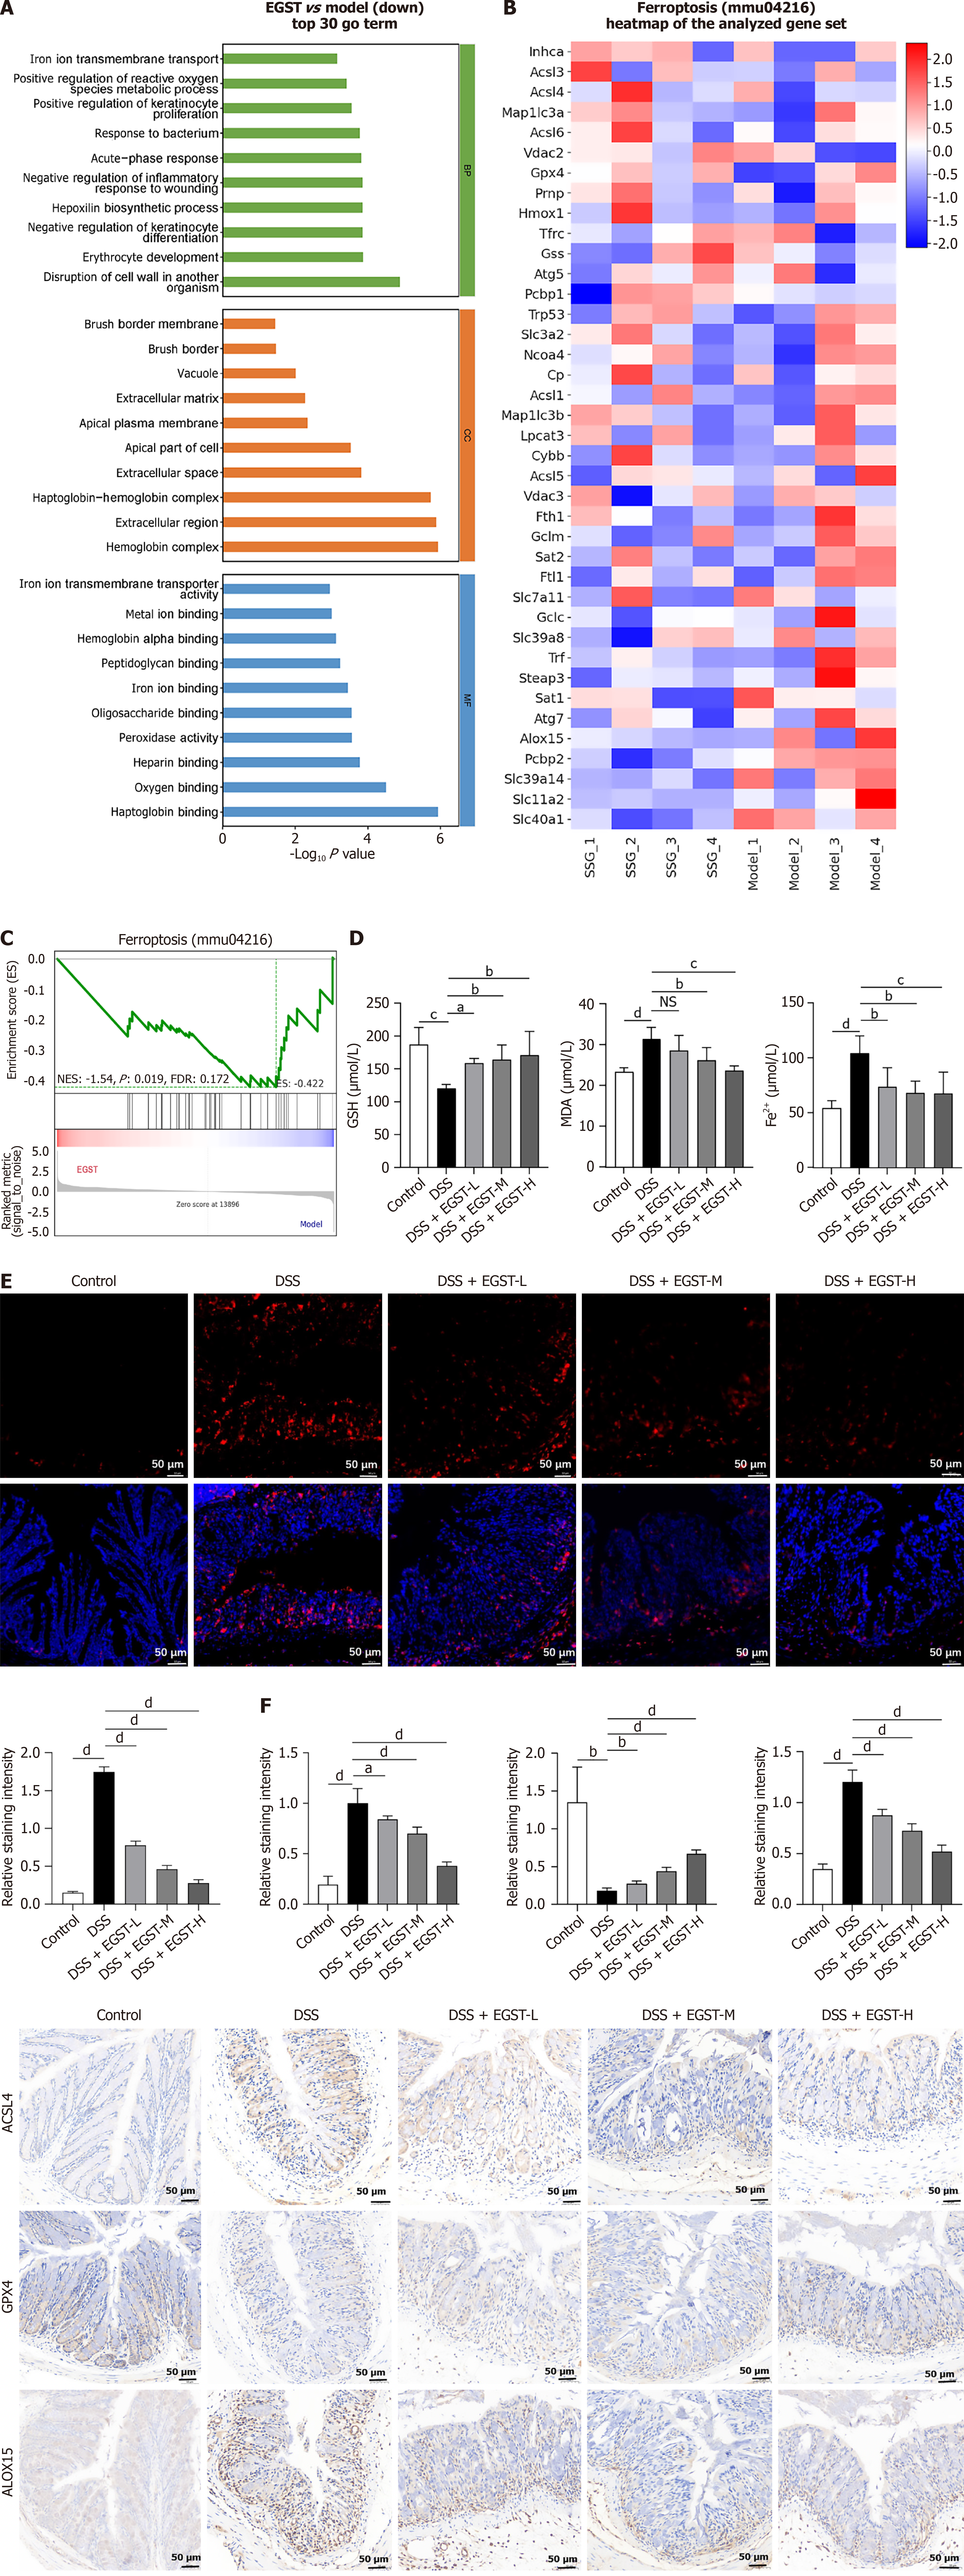
Figure 2 Extracts from Gleditsia sinensis thorns lowers the incidence of ferroptosis in mice induced by dextran sulfate sodium.
A: Gene ontology enrichment analysis showing significant differences (top 10 ranking by biological process, cellular component, and molecular function); B: Heatmap of key differential genes in ferroptosis; C: Gene set enrichment analysis results, with each line marking the position of the gene in the gene set; D: Serum levels of glu
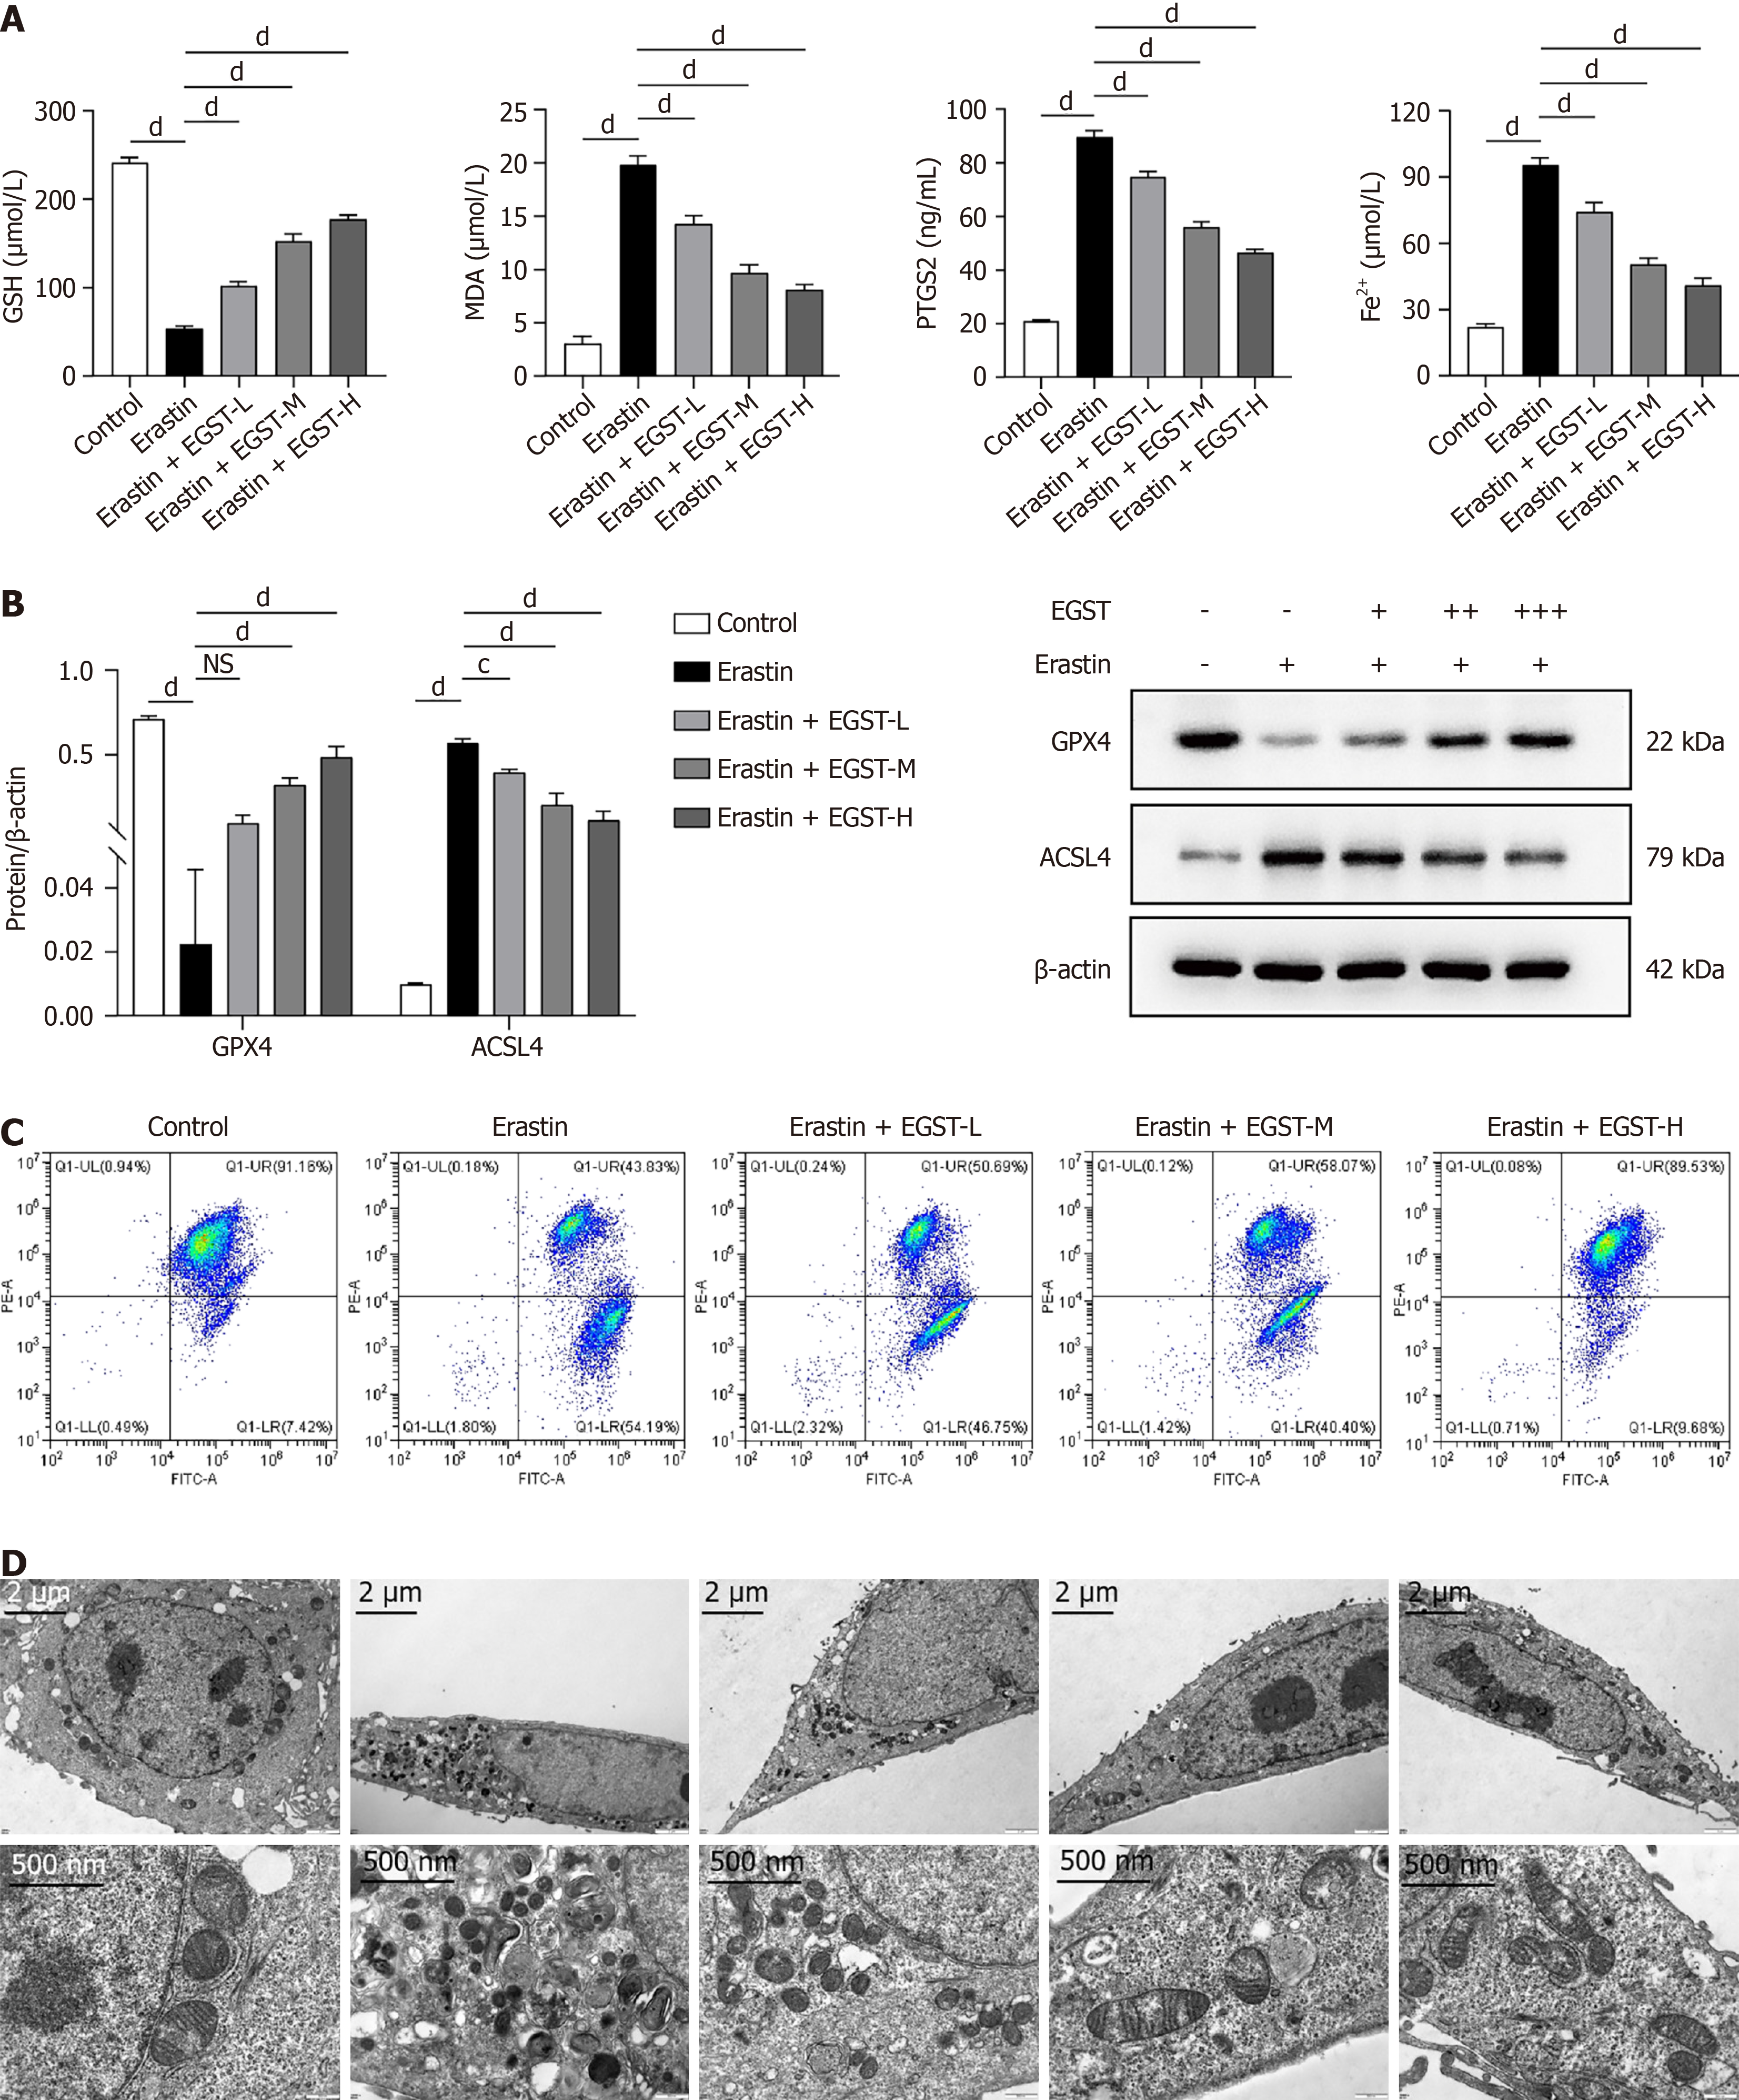
Figure 3 Extracts from Gleditsia sinensis thorns hinders the ferroptosis caused by erastin in Caco-2 cells.
A: Levels of glutathione, malondialdehyde, prostaglandin-endoperoxide synthase 2, and Fe2+ in Caco-2 cells; B: Expression of acyl-CoA ligase 4 and glutathione peroxidase 4 proteins in Caco-2 cells; C: Mitochondrial membrane potential changes assessed by JC-1 flow cytometry; D: Transmission electron microscopy imaging showing mitochondrial morphology. Data are presented as mean ± SD (n = 3). cP < 0.001, and dP < 0.0001. EGST: Extracts from Gleditsia sinensis thorns; NS: Not significant; GSH: Glutathione; MDA: Malondialdehyde; ACLS4: Acyl-CoA ligase 4.
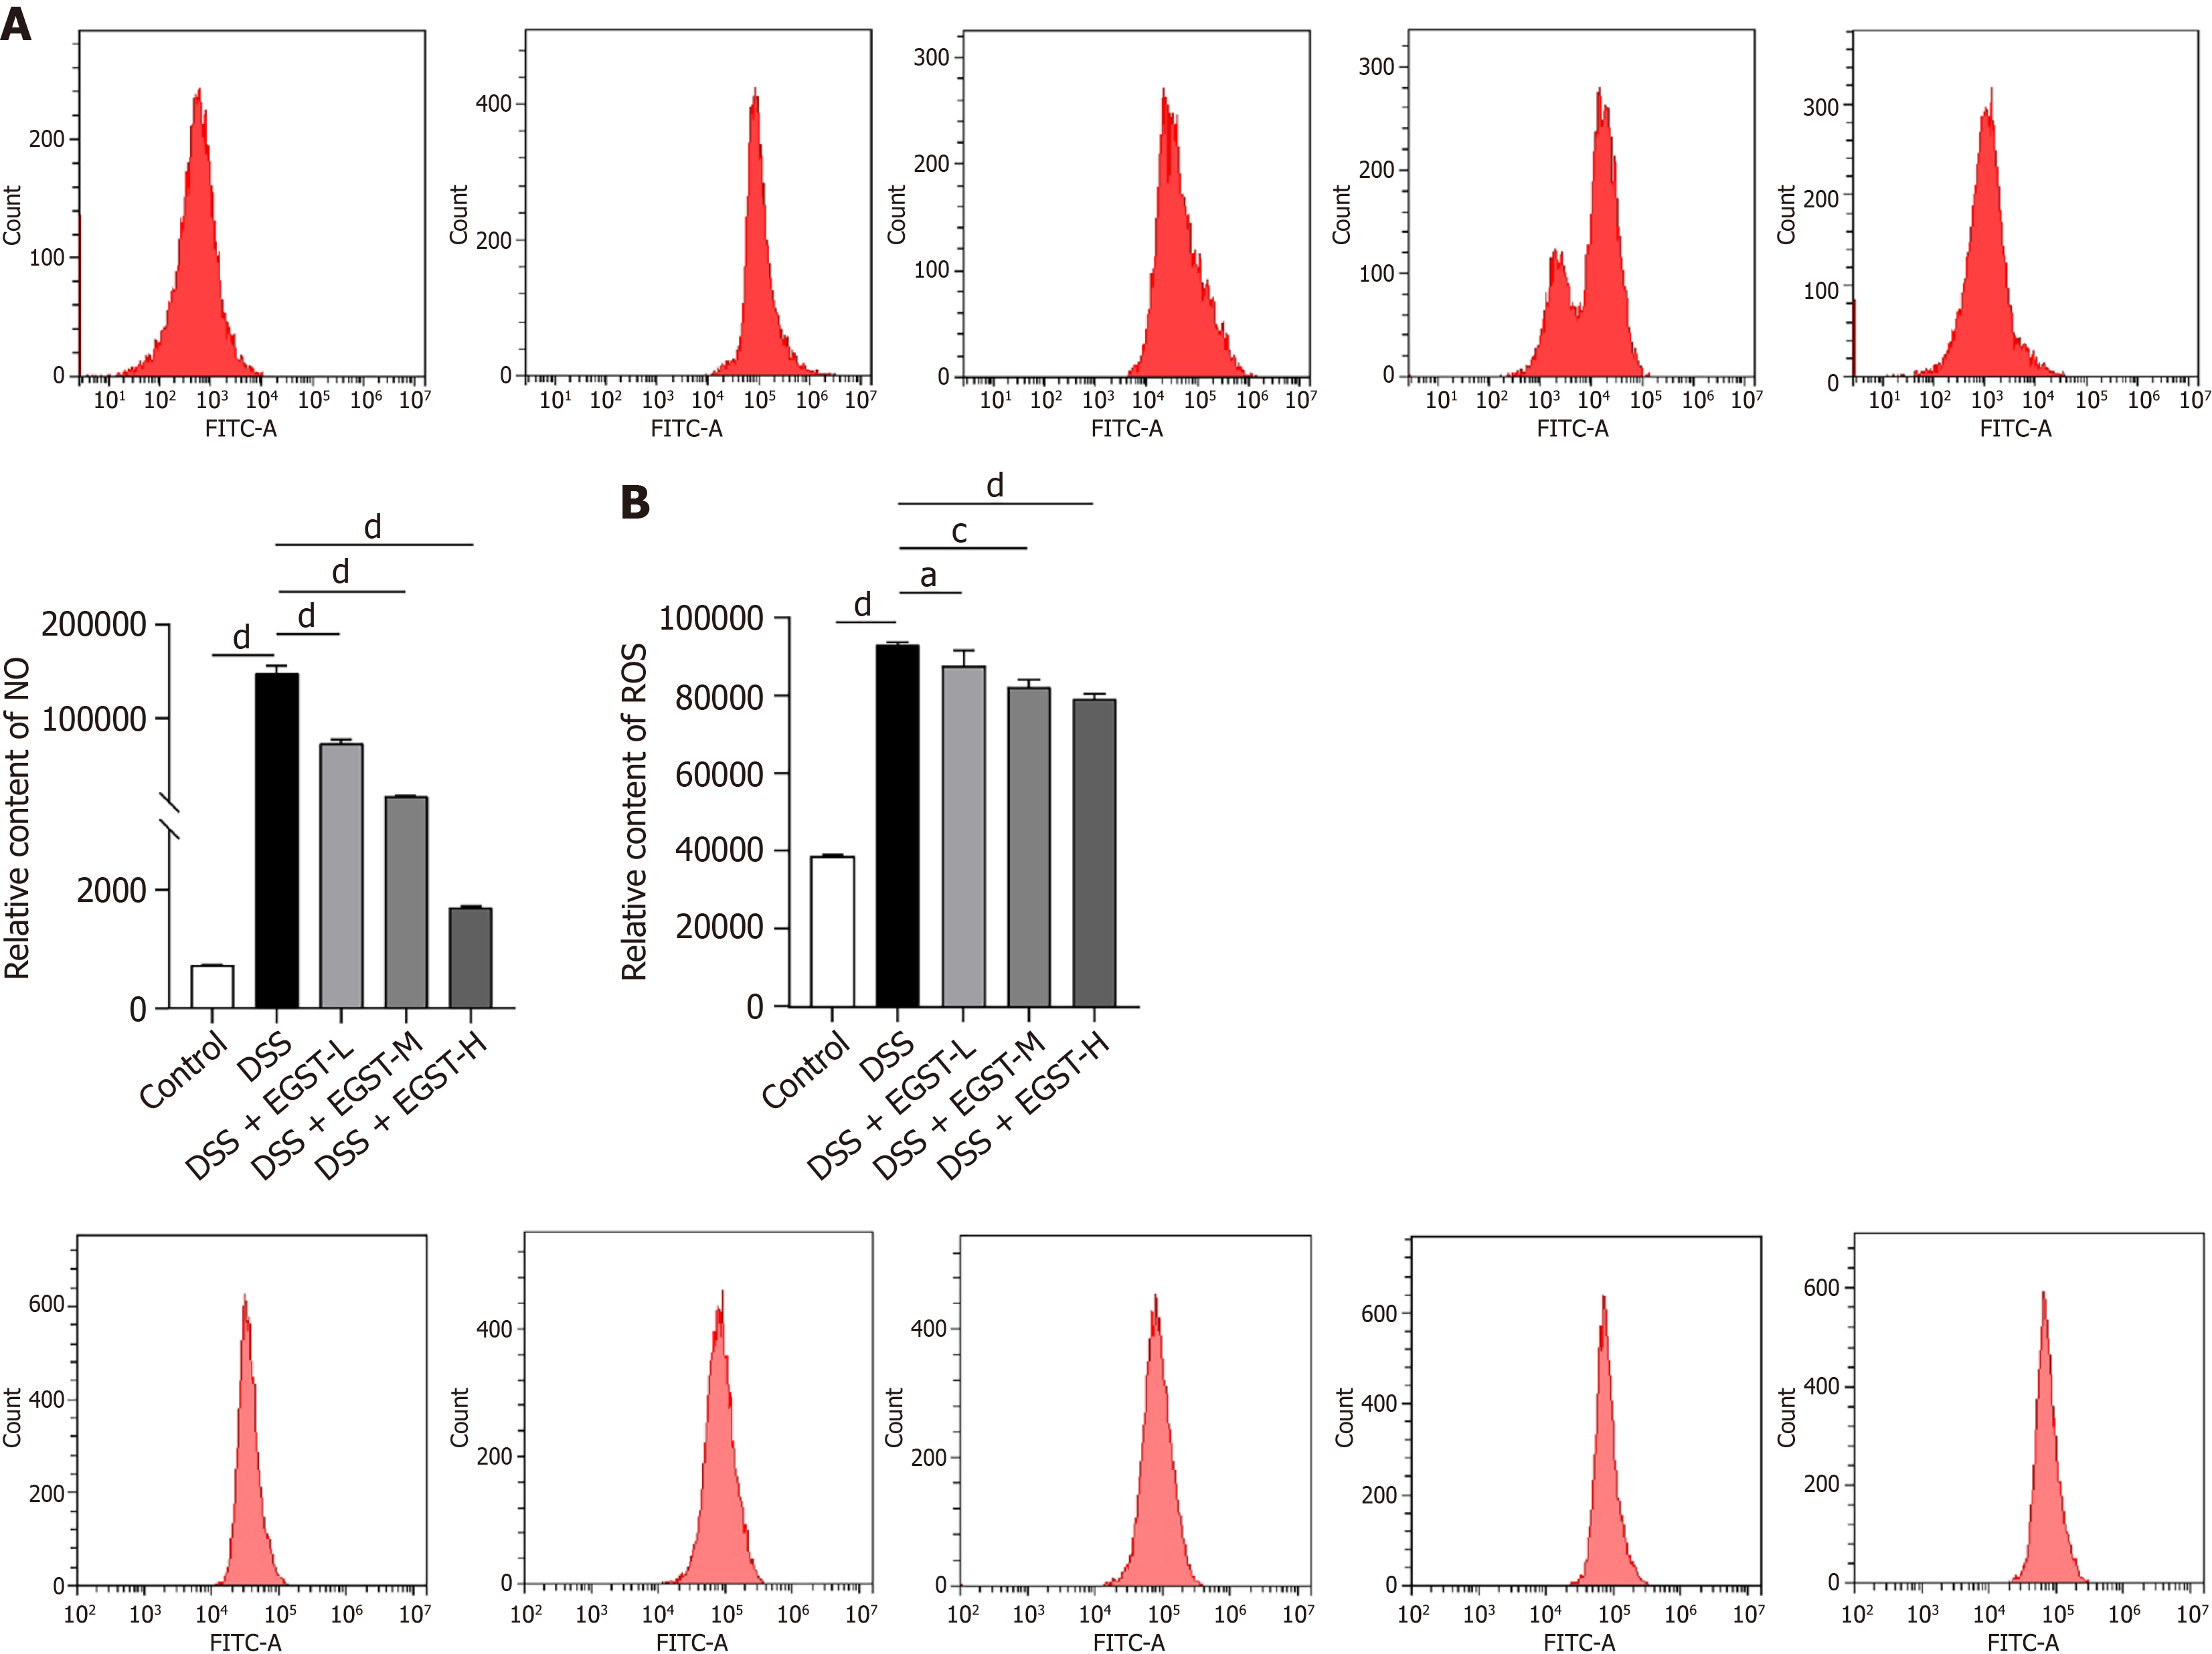
Figure 4 Extracts from Gleditsia sinensis thorns reduces lipid peroxidation by inhibiting the generation of nitric oxide and reactive oxygen species.
A: Detection of nitric oxide levels in Caco-2 cells by flow cytometry; B: Detection of reactive oxygen species levels in Caco-2 cells by flow cytometry. Data are presented as mean ± SD (n = 3). aP < 0.05, cP < 0.001, and dP < 0.0001. DSS: Dextran sulfate sodium; EGST: Extracts from Gleditsia sinensis thorns; NO: Nitric oxide; ROS: Reactive oxygen species.
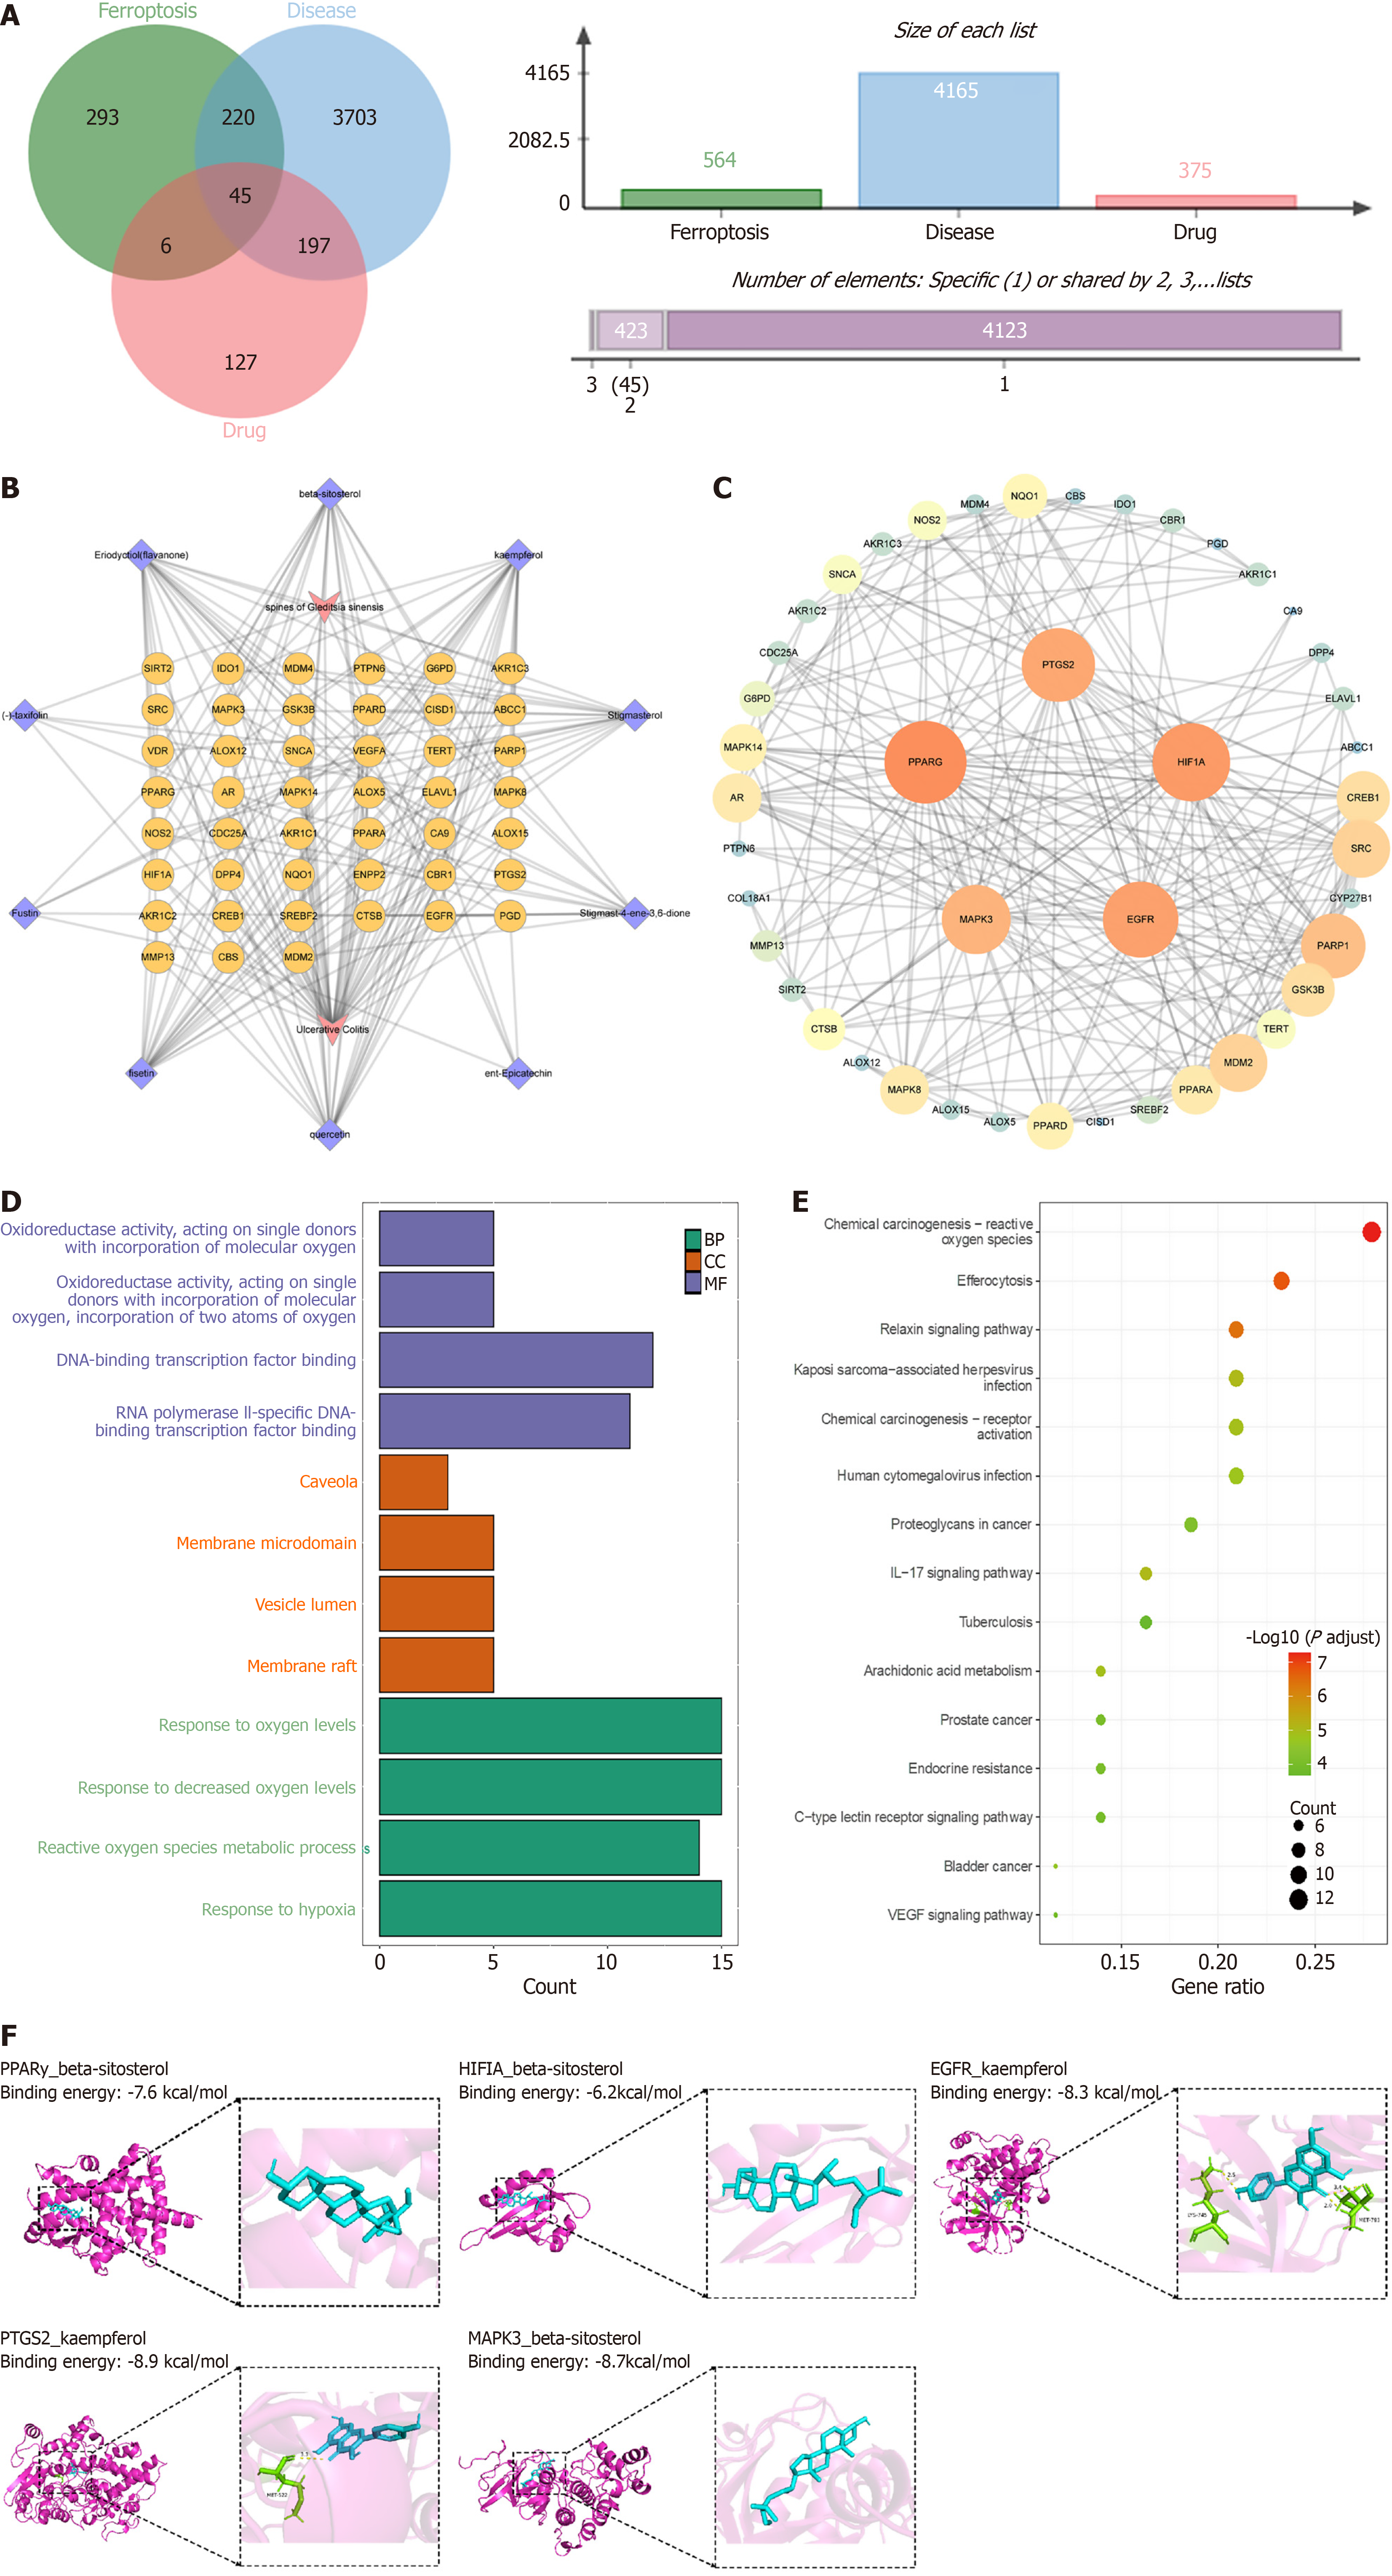
Figure 5 Network pharmacology and molecular docking analysis of extracts from Gleditsia sinensis thorns.
A: Venn diagram illustrating the intersection of genes related to ulcerative colitis, extracts from Gleditsia sinensis thorns, and ferroptosis; B: “Target-Disease-Drug” interaction network; C: Protein-protein interaction network; D: Gene Ontology enrichment analysis showing the top 4 enriched terms in each module (ranked by adjusted P value); E: Kyoto Encyclopedia of Genes and Genomes pathway analysis; F: Molecular docking results of extracts from Gleditsia sinensis thorns with protein targets. BP: Biological process; CC: Cellular component; MF: Molecular function.
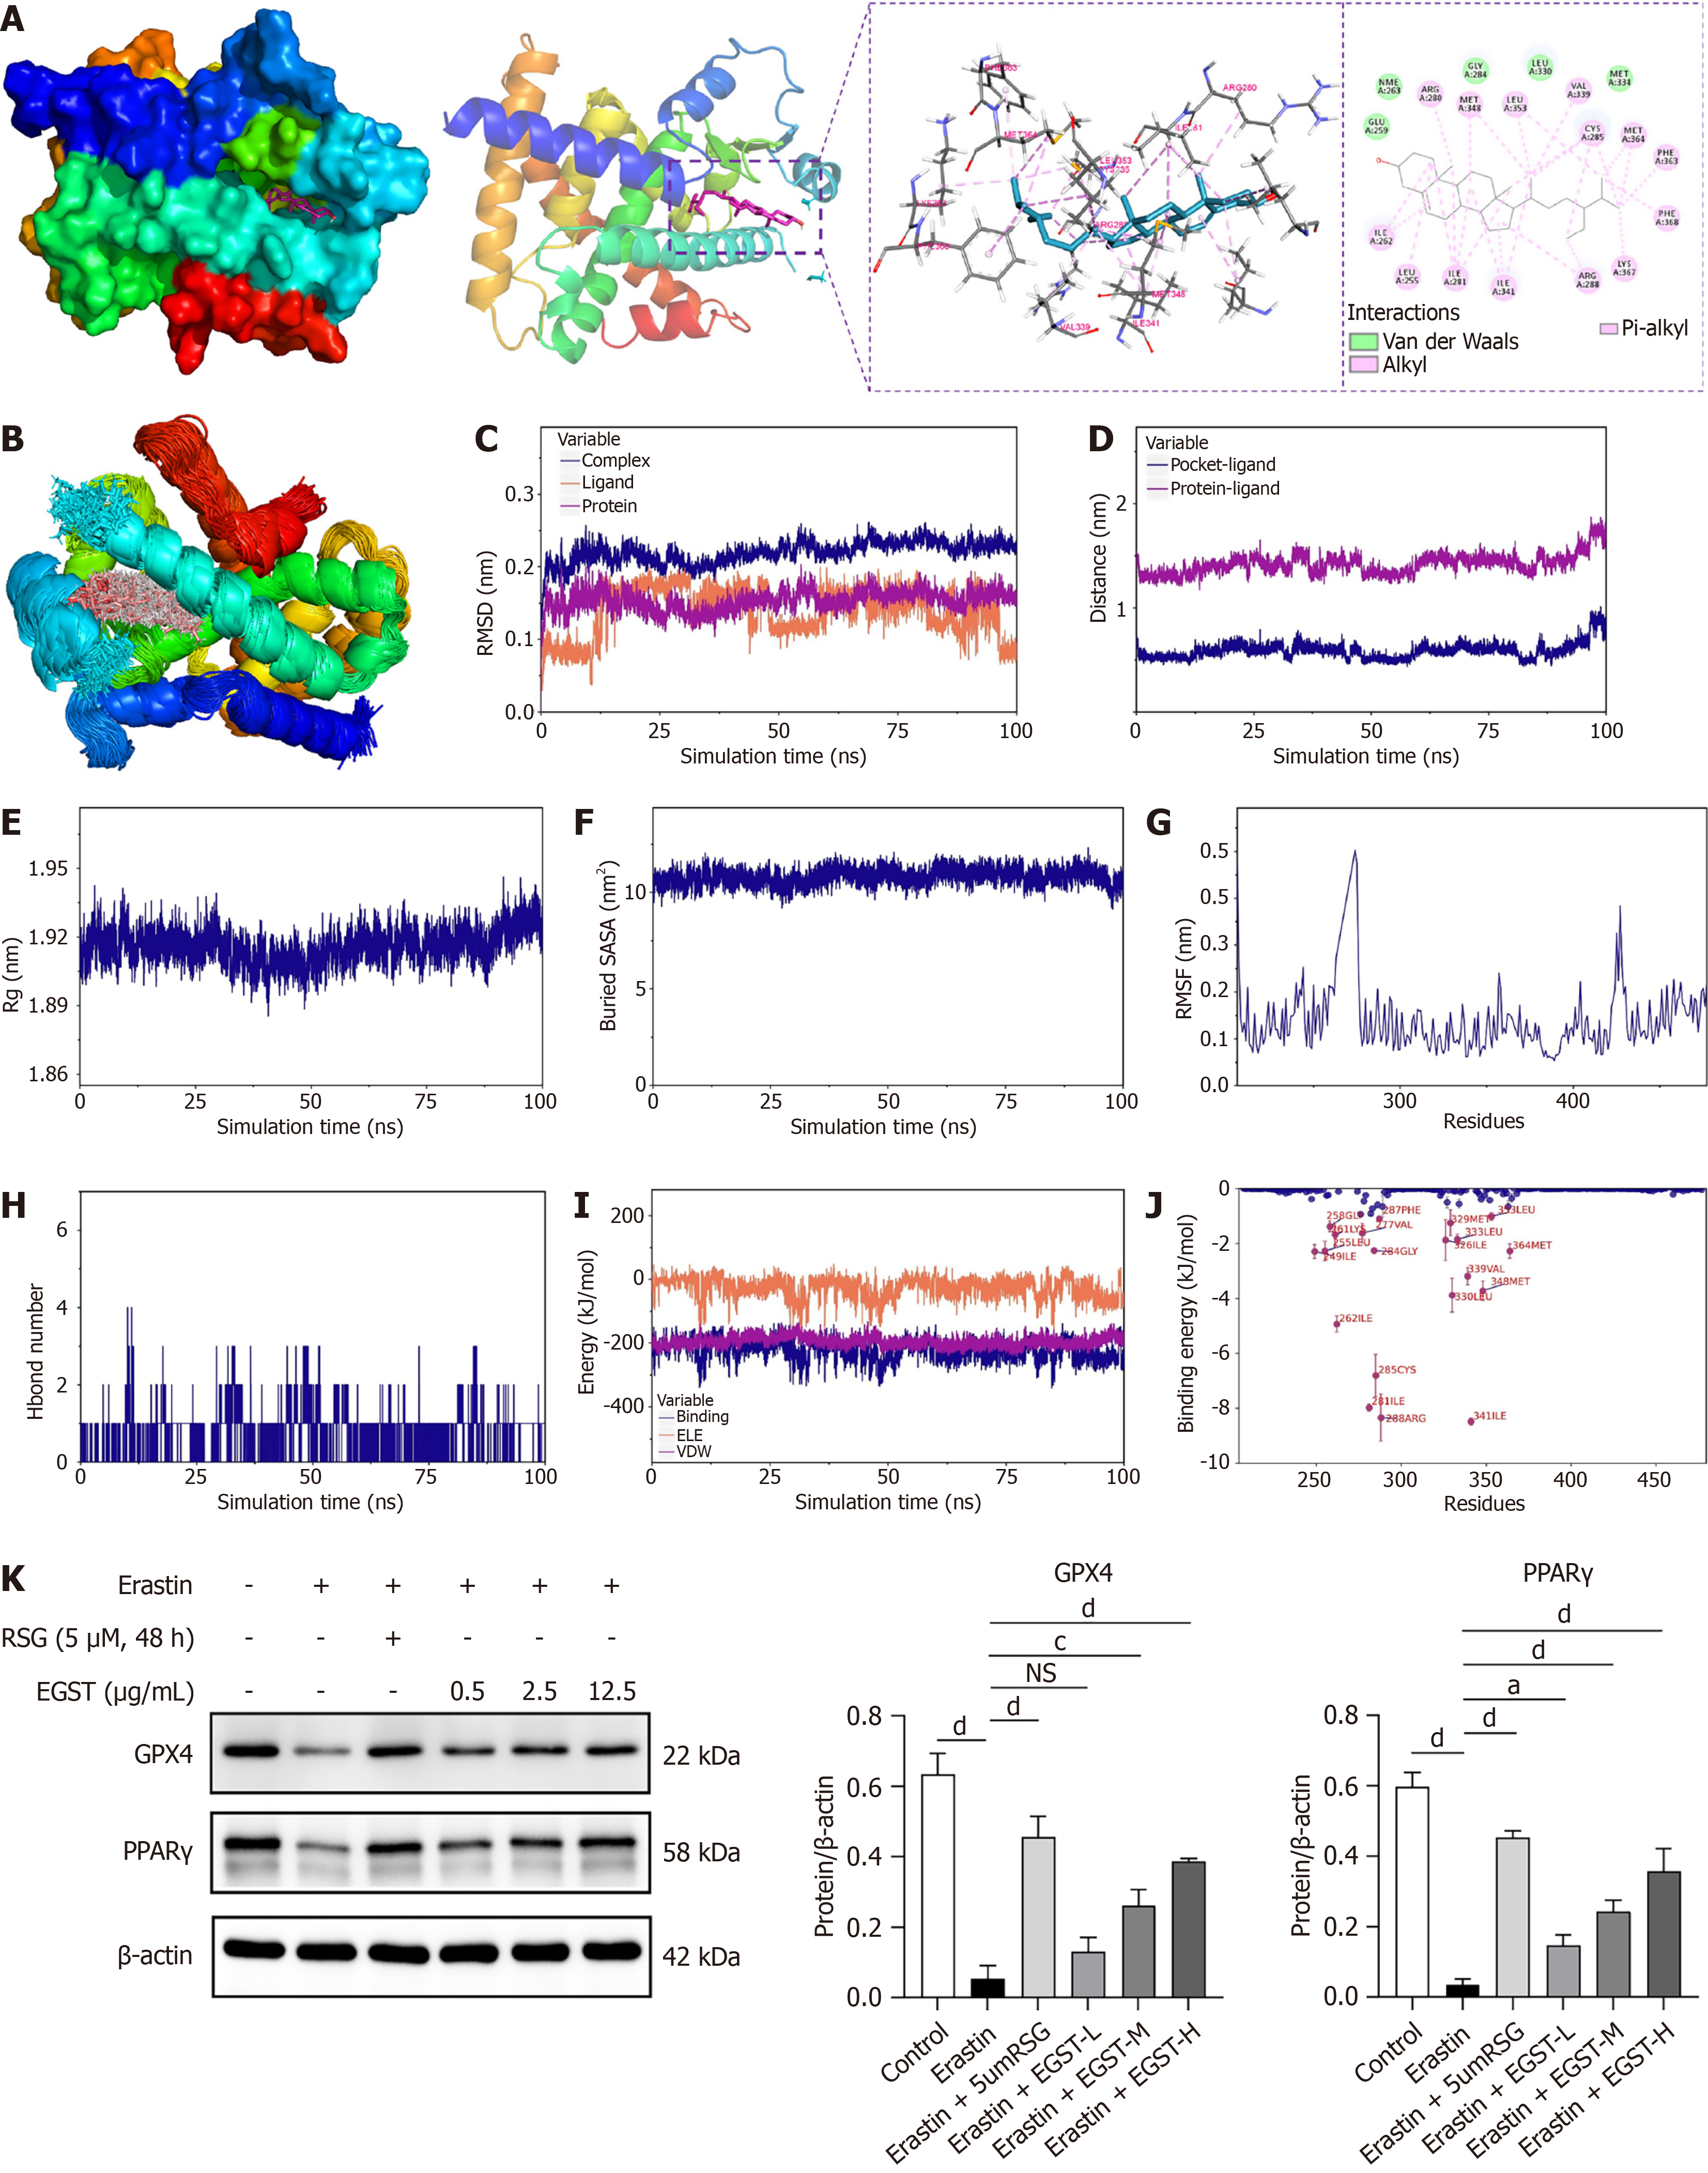
Figure 6 Molecular dynamics simulation and western blot analysis of PPARγ and glutathione peroxidase 4.
A: Molecular docking mode of beta-sitosterol with peroxisome proliferator-activated receptor gamma (PPARγ); B: 3D representation of beta-sitosterol; C: Root means square deviation between beta-sitosterol and PPARγ; D: Distance analysis between beta-sitosterol and PPARγ; E: Radius of gyration of beta-sitosterol and PPARγ; F: Solvent-accessible surface area analysis; G: Root means square fluctuation analysis of beta-sitosterol vs PPARγ; H: Hydrogen bond analysis between RhoA and AT-1; I: Binding energy analysis; J: Amino acid binding energy contribution ranking; K: Western blot analysis of PPARγ and glutathione peroxidase 4 protein expression following extracts from Gleditsia sinensis thorns and rosiglitazone treatment. Data are presented as mean ± SD (n = 3). aP < 0.05, cP < 0.001, and dP < 0.0001. DSS: Dextran sulfate sodium; EGST: Extracts from Gleditsia sinensis thorns; NS: Not significant; RSG: Rosiglitazone; GPX4: Glutathione peroxidase 4; PPARγ: Peroxisome proliferator-activated receptor gamma.
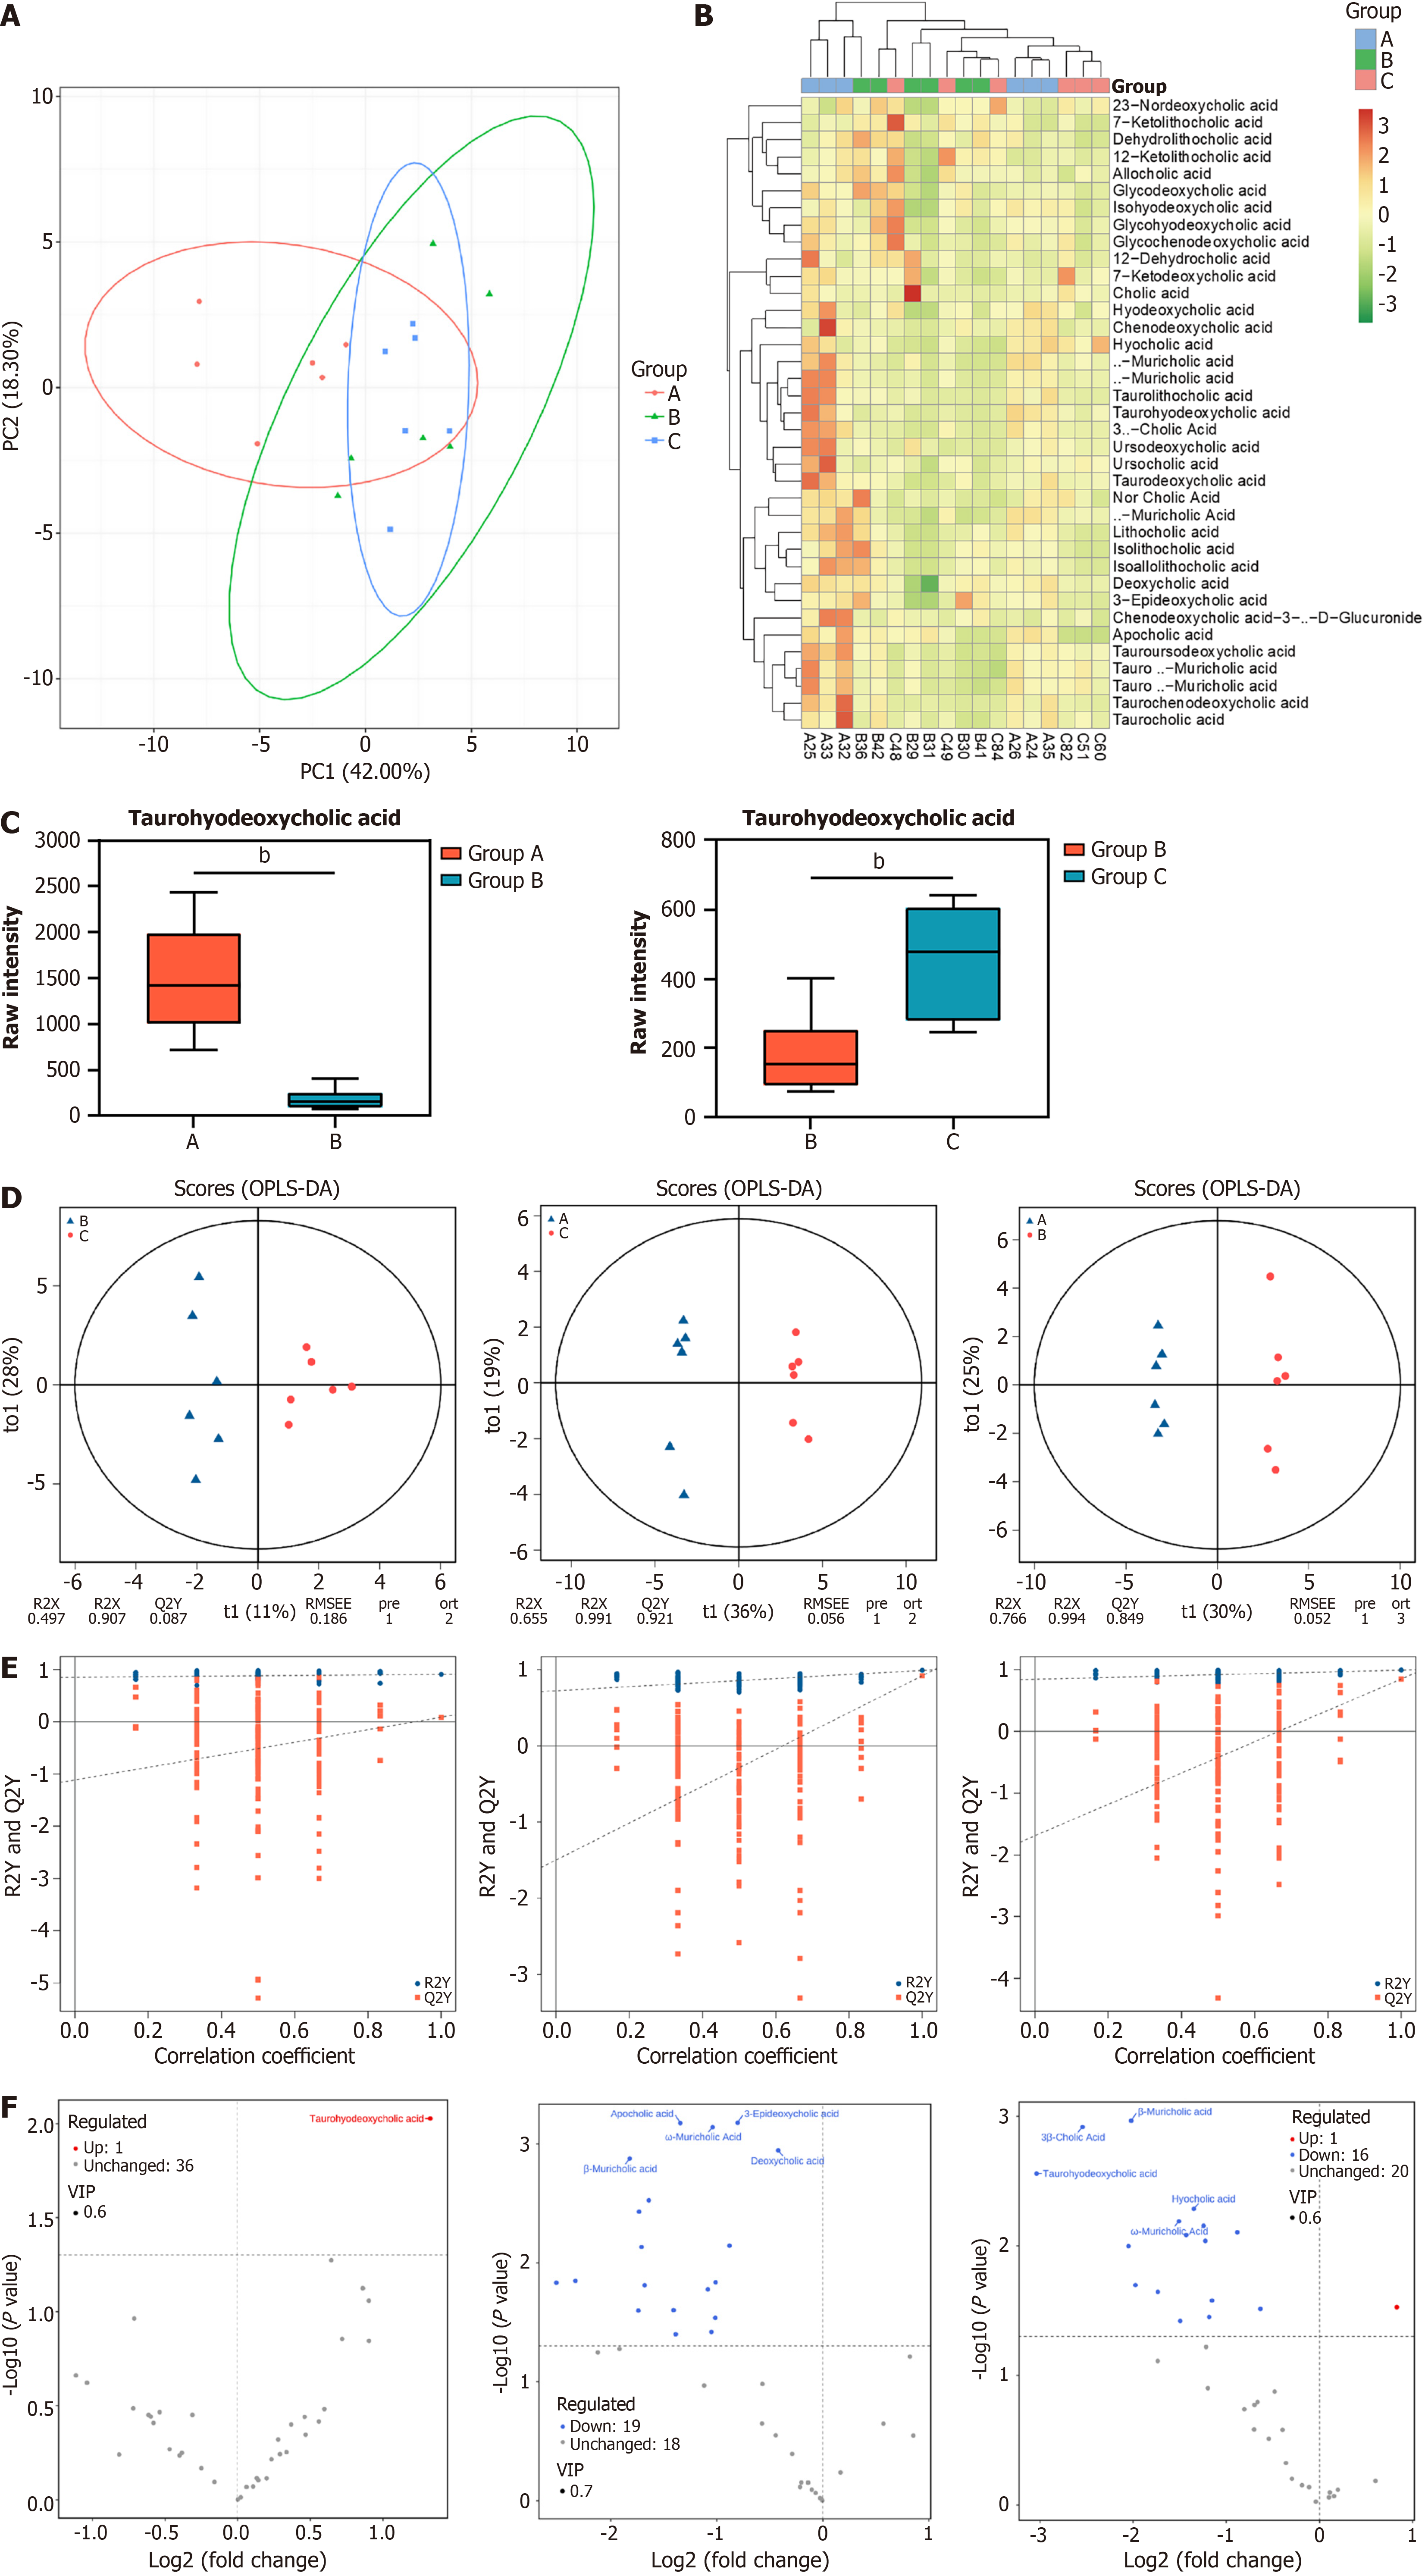
Figure 7 Metabolomic profiling analysis of bile acids in mouse colon.
A: Principal component analysis of all samples. Each point represents a sample, with samples from different groups labeled in different colors; B: Clustering heatmap showing the overall sample distribution; C: Comparison of taurohyodeoxycholic acid levels between different groups; D: Orthogonal partial least squares-discriminant analysis score plots of dextran sulfate sodium (DSS) vs extracts from Gleditsia sinensis thorns (EGST), control vs EGST, and control vs DSS groups; E: Permutation test plots of orthogonal partial least squares-discriminant analysis models for different groups; F: Volcano plots of differential metabolites comparing DSS vs EGST, control vs EGST, and control vs DSS groups. In the figures, 18 mice were randomly allocated to three groups: Control (A), DSS (B), and EGST-H (C).
- Citation: Zhuo ZY, Guo XY, Liu XM, Shang MM, Xue S, Peng L, Guo ZG. Extracts of Gleditsia sinensis Lam. thorn ameliorates ulcerative colitis through PPARγ/GPX4 pathway-mediated inhibition of enterocyte ferroptosis. World J Gastroenterol 2026; 32(32): 120450
- URL: https://www.wjgnet.com/1007-9327/full/v32/i32/120450.htm
- DOI: https://dx.doi.org/10.3748/wjg.120450