
















Copyright: ©Author(s) 2026.
World J Gastroenterol. Jul 28, 2026; 32(28): 121267
Published online Jul 28, 2026. doi: 10.3748/wjg.121267
Published online Jul 28, 2026. doi: 10.3748/wjg.121267
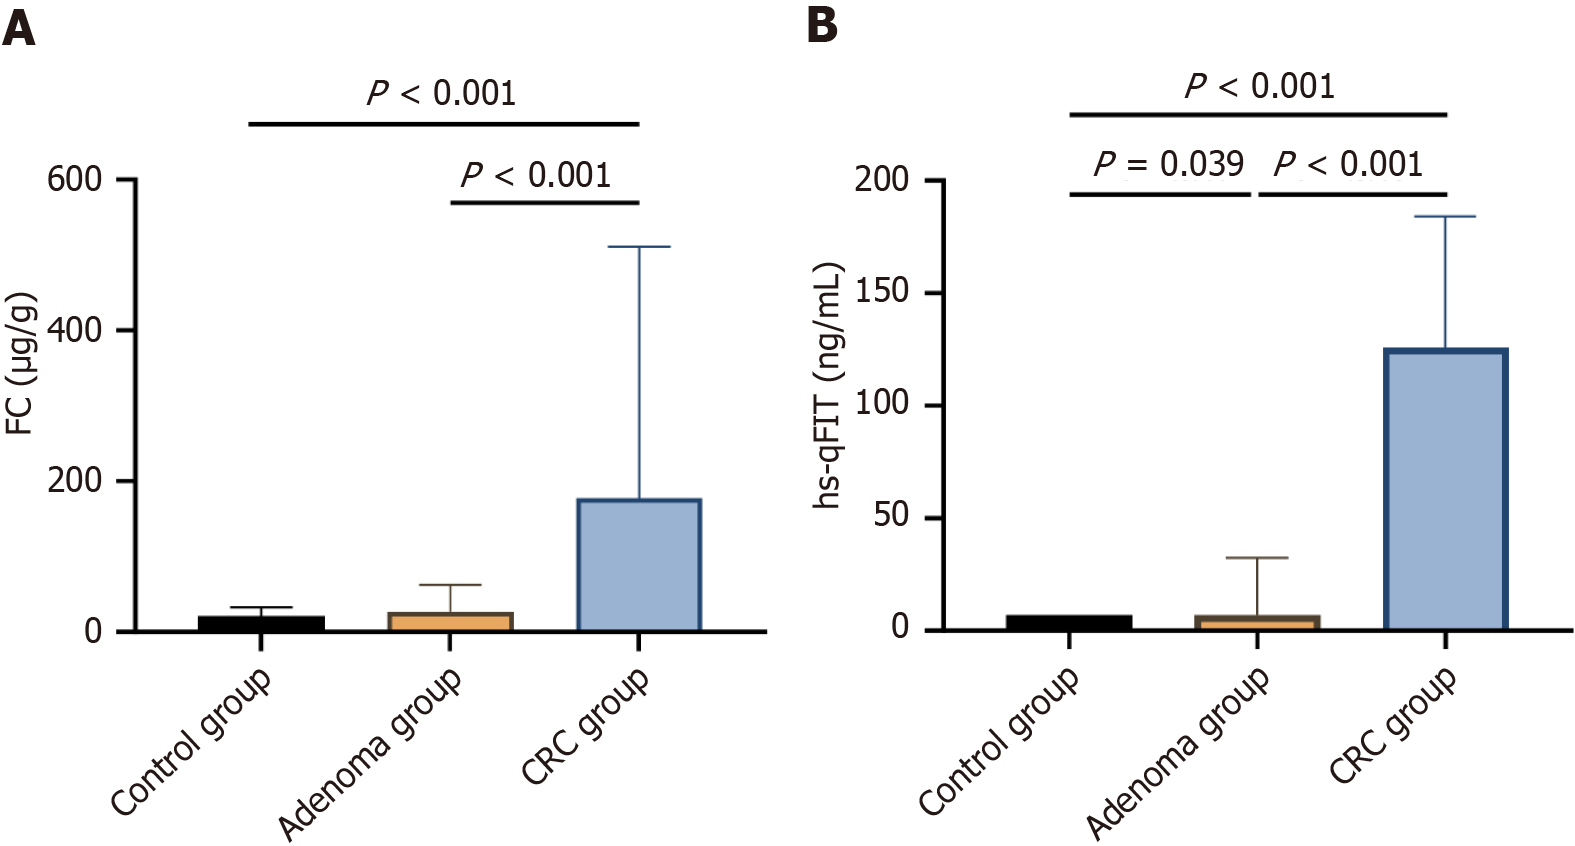
Figure 1 The distribution of fecal calprotectin and high-sensitivity quantitative fecal immunochemical test in the control, adenoma, and colorectal cancer groups.
A: The difference in fecal calprotectin (FC) between the control group and the adenoma group was not significant (adjusted P = 0.547 > 0.05 after Bonferroni correction). Significant differences in FC were found between the control group and the colorectal cancer (CRC) group, as well as between the adenoma group and the CRC group (P < 0.001), with FC levels in the CRC group being significantly higher than those in the control group and the adenoma group; B: Significant differences were observed between the control group and the adenoma group (adjusted P = 0.039 < 0.05 after Bonferroni correction), as well as between the control group and the CRC group, and between the adenoma group and the CRC group (P < 0.001). High-sensitivity quantitative fecal immunochemical test levels in the CRC group were significantly higher than those in the control group and the adenoma group. FC: Fecal calprotectin; CRC: Colorectal cancer; hs-qFIT: High-sensitivity quantitative fecal immunochemical test.
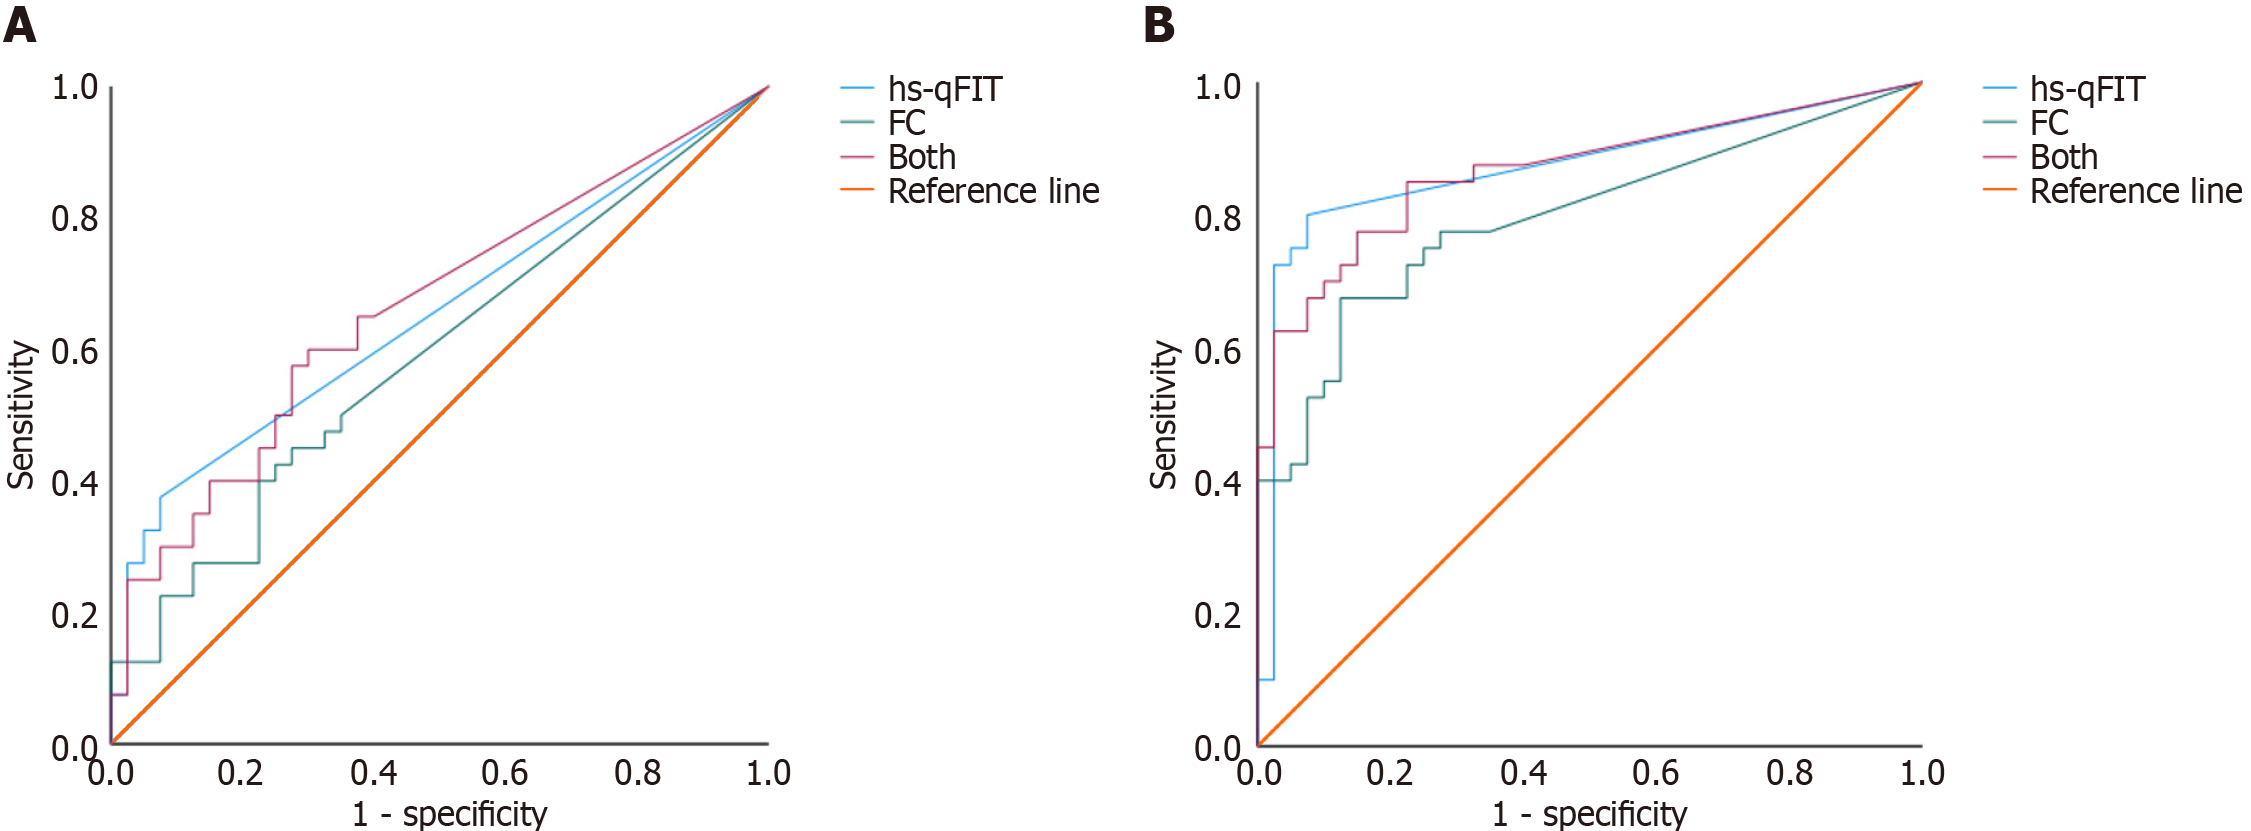
Figure 2 Receiver operating characteristic curves of fecal calprotectin, high-sensitivity quantitative fecal immunochemical test, and their combination.
A: Diagnosing adenomas. The area under the receiver operating characteristic curve (AUC) value of fecal calprotectin (FC) for diagnosing adenoma was 0.591 [95% confidence interval (CI): 0.466-0.716], the AUC value of high-sensitivity quantitative fecal immunochemical test (hs-qFIT) for diagnosing adenoma was 0.653 (95%CI: 0.532-0.774), and the AUC value of the combination of the two for diagnosing adenoma was 0.662 (95%CI: 0.543-0.782); B: Diagnosing colorectal cancer (CRC). The AUC value of FC for diagnosing CRC was 0.797 (95%CI: 0.697-0.897), the AUC value of hs-qFIT for diagnosing CRC was 0.872 (95%CI: 0.786-0.958), and the AUC value of the combination of the two for diagnosing CRC was 0.866 (95%CI: 0.784-0.949). FC: Fecal calprotectin; hs-qFIT: High-sensitivity quantitative fecal immunochemical test.
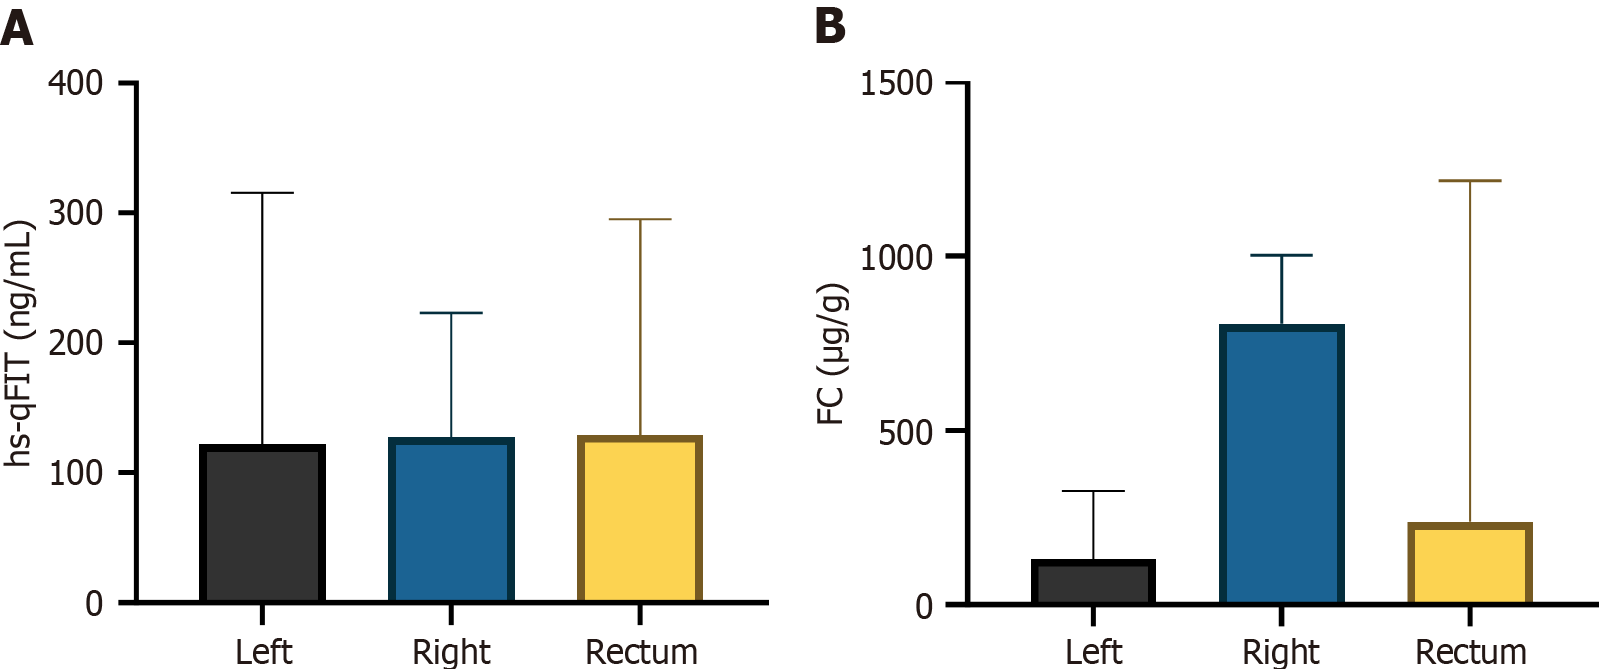
Figure 3 Distribution differences in left-sided colon, right-sided colon, and rectum.
A: High-sensitivity quantitative fecal immunochemical test (hs-qFIT). Hs-qFIT levels were 1222 ng/mL (9-185.2 ng/mL) in left-sided colon cancer, 127.2 ng/mL (24.3-165.1 ng/mL) in right-sided colon cancer, and 129.5 ng/mL (25.4-181 ng/mL) in rectal cancer; B: Fecal calprotectin (FC). FC levels were 1324 μg/g (21.2-326.9 μg/g) in left-sided colon cancer, 807.1 μg/g (21.2-1002.7 μg/g) in right-sided colon cancer, and 238.6 μg/g (76.4-1217 μg/g) in rectal cancer. FC: Fecal calprotectin; hs-qFIT: High-sensitivity quantitative fecal immunochemical test.
- Citation: Jing W, Qin L, Zhang XH, Pan F, Ren RR, Li Y, Zhang Y, Peng LH, Wang ZK, Zhang XL. Diagnostic efficacy of fecal calprotectin combined with a high-sensitivity quantitative fecal immunochemical test for colorectal tumors. World J Gastroenterol 2026; 32(28): 121267
- URL: https://www.wjgnet.com/1007-9327/full/v32/i28/121267.htm
- DOI: https://dx.doi.org/10.3748/wjg.121267