
















Copyright: ©Author(s) 2026.
World J Gastroenterol. Jul 21, 2026; 32(27): 119276
Published online Jul 21, 2026. doi: 10.3748/wjg.119276
Published online Jul 21, 2026. doi: 10.3748/wjg.119276
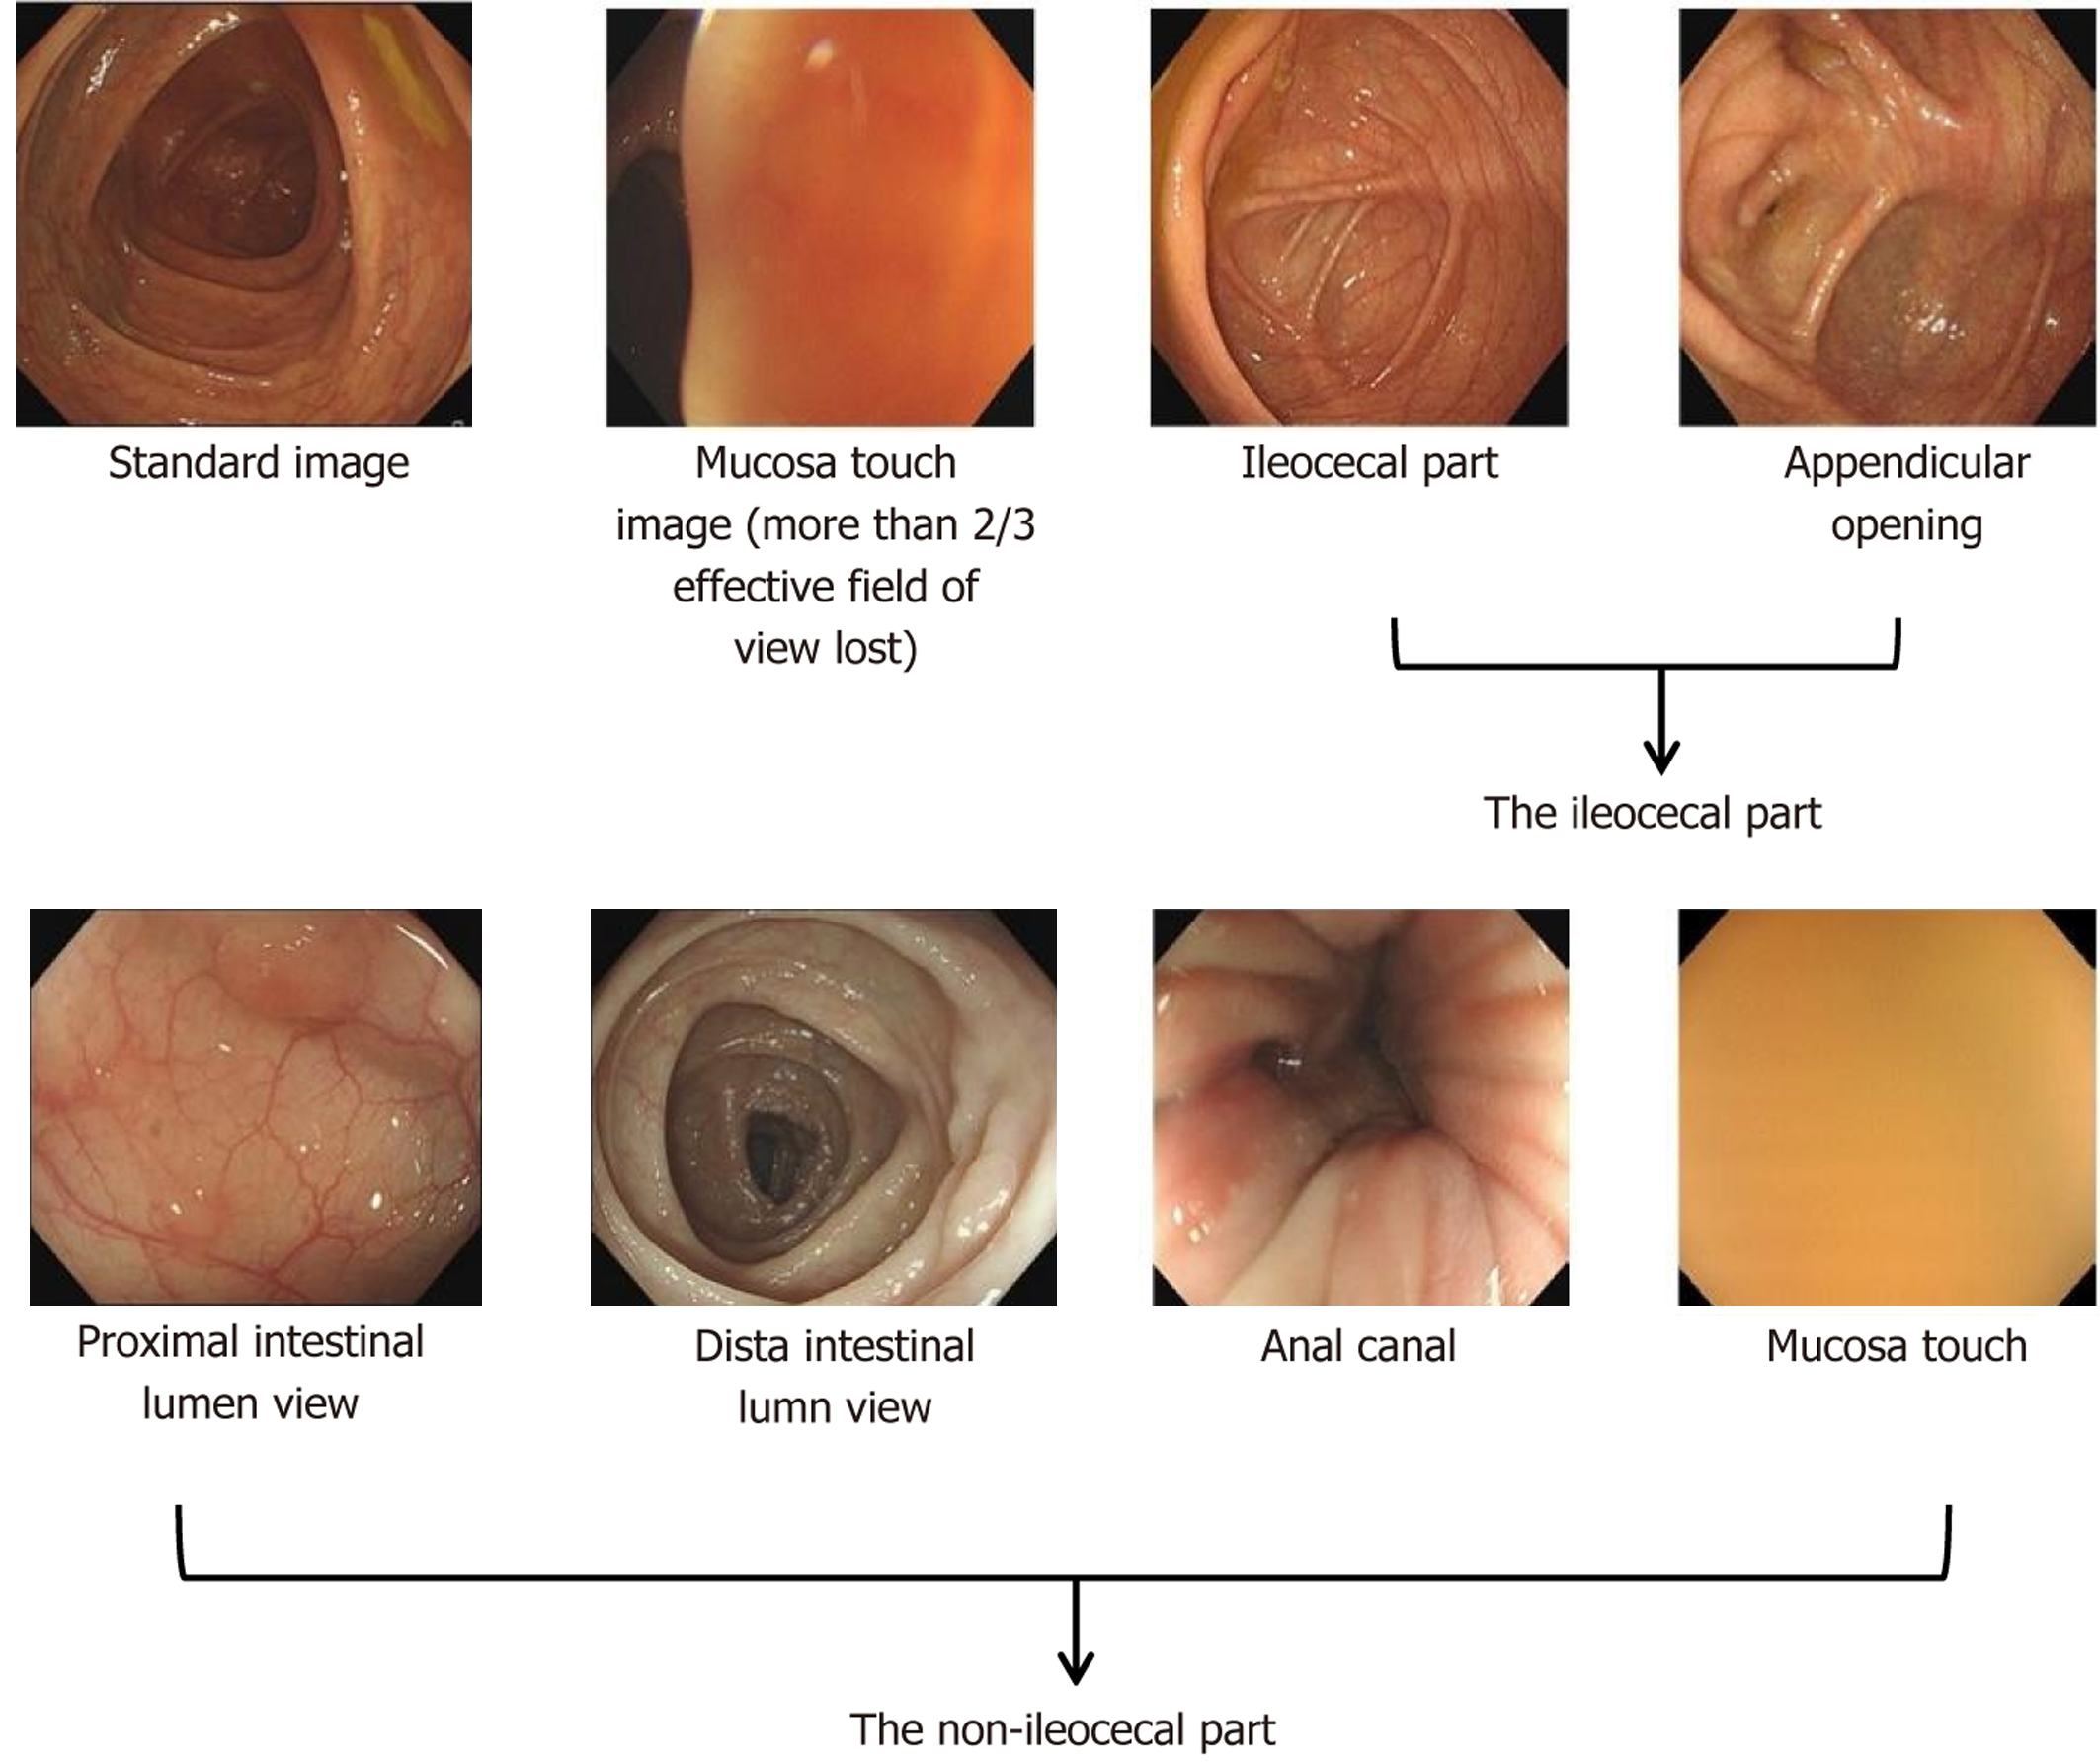
Figure 1 Image classification.
Annotation: In the pre-experiment, labeled images were annotated by multiple experts and then converted into a dataset. Model test precision/recall confirmed images with ≥ 2/3 mucosa touch meeting the mucosa touch image criteria.
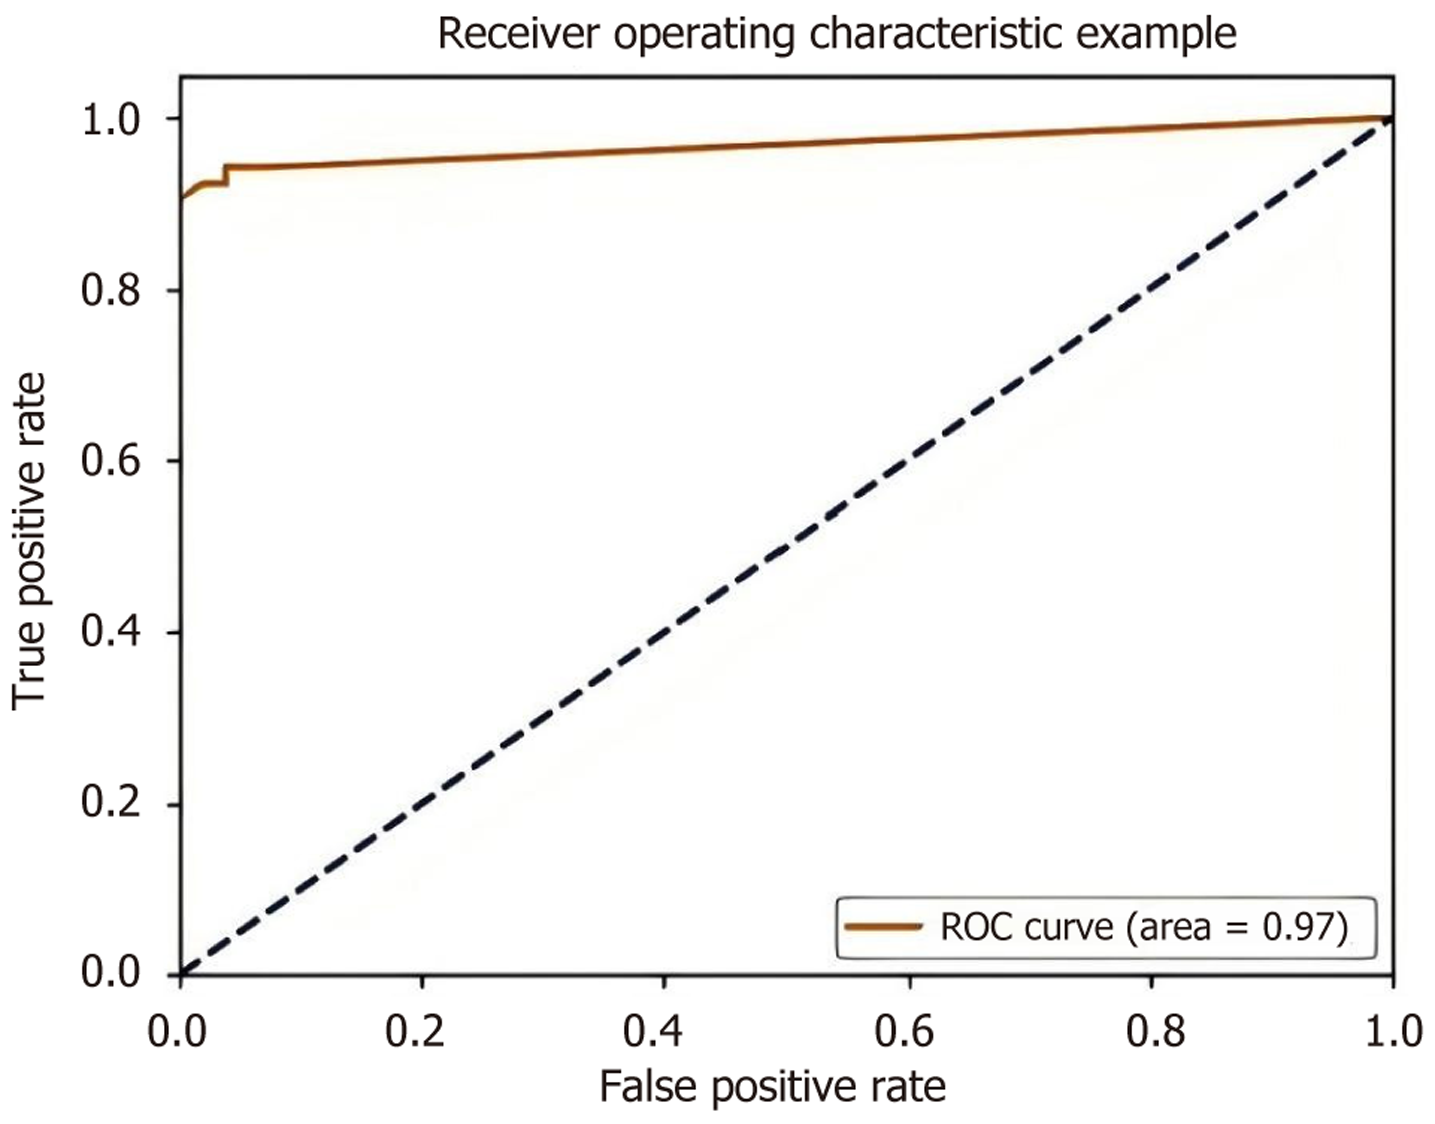
Figure 2 Receiver operating characteristic curve of the artificial intelligence-mucosa touch rate model.
ROC: Receiver operating characteristic.
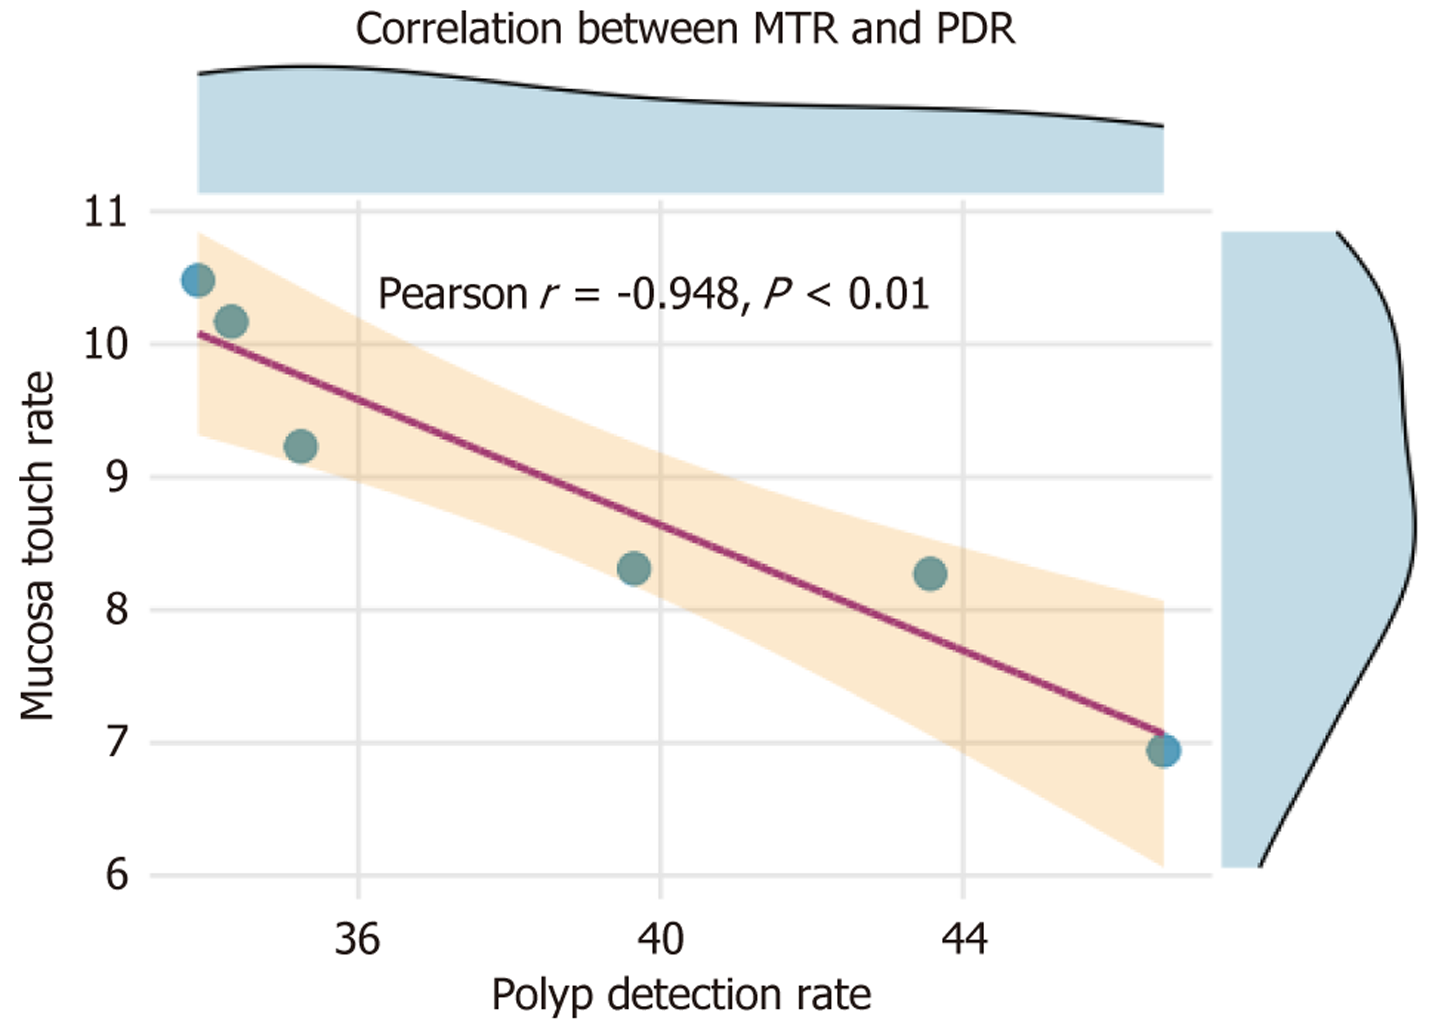
Figure 3 Scatter plot of mucosa touch rate vs polyp detection rate.
MTR: Mucosa touch rate; PDR: Polyp detection rate.
- Citation: Chen W, Wu M, Wang HY, Wu HB, Li J, Sun YH, Huang F, Gao M, Zhong ZH, Wu YM, Chen L. Artificial intelligence-based mucosa touch rate: A novel real-time quality control indicator for colonoscopy. World J Gastroenterol 2026; 32(27): 119276
- URL: https://www.wjgnet.com/1007-9327/full/v32/i27/119276.htm
- DOI: https://dx.doi.org/10.3748/wjg.119276