
















Copyright: ©Author(s) 2026.
World J Gastroenterol. Jul 21, 2026; 32(27): 118717
Published online Jul 21, 2026. doi: 10.3748/wjg.118717
Published online Jul 21, 2026. doi: 10.3748/wjg.118717
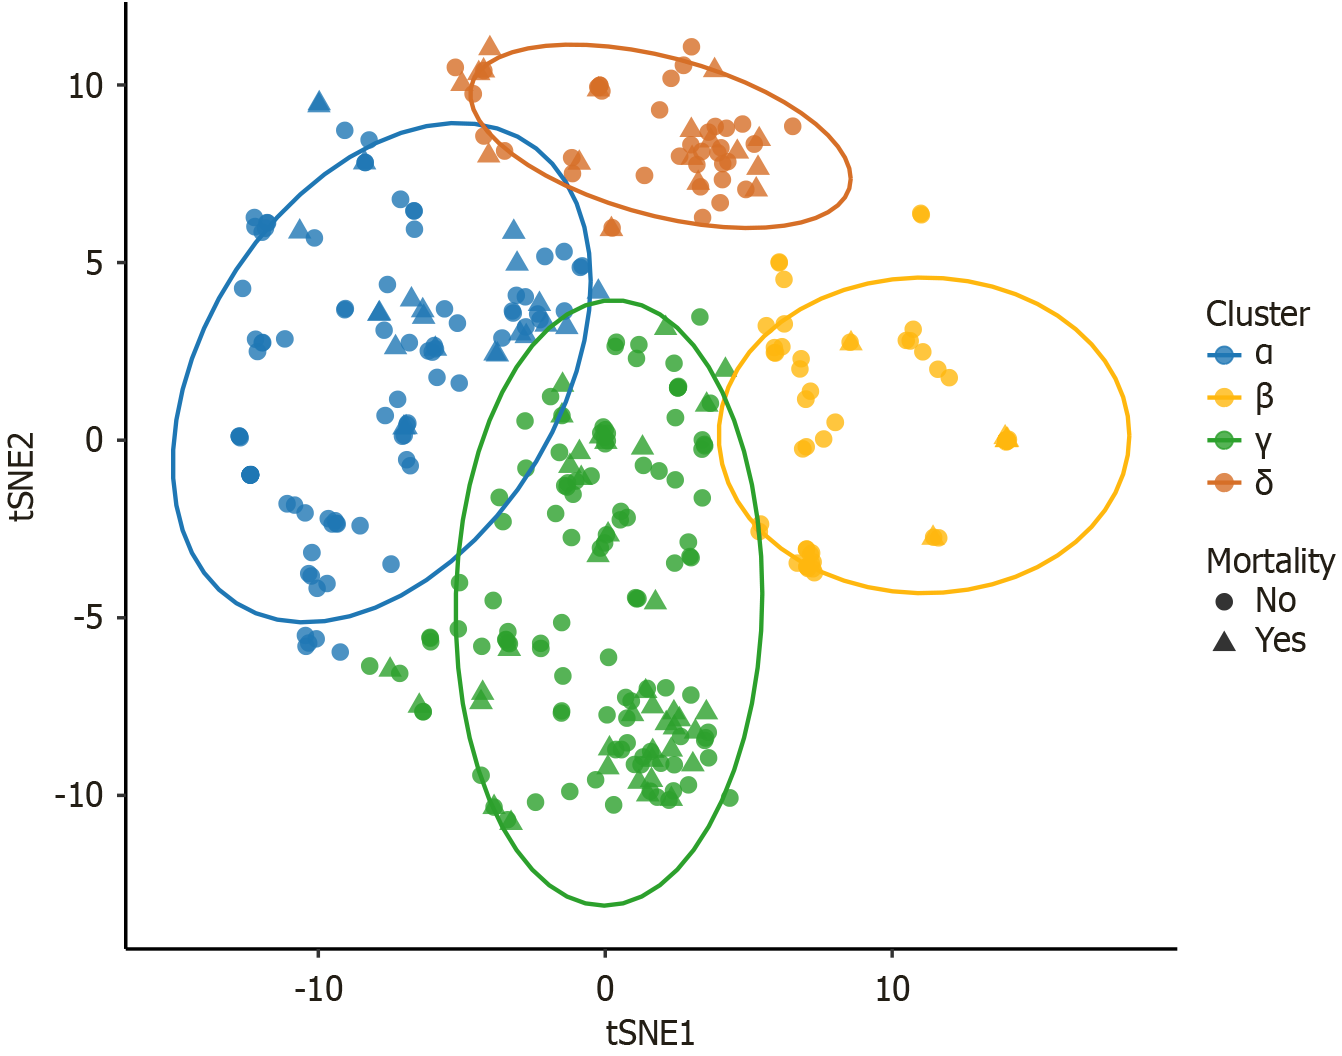
Figure 1 t-distributed stochastic neighbor embedding plot of the derivation cohort.
The main purpose of t-distributed stochastic neighbor embedding (t-SNE) plot is the visualization of high-dimensional data. In t-SNE plot, circles represent individual patients. cluster α (Enterococcus faecium/Enterobacter cloacae–predominant) in blue, cluster β (Escherichia coli–dominant) in yellow, cluster γ (multidrug-resistant organism-enriched) in green and cluster δ (Acinetobacter baumannii–Candida glabrata co-infection) in orange. t-SNE: T-distributed stochastic neighbor embedding.
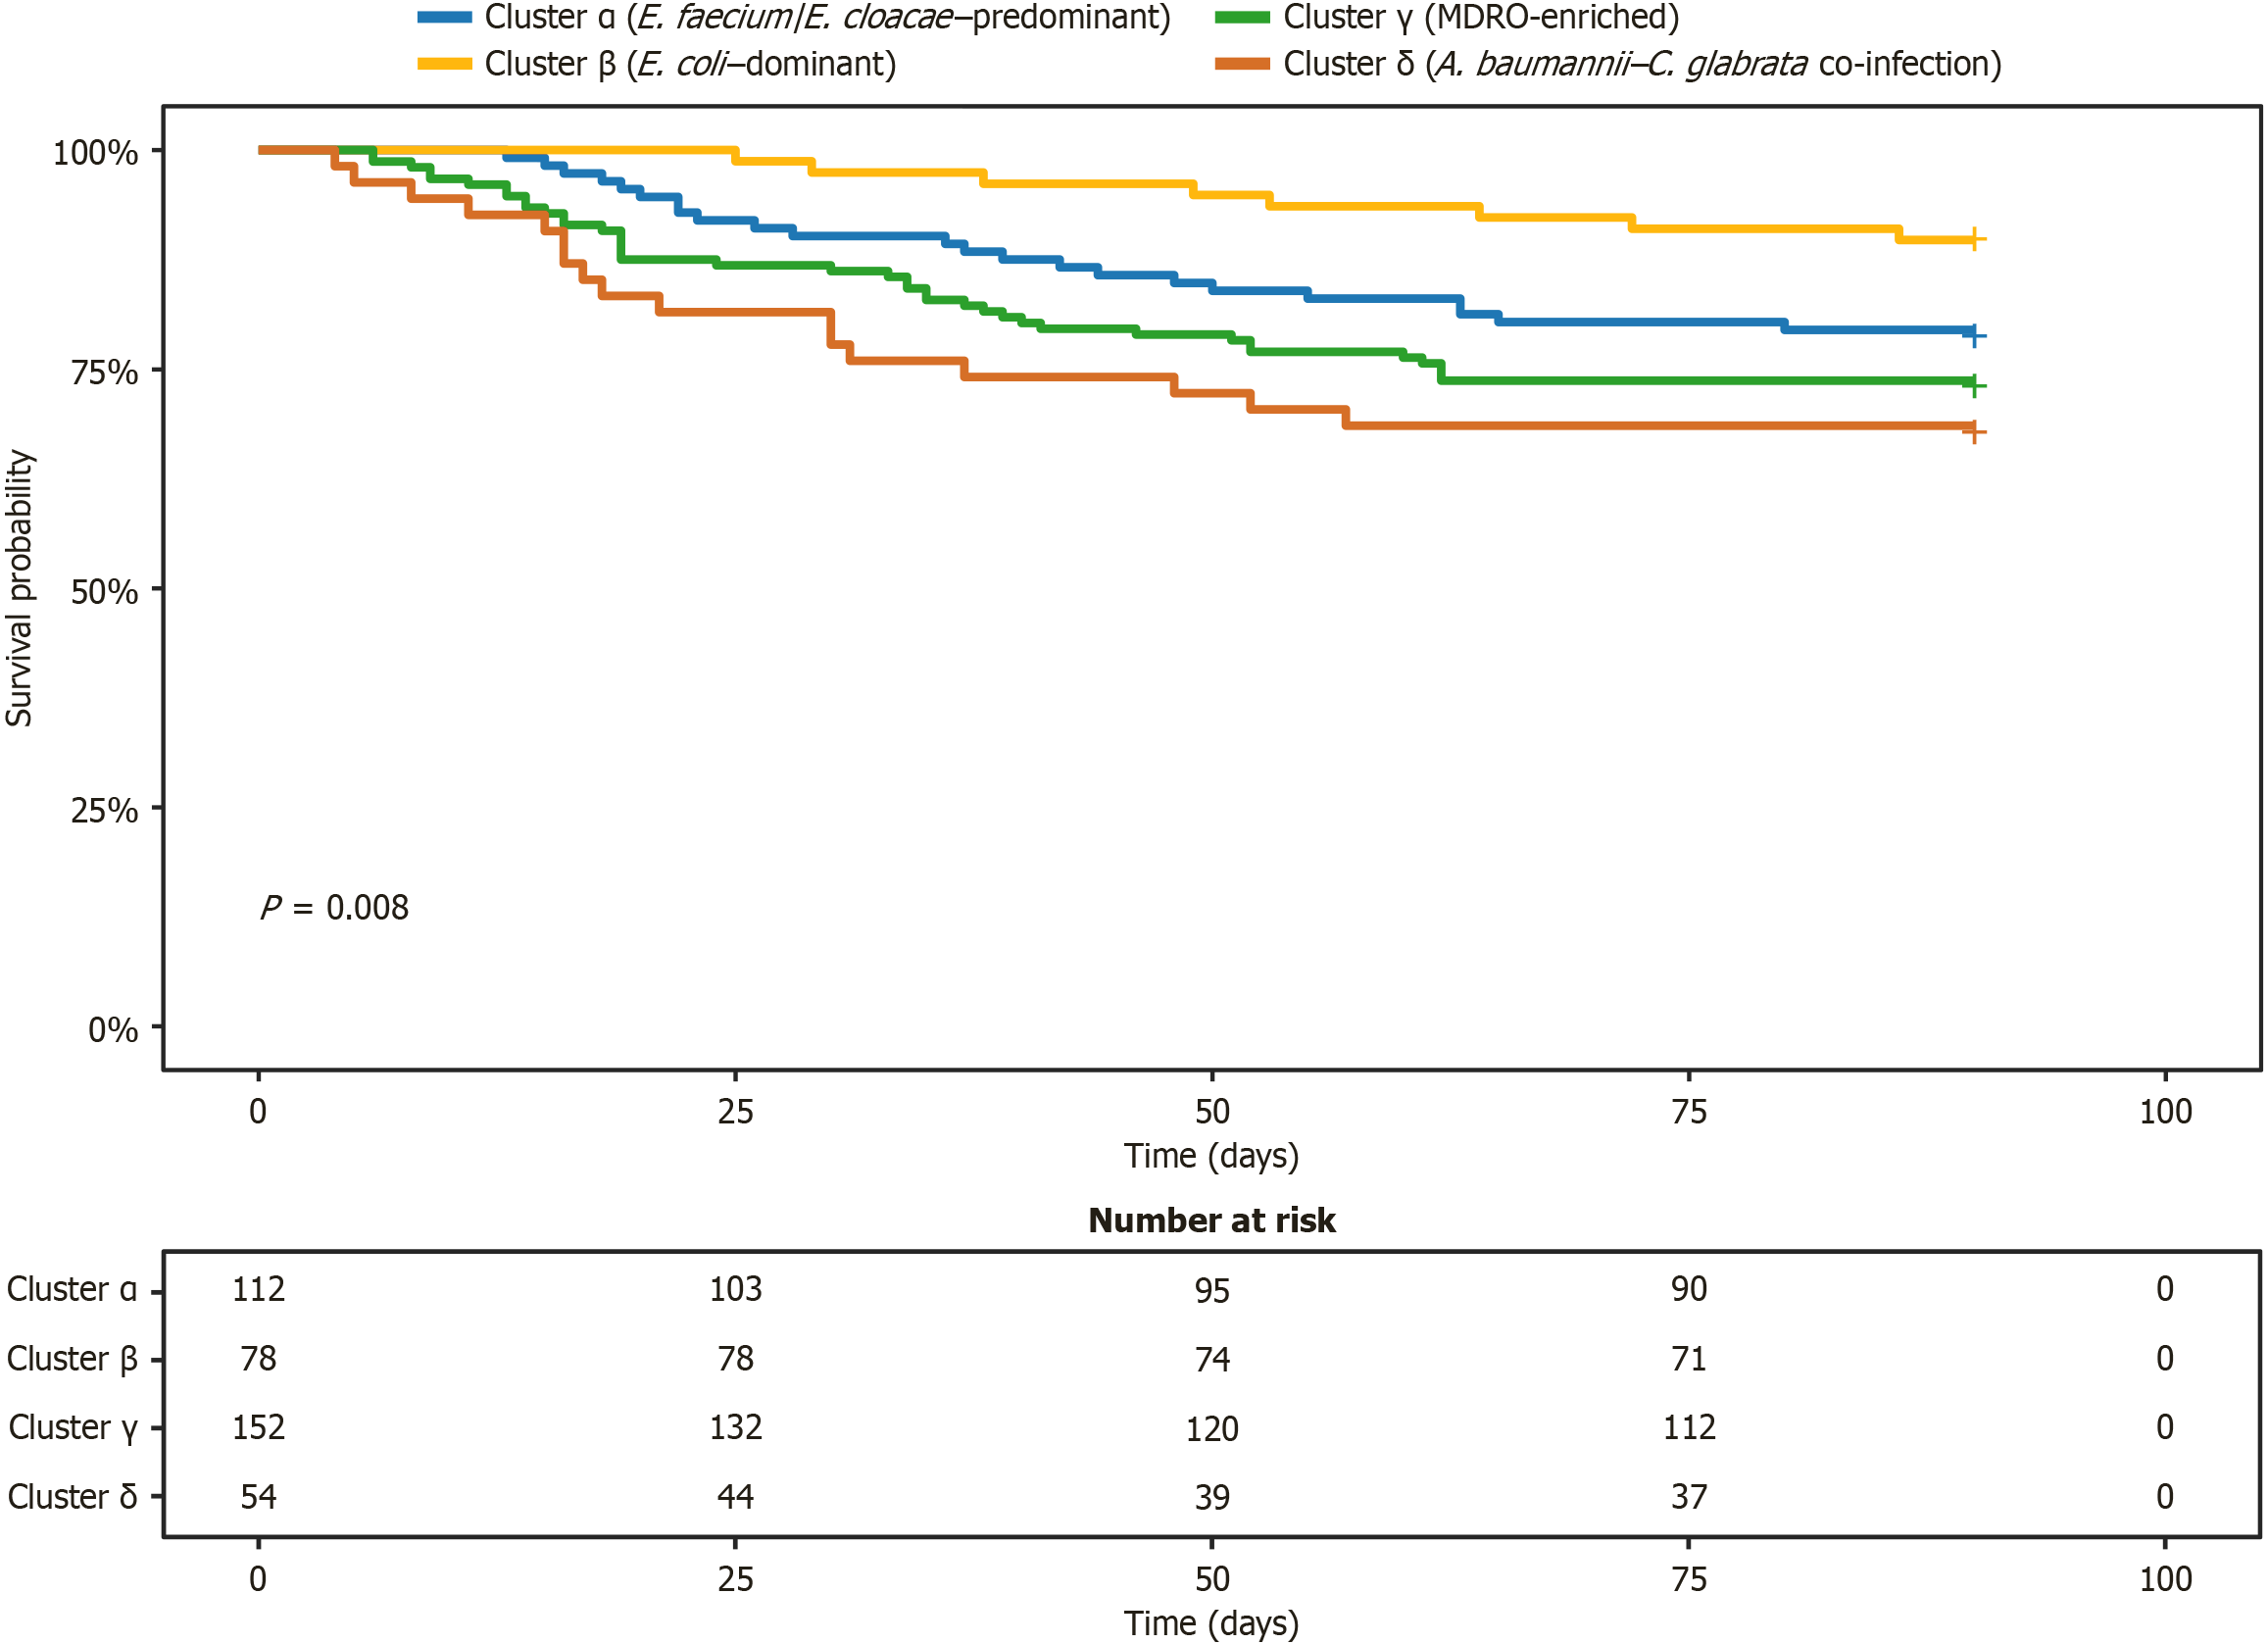
Figure 2 Kaplan-Meier survival analysis of the derivation cohort.
All show significant differences in 90-day mortality by clusters. E. faecium: Enterococcus faecium; E. cloacae: Enterobacter cloacae; E. coli: Escherichia coli; MDRO: Multidrug-resistant organism; A. baumannii: Acinetobacter baumannii; C. glabrata: Candida glabrata.
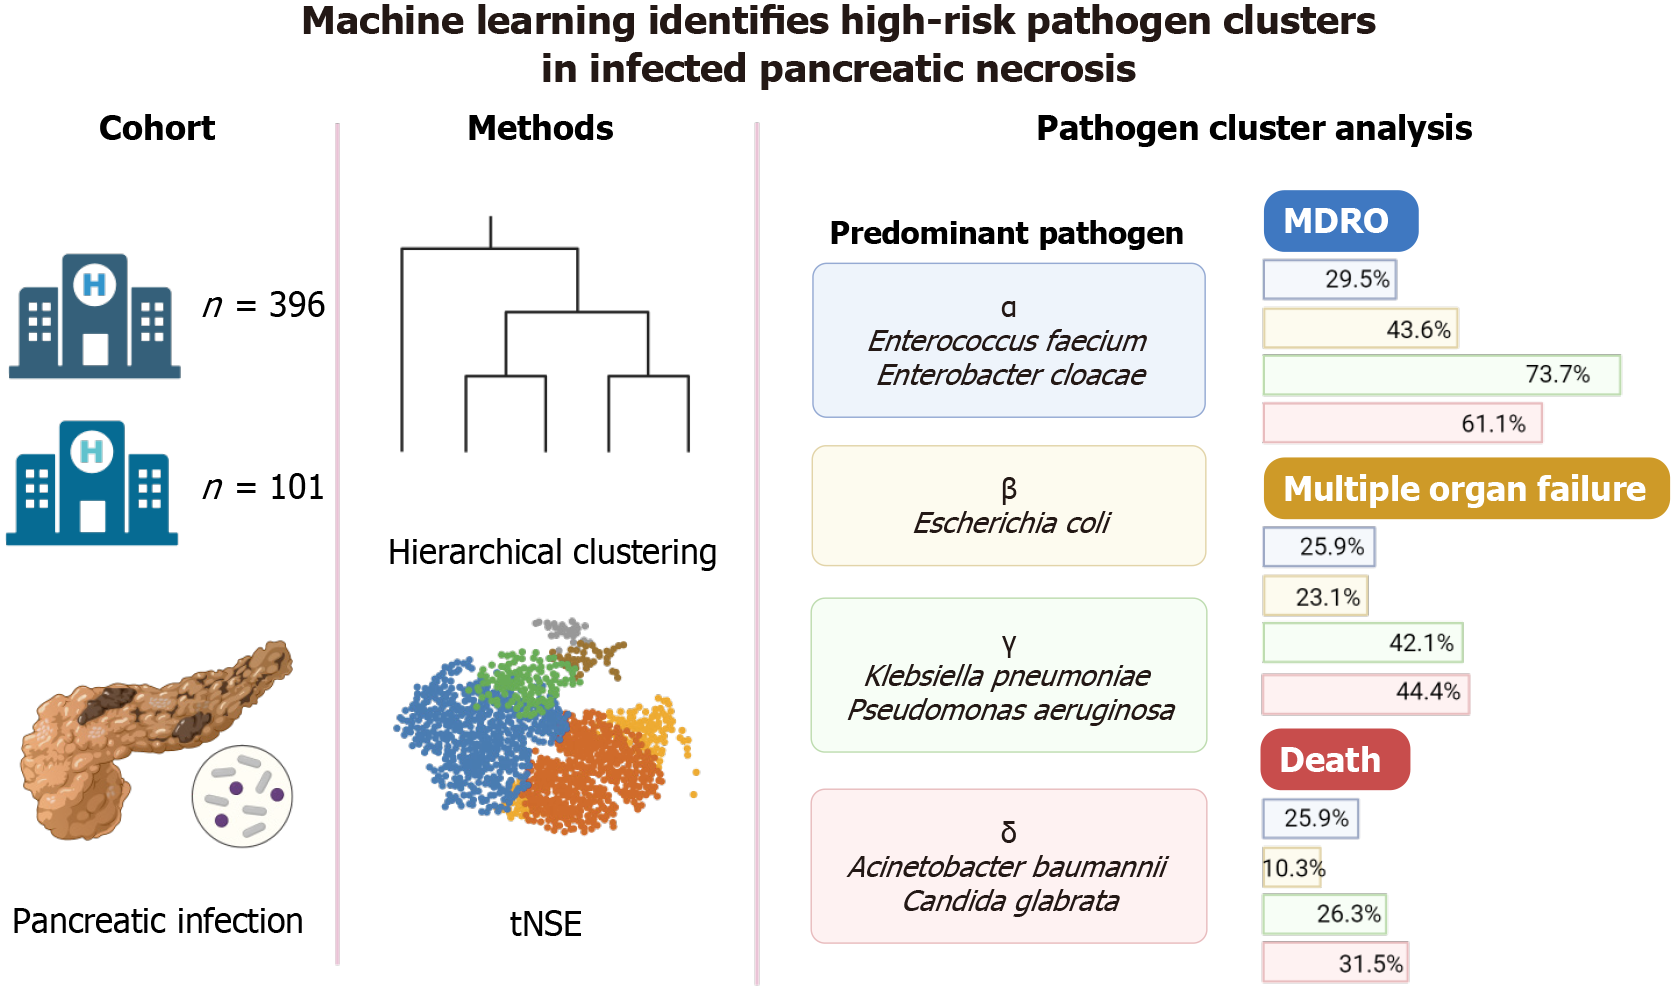
Figure 3 Graphical abstract.
MDRO: Multidrug-resistant organism; t-SNE: T-distributed stochastic neighbor embedding.
- Citation: Liu BQ, Sun ZF, Ning CH, Xiao J, Wu D, Lin CY, Hong XY, Guo R, Chen L, Cao XT, Shen DC, Huang GW. Machine learning-driven pathogen cluster analysis identifies high-risk subtypes of infected pancreatic necrosis in a multi-center cohort. World J Gastroenterol 2026; 32(27): 118717
- URL: https://www.wjgnet.com/1007-9327/full/v32/i27/118717.htm
- DOI: https://dx.doi.org/10.3748/wjg.118717