
















Copyright: ©Author(s) 2026.
World J Gastroenterol. Jul 21, 2026; 32(27): 117897
Published online Jul 21, 2026. doi: 10.3748/wjg.117897
Published online Jul 21, 2026. doi: 10.3748/wjg.117897
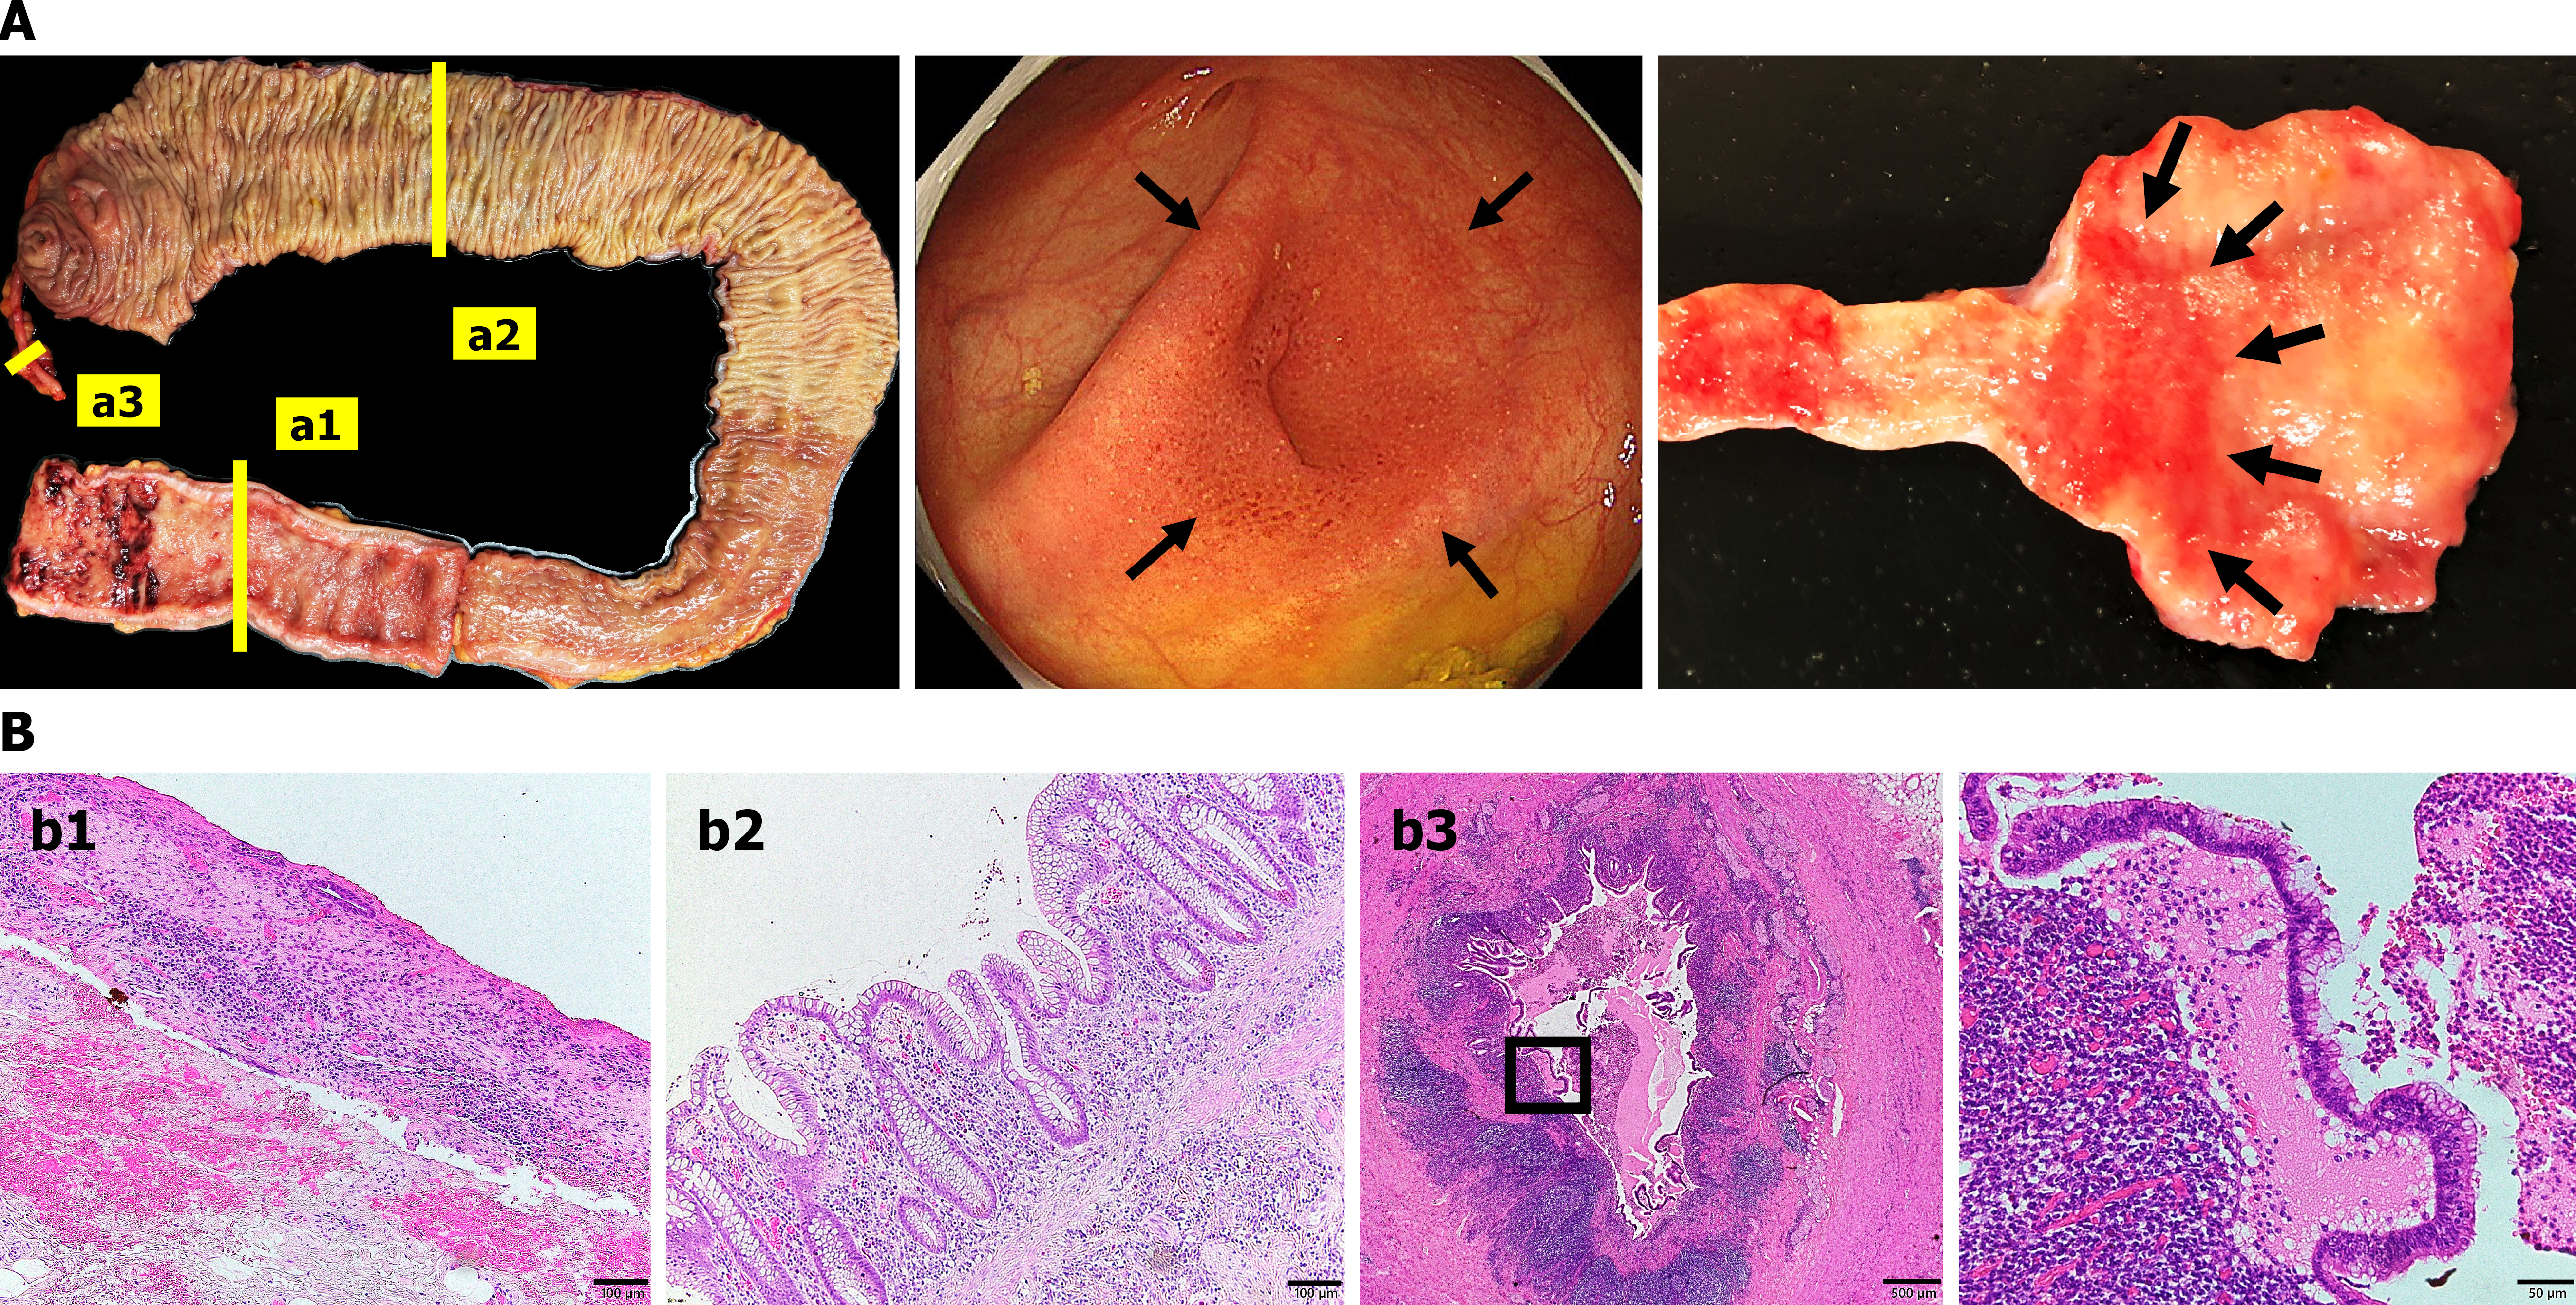
Figure 1 Appendiceal inflammation as skip lesions in ulcerative colitis.
A: The left part shows a macroscopic image of a surgical specimen from a patient with active ulcerative colitis who underwent total proctocolectomy (a1: Rectum, a2: Ascending colon, and a3: Appendix). The middle part presents endoscopic findings of the appendiceal orifice in ulcerative colitis. The right part displays a macroscopic image of the appendiceal orifice. The black arrows indicate appendiceal orifice inflammation. The stained sections in a1, a2, and a3 correspond to b1, b2, and b3, respectively; B: Hematoxylin and eosin staining of the rectum (b1), bar = 100 μm; ascending colon (b2), bar = 100 μm; appendix (b3), bars = 500 μm (left), and 50 μm [right (enlarged view of the black square in the left panel)].
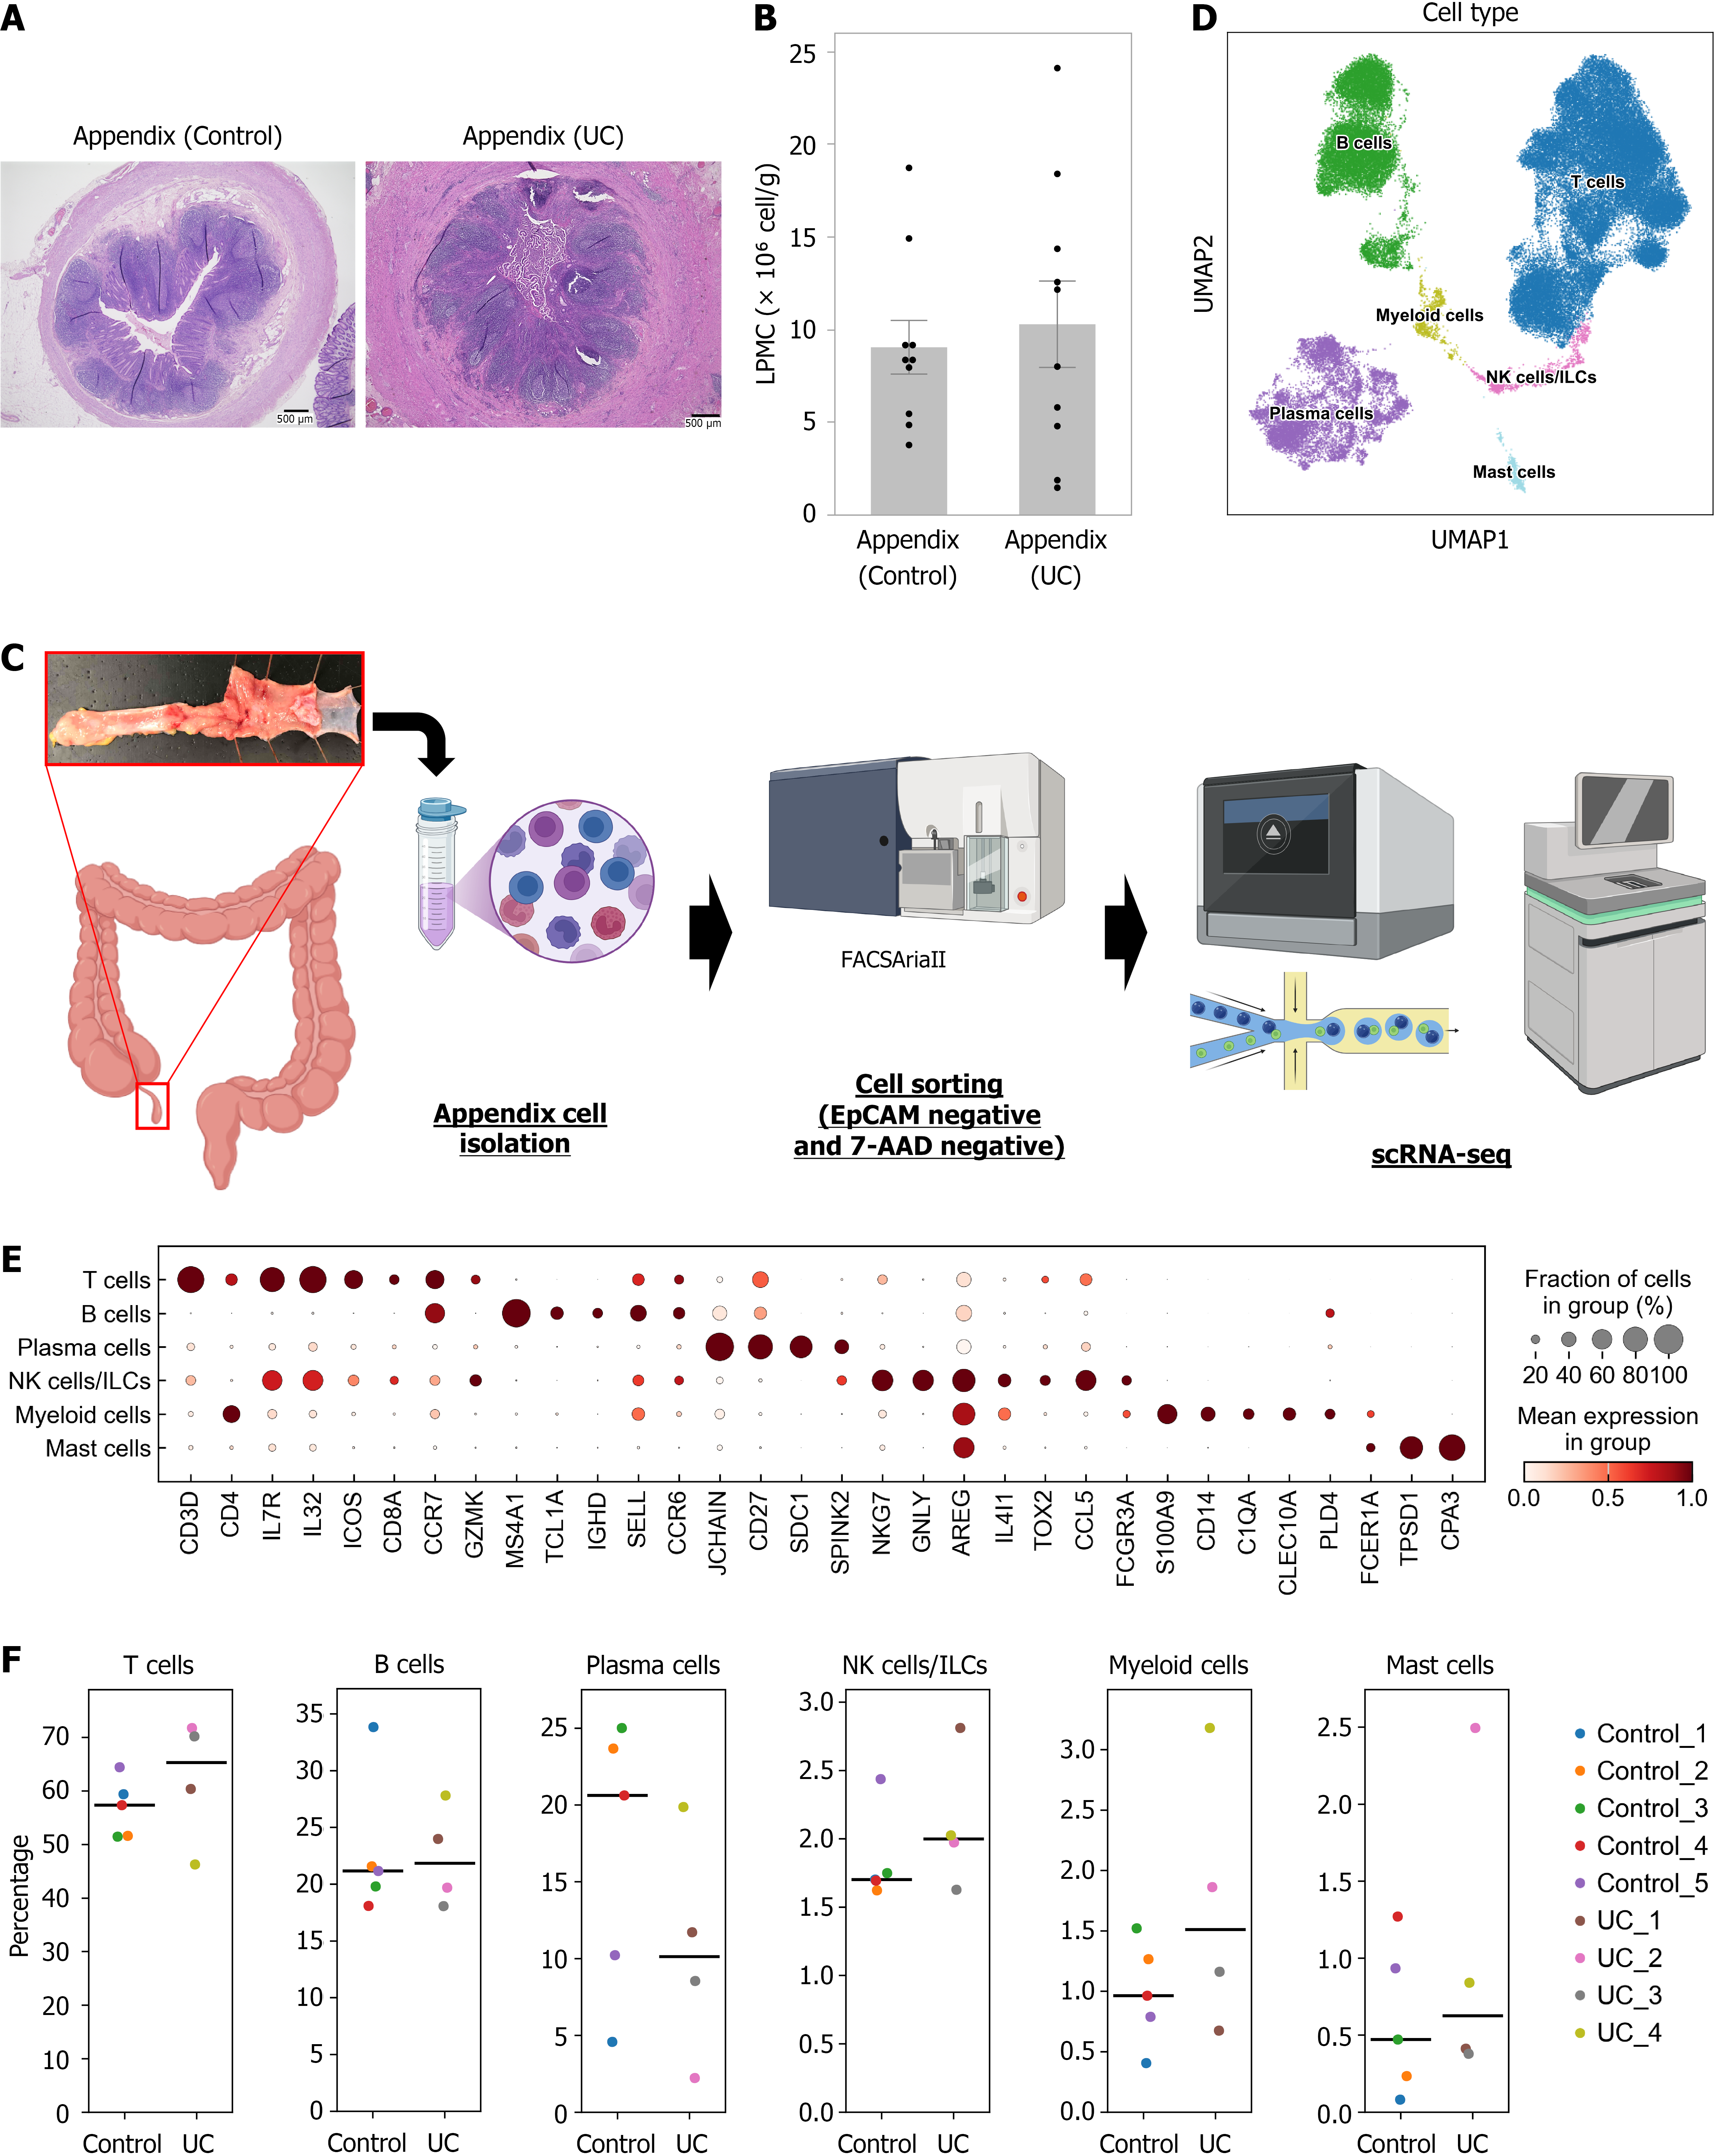
Figure 2 Single-cell landscape of appendiceal lamina propria mononuclear cells in patients with ulcerative colitis and controls.
A: Hematoxylin and eosin staining of the appendix of control (left) and ulcerative colitis (UC) (right) patient. Bars = 500 μm; B: Lamina propria mononuclear cells (LPMCs) per tissue weight in the appendix of controls (n = 10) and UC (n = 10). Data are shown as mean ± SEM; C: Experimental design of single-cell RNAsequencing analysis. Appendiceal LPMCs were isolated, and EpCAM- and 7-amino-actinomycin D- cells were sorted using FACSAria II and subjected to single-cell RNAsequencing; D: Uniform manifold approximation and projection of appendiceal LPMCs UC (n = 4) and controls (n = 5); E: Expression of genes across cell types; F: Frequencies of cell types in UC (n = 4) and controls (n = 5). Scatter plots with a median line. ILC: Innate lymphoid cell; LPMCs: Lamina propria mononuclear cells; NK: Natural killer; scRNA-seq: Single-cell RNAsequencing; UC: Ulcerative colitis; UMAP: Uniform manifold approximation and projection; 7-AAD: 7-amino-actinomycin D.
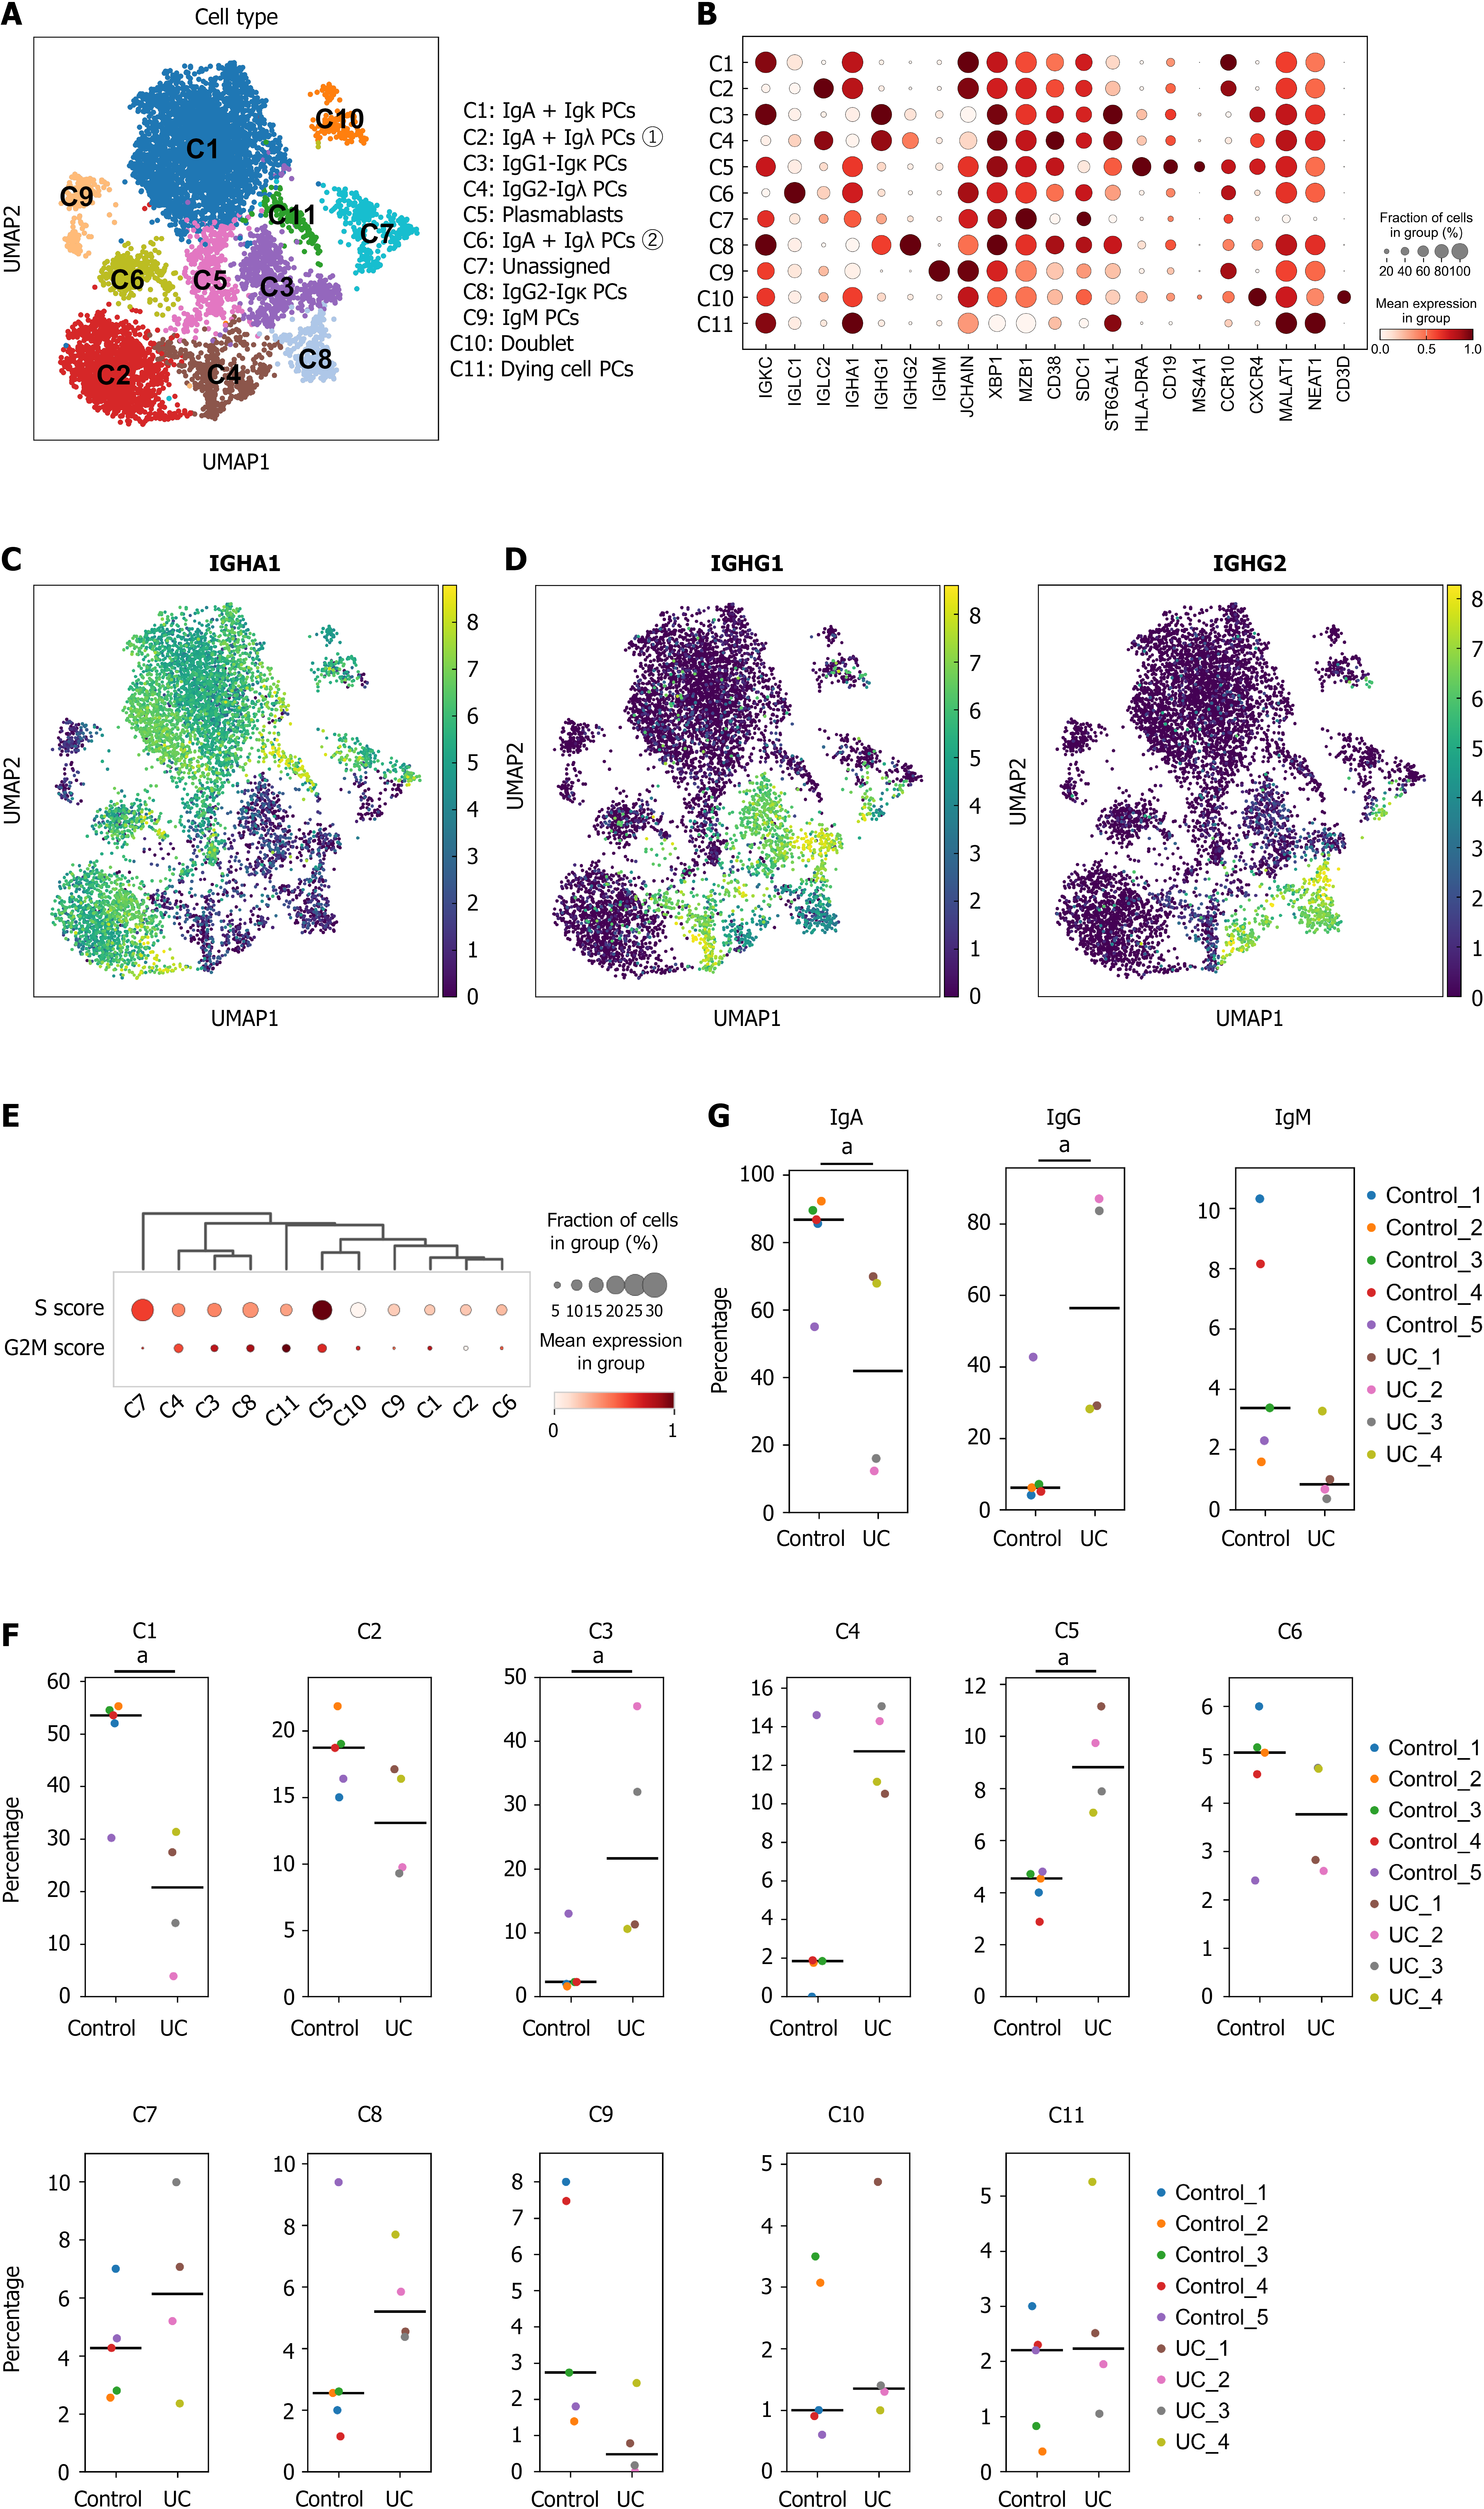
Figure 3 Aberrant immunoglobulin G production in the appendices of patients with ulcerative colitis.
A: Uniform manifold approximation and projection (UMAP); unsupervised clustering of appendiceal plasma cells; B: Dot plot; expression frequencies and signature gene levels across clusters; C: Im
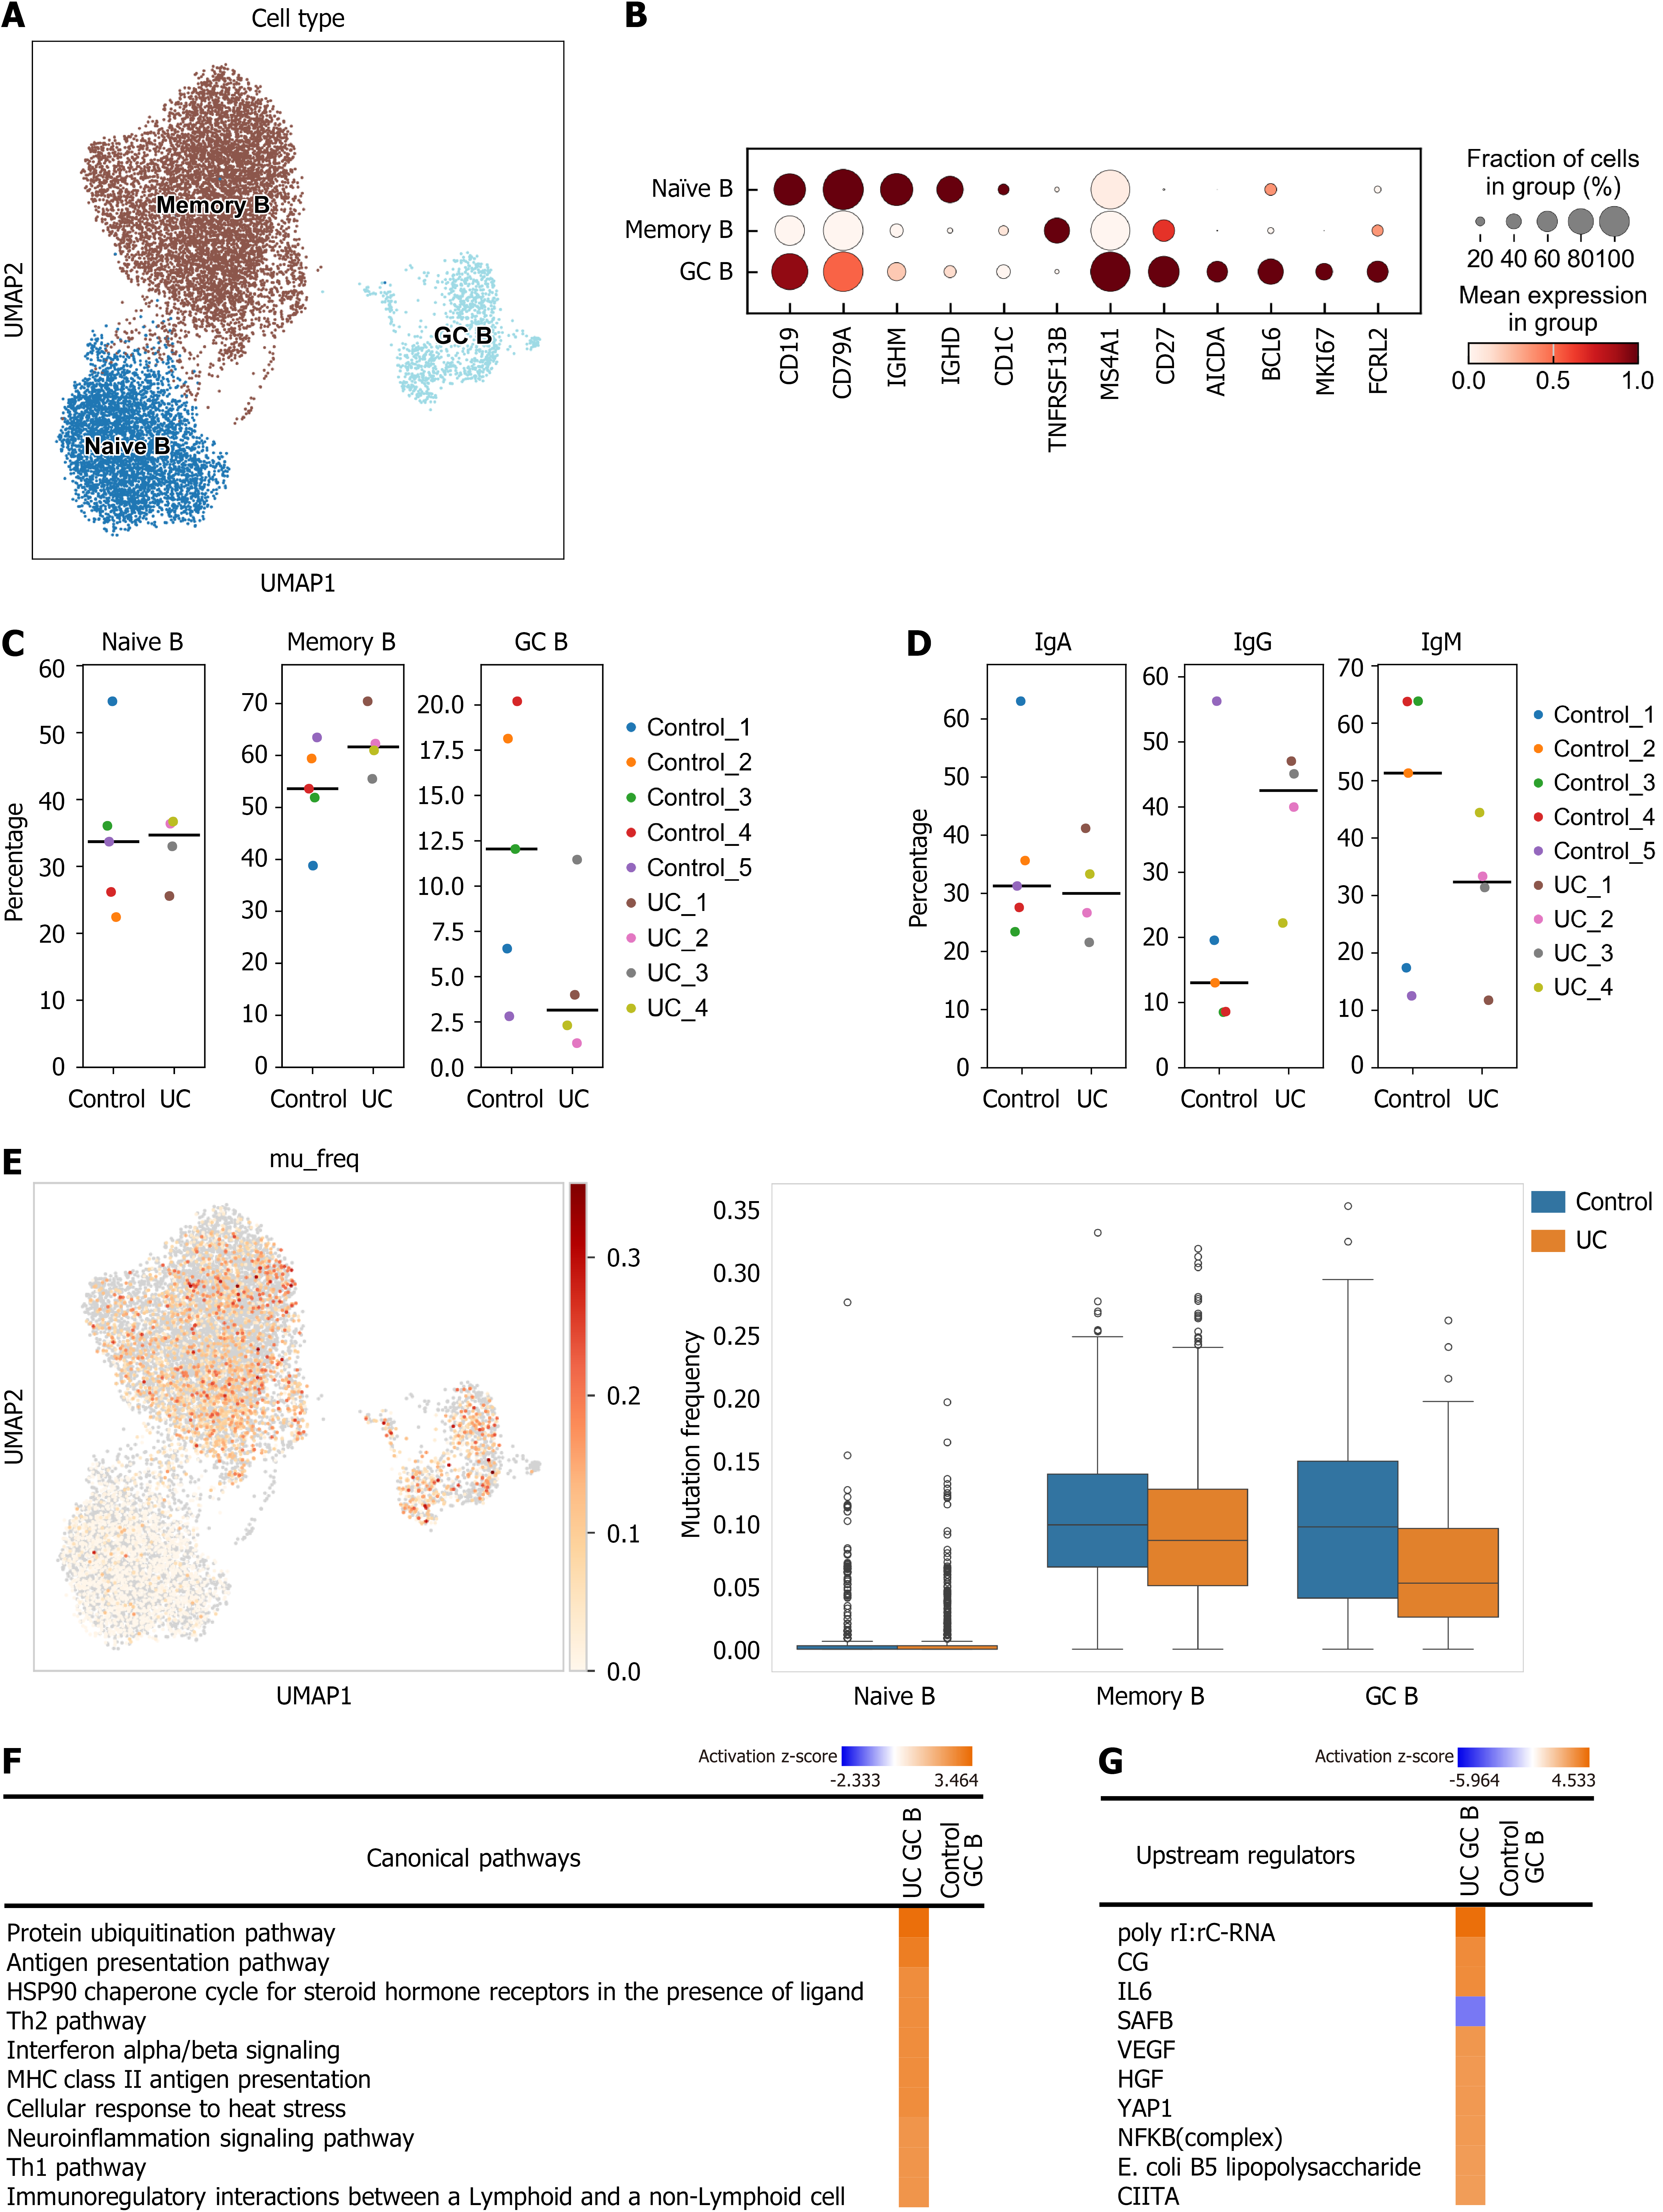
Figure 4 Inflammatory milieu influences germinal center reactions in the appendices of patients with ulcerative colitis.
A: Uniform manifold approximation and projection; single-cell landscape of appendiceal B cells; B: Dot plot; expression levels of marker genes across B-cell subsets; C: Frequencies of B-cell subsets in ulcerative colitis/controls; D: Isotype distribution in germinal center B (GC B) cells; E: Immunoglobulin somatic mutation frequencies subsets. Box-and-whisker plot; median and interquartile range; F: Canonical pathway enhanced in GC B cells; G: Predicted upstream regulators enhanced or suppressed in GC B cells. Scatter plots with median line for each group. ulcerative colitis, n = 4; controls, n = 5 (C and D). GC B: Germinal center B; Ig: Immunoglobulin; UC: Ulcerative colitis; UMAP: Uniform manifold approximation and projection.
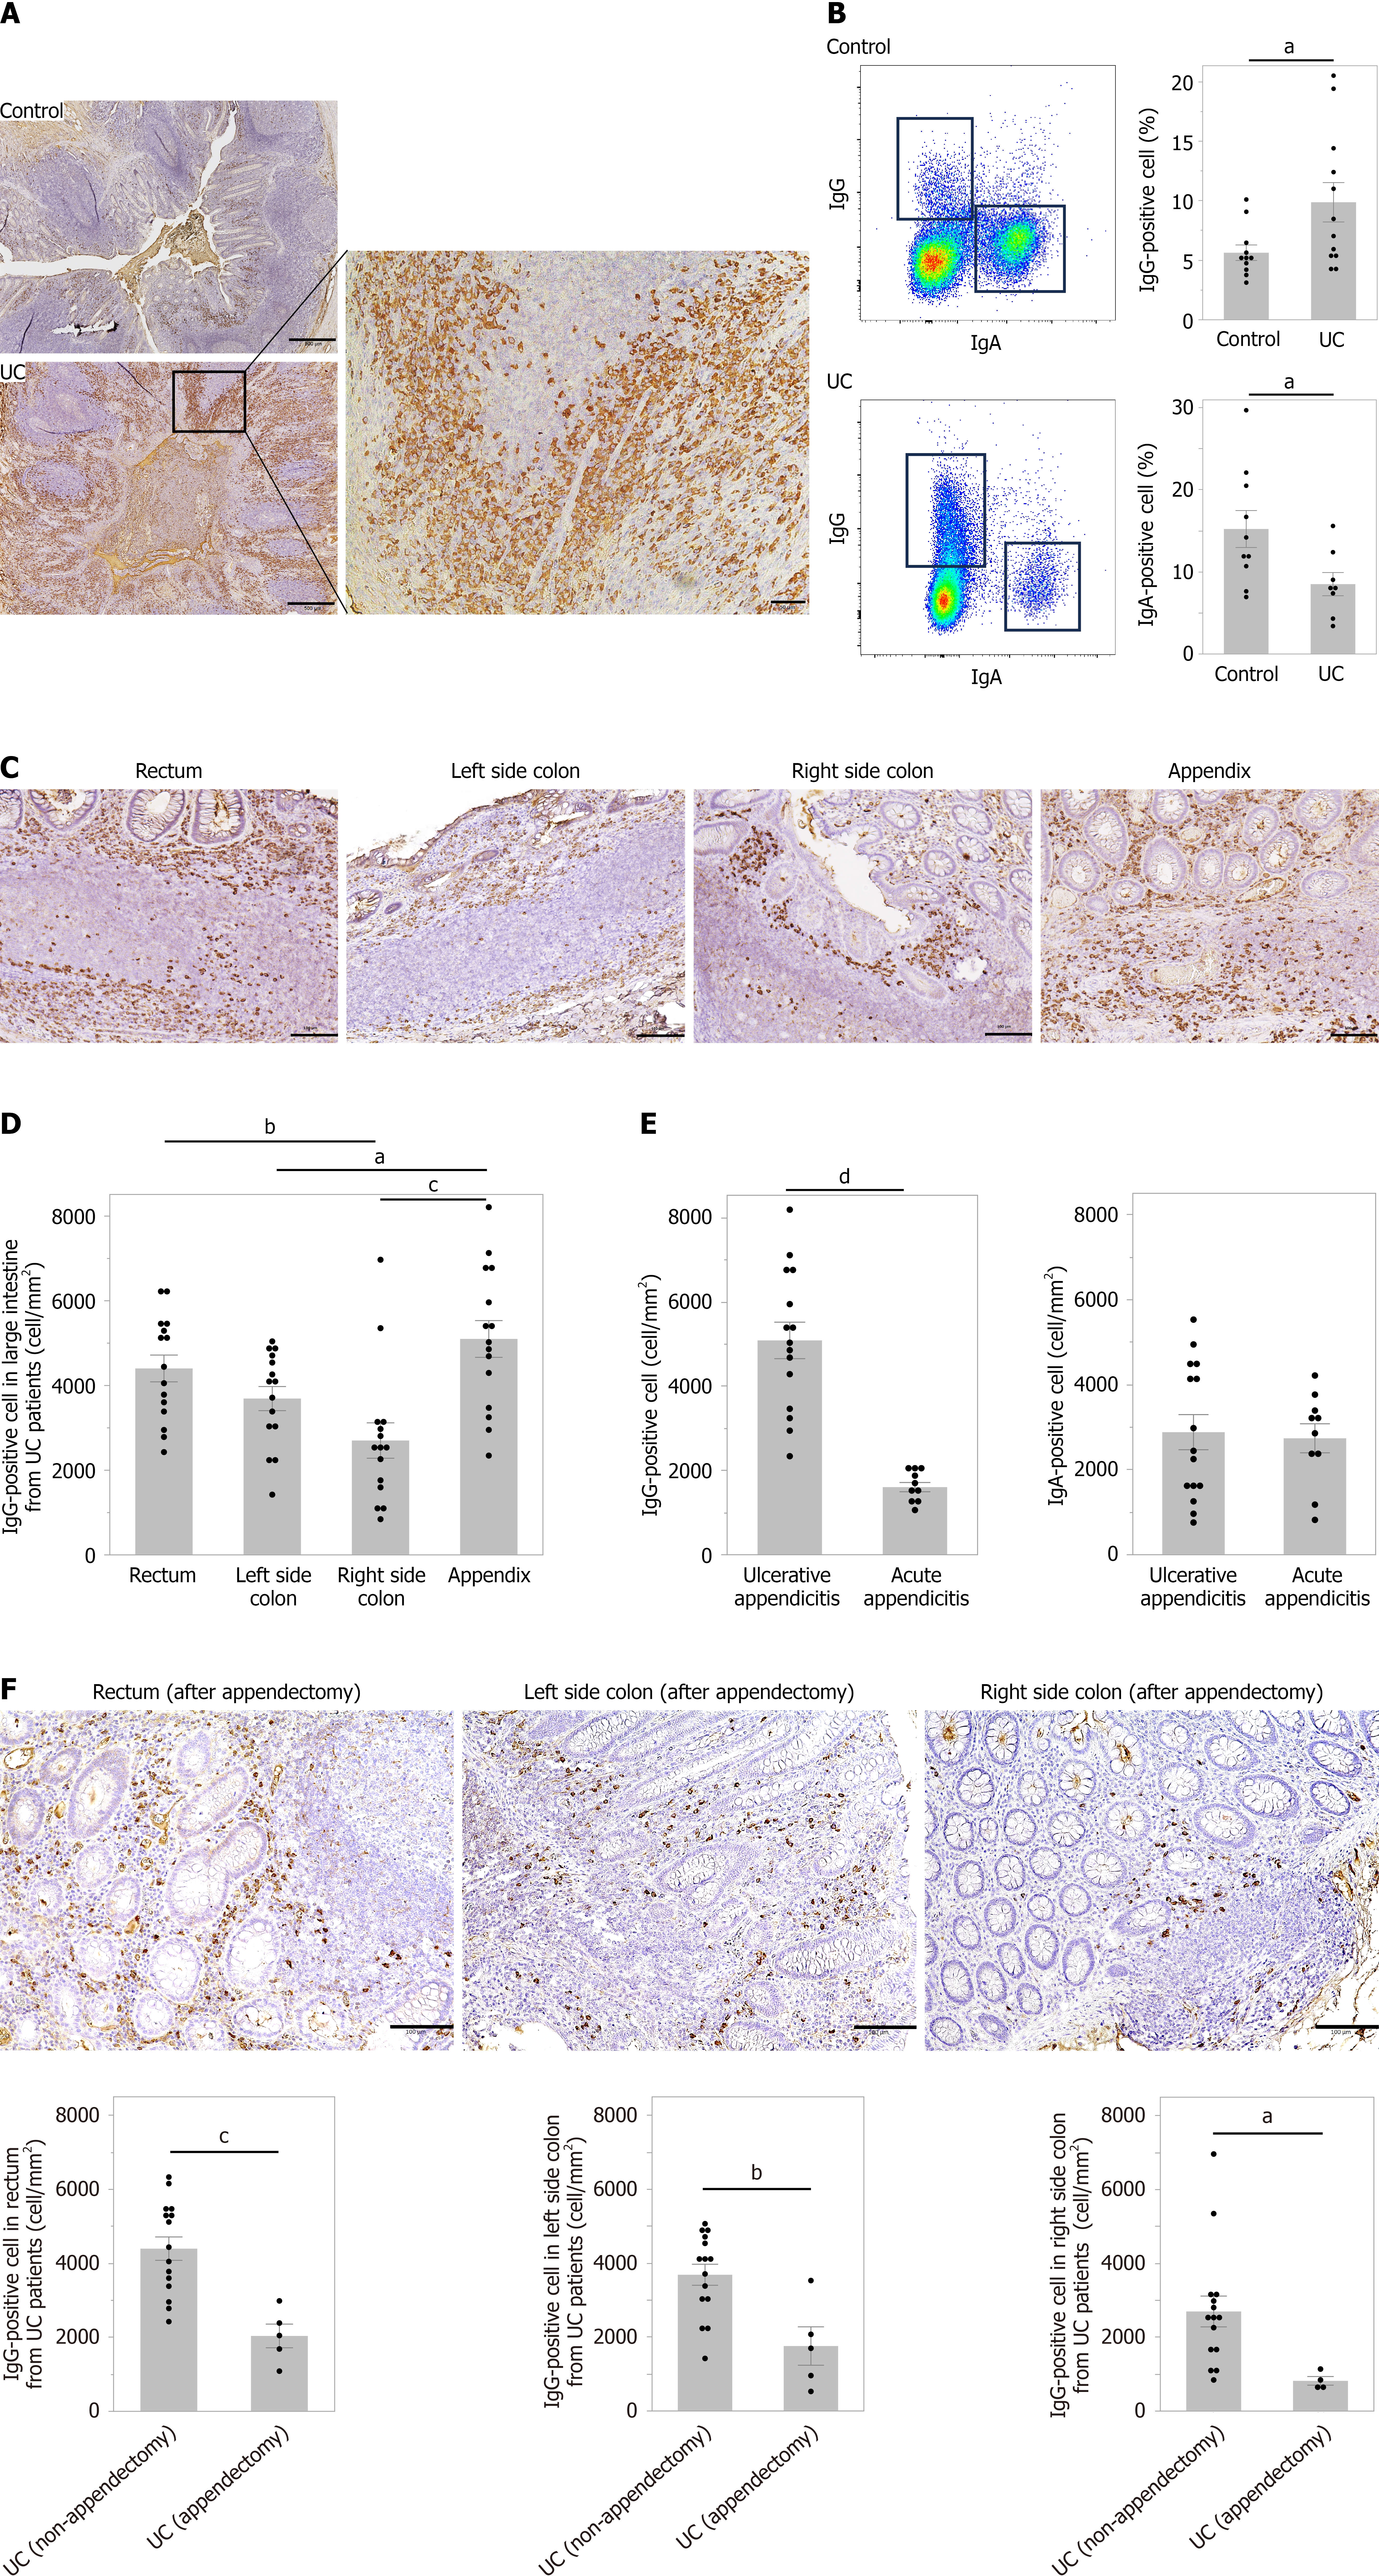
Figure 5 Increased frequencies of immunoglobulin G-positive cells in the appendices of patients with ulcerative colitis and their reduction in the rectum and colon after appendectomy.
A: Immunohistochemistry of immunoglobulin (Ig) G-positive cells in a control appendix (upper left, bar = 500 μm) and a patient with ulcerative colitis (UC) (bottom left and right, bars = 500 μm and 50 μm, respectively); B: Flow cytometric analysis of IgG-positive and IgA-positive cells in appendiceal lamina propria mononuclear cells in controls and UC [IgG-positive cells: (1) UC (n = 12); and (2) Control (n = 11); IgA-positive cells: (1) UC (n = 8); and (2) Control (n = 10)]; C: Immunohistochemistry of IgG-positive cells in the appendix and colorectal regions of a patient with UC. Bars = 100 μm; D: IgG-positive cells per area of immunohistochemistry sections in the appendix and colorectal regions of patients with UC (n = 15); E: IgG-positive and IgA-positive cells in immunohistochemistry sections of ulcerative appendicitis (n = 15), acute appendicitis (n = 10); F: IgG-positive cells in UC colorectal regions with (n = 5) or without (n = 15) appendectomy. Bars = 100 μm. Data are shown as mean ± SEM (B and D-F). aP < 0.05; bP < 0.01; cP < 0.001; and dP < 0.0001. Ig: Immunoglobulin; UC: Ulcerative colitis.
Figure 6 Immunoglobulin G-positive cells express C-C chemokine receptor 10 in the appendices and rectums of patients with ulcerative colitis.
A: C-C chemokine receptor 10 (CCR10) expression on uniform manifold approximation and projection of single-cell RNA sequencing data; B: Flow cytometric gating plots; CCR10 and immunoglobulin (Ig) G expression in appendiceal plasma cells; C: Immunohistochemistry for CCR10, IgG, and IgA in ulcerative colitis (UC) appendix. Top panel, bars = 100 μm; bottom (enlarged view of square in top panel), bars = 50 μm; D: Immunohistochemistry for CCR10, IgG, and IgA in the UC rectum. Top panel, bars = 100 μm; bottom (enlarged view of square in top panel), bars = 50 μm; E: Correlation between IgG-positive and CCR10-positive cells per immunohistochemistry field of the UC appendix. Spearman’s rank correlation. Ig: Immunoglobulin; UC: Ulcerative colitis; UMAP: Uniform manifold approximation and projection.
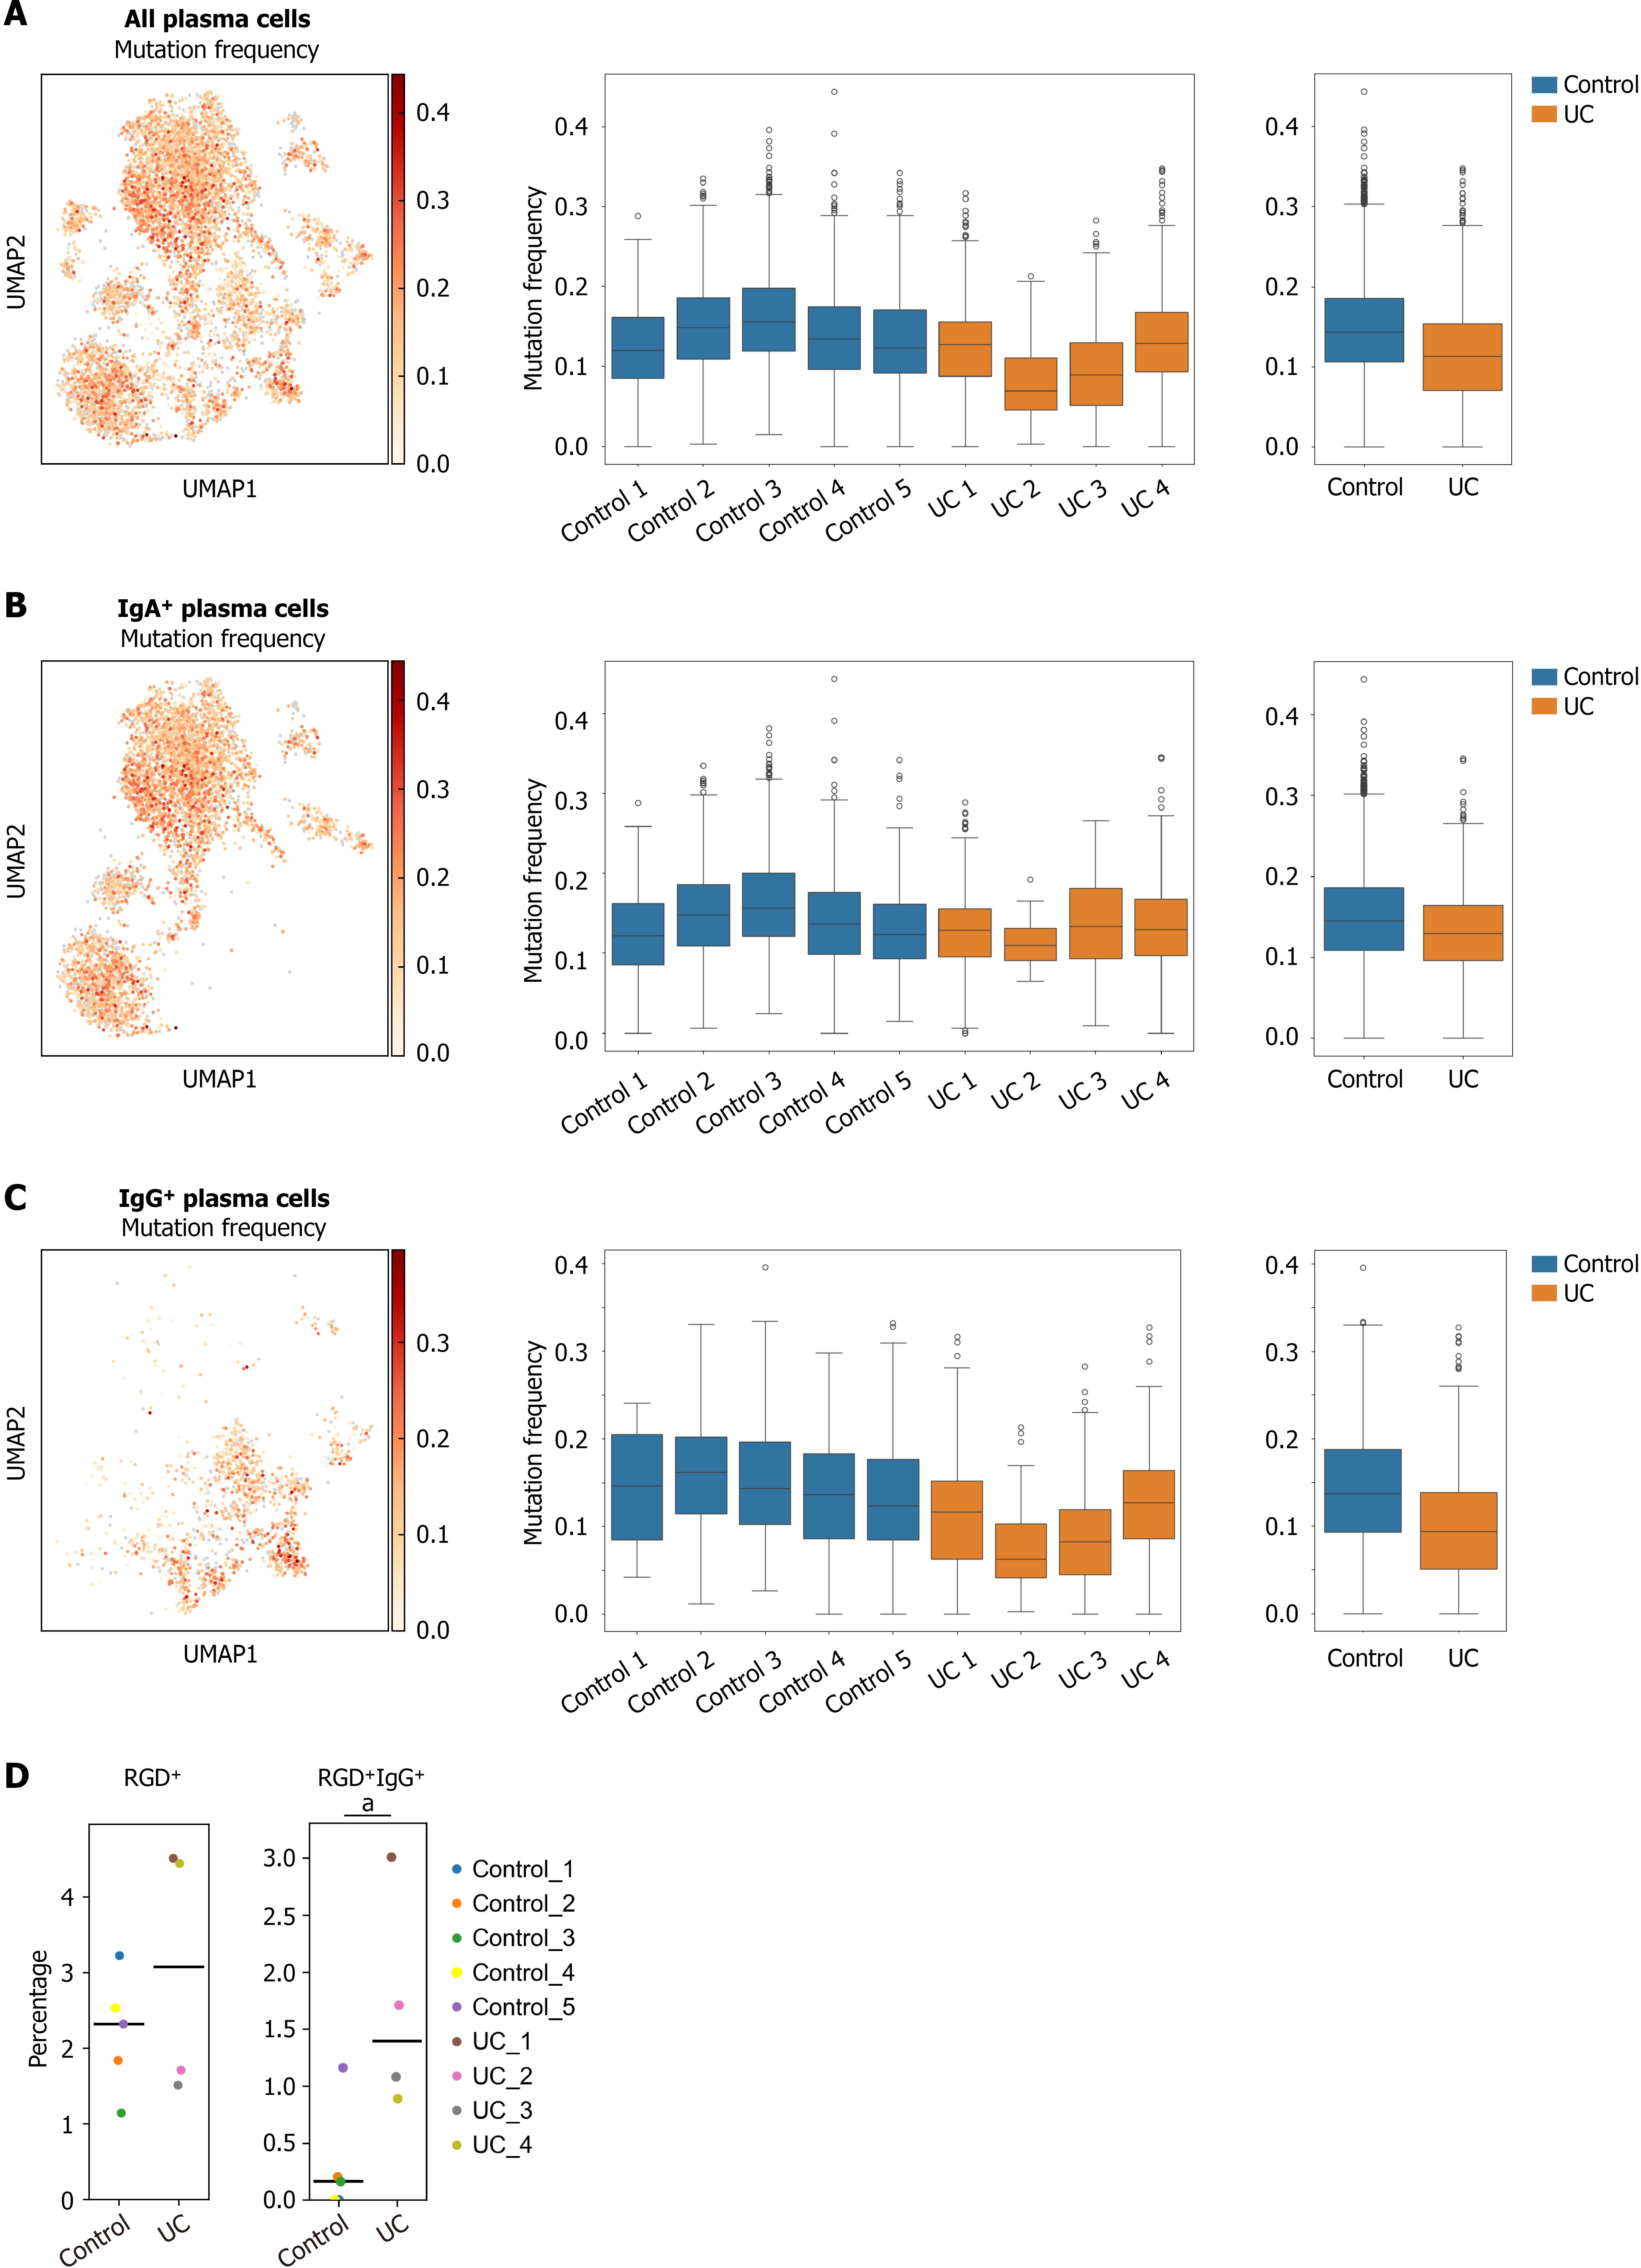
Figure 7 Somatically mutated, arginine-glycine-aspartic acid-motif-containing immunoglobulin G-producing cells are the hallmark of appendiceal antibody response in ulcerative colitis.
A: Immunoglobulin (Ig) somatic mutation frequencies of all isotypes expressed by appendiceal plasma cells. Cells colored by degree of mutations on uniform manifold approximation and projection plot (left). Box-and-whisker plots show mutation frequencies across the controls (blue) and ulcerative colitis groups (orange), and the median and interquartile range (right); B: Mutation frequencies of IgA; C: Mutation frequencies of IgG; D: Arginine-glycine-aspartic acid-motif-containing cells (arginine-glycine-aspartic acid+) in the total plasma cell fraction and IgG-expressing cells of patients with ulcerative colitis (n = 4) and controls (n = 5). The scatter plots with median line for each group. aP < 0.05. Ig: Immunoglobulin; RGD: Arginine-glycine-aspartic acid; UC: Ulcerative colitis; UMAP: Uniform manifold approximation and projection.
- Citation: Izutani Y, Ogino T, Sakakibara S, Kishi Y, Liu YC, Nakano Y, Fukada A, Sekido Y, Kuwahara R, Kihara T, Takeda M, Hata T, Hamabe A, Miyoshi N, Uemura M, Ikeuchi H, Hirota S, Takeda K, Mizushima T, Okuzaki D, Doki Y, Eguchi H. Contribution of the appendix to ulcerative colitis by supplying pathogenic immunoglobulin G-producing cells. World J Gastroenterol 2026; 32(27): 117897
- URL: https://www.wjgnet.com/1007-9327/full/v32/i27/117897.htm
- DOI: https://dx.doi.org/10.3748/wjg.117897