
















Copyright: ©Author(s) 2026.
World J Gastroenterol. Jul 7, 2026; 32(25): 118597
Published online Jul 7, 2026. doi: 10.3748/wjg.118597
Published online Jul 7, 2026. doi: 10.3748/wjg.118597
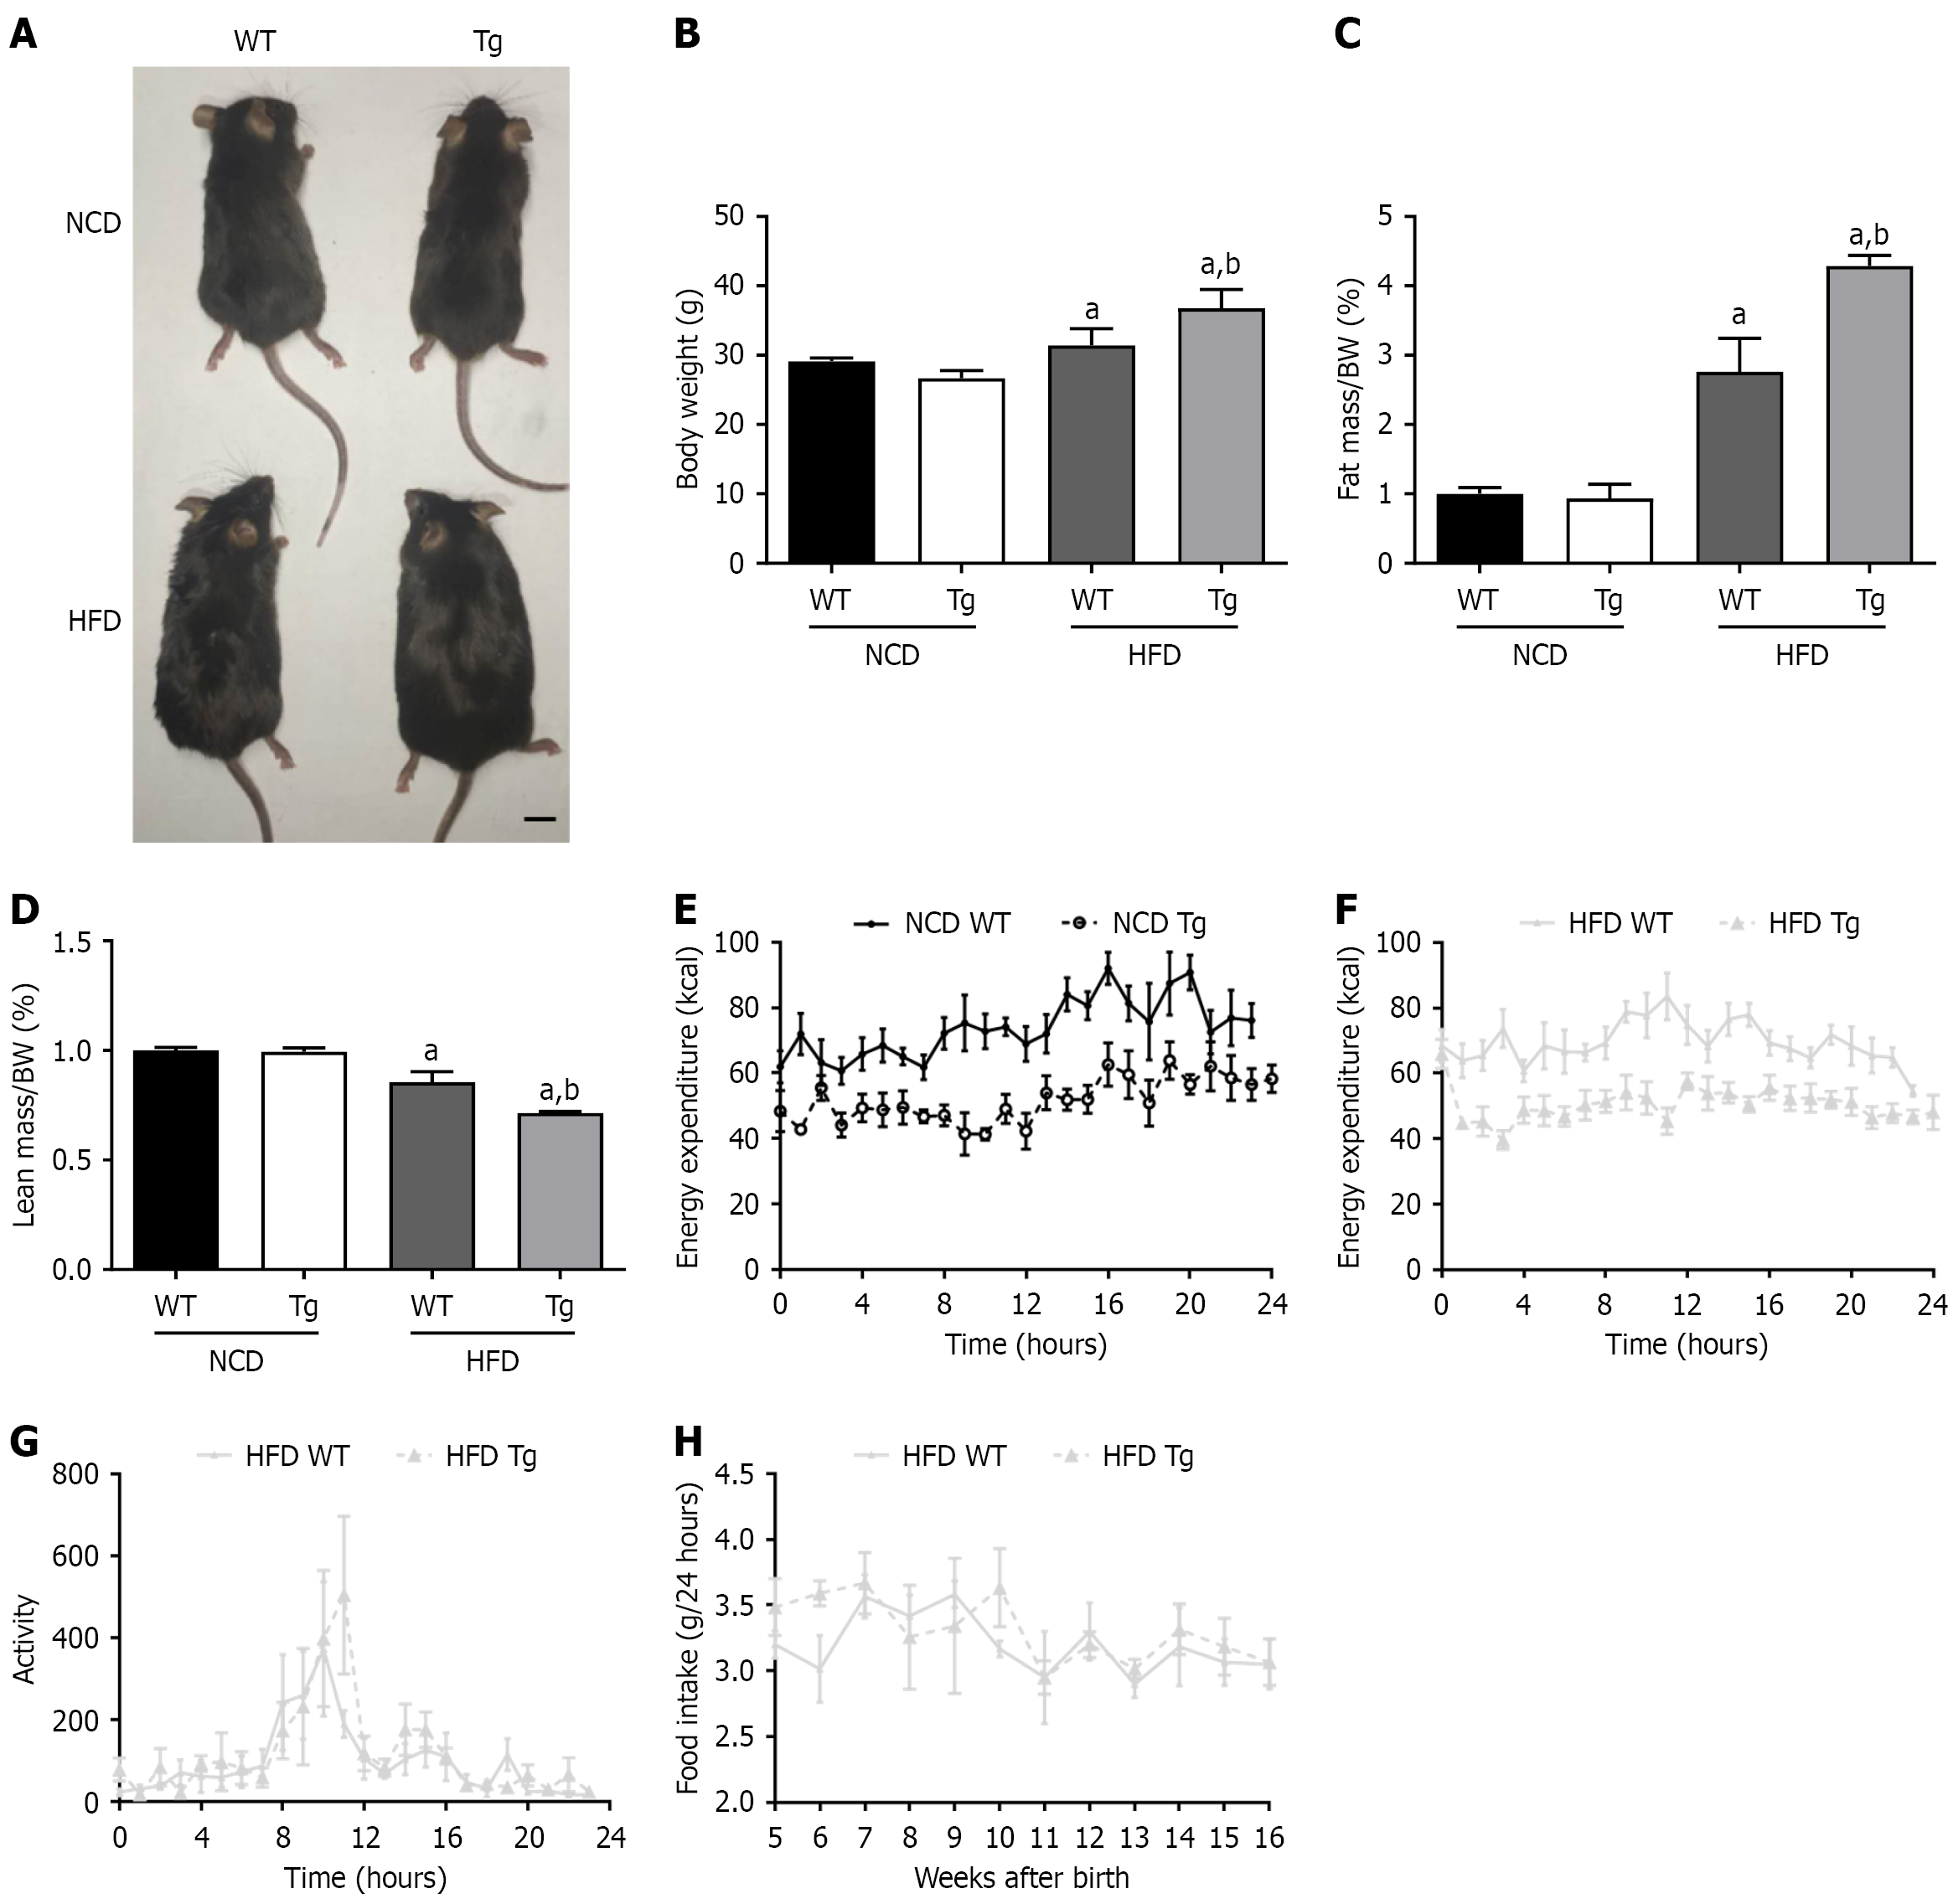
Figure 1 General indexes of S100A11-hTg mice.
All data are presented as mean ± SE. n = 6 mice/group. Statistical analysis was performed using one-way analysis of variance. P values were adjusted for multiple testing using the Bonferroni correction: aP < 0.05 vs normal-chow diet (NCD) wild type, bP < 0.05 vs high-fat (HFD) diet wild type. Five-week-old male S100A11-hTg mice and littermate control mice were fed NCD or HFD for 12 weeks. A: General picture of mice at 17 weeks of age, scale bar: 1 cm; B: Body weight of mice at 17 weeks of age; C: Fat mass as a percentage of body weight; D: Lean mass as a percentage of body weight; E: Energy consumption of mice under NCD; F: Energy consumption of mice under HFD; G: Activity of mice under HFD; H: Food intake of mice under HFD. NCD: Normal-chow diet; HFD: High-fat diet; WT: Wild type.
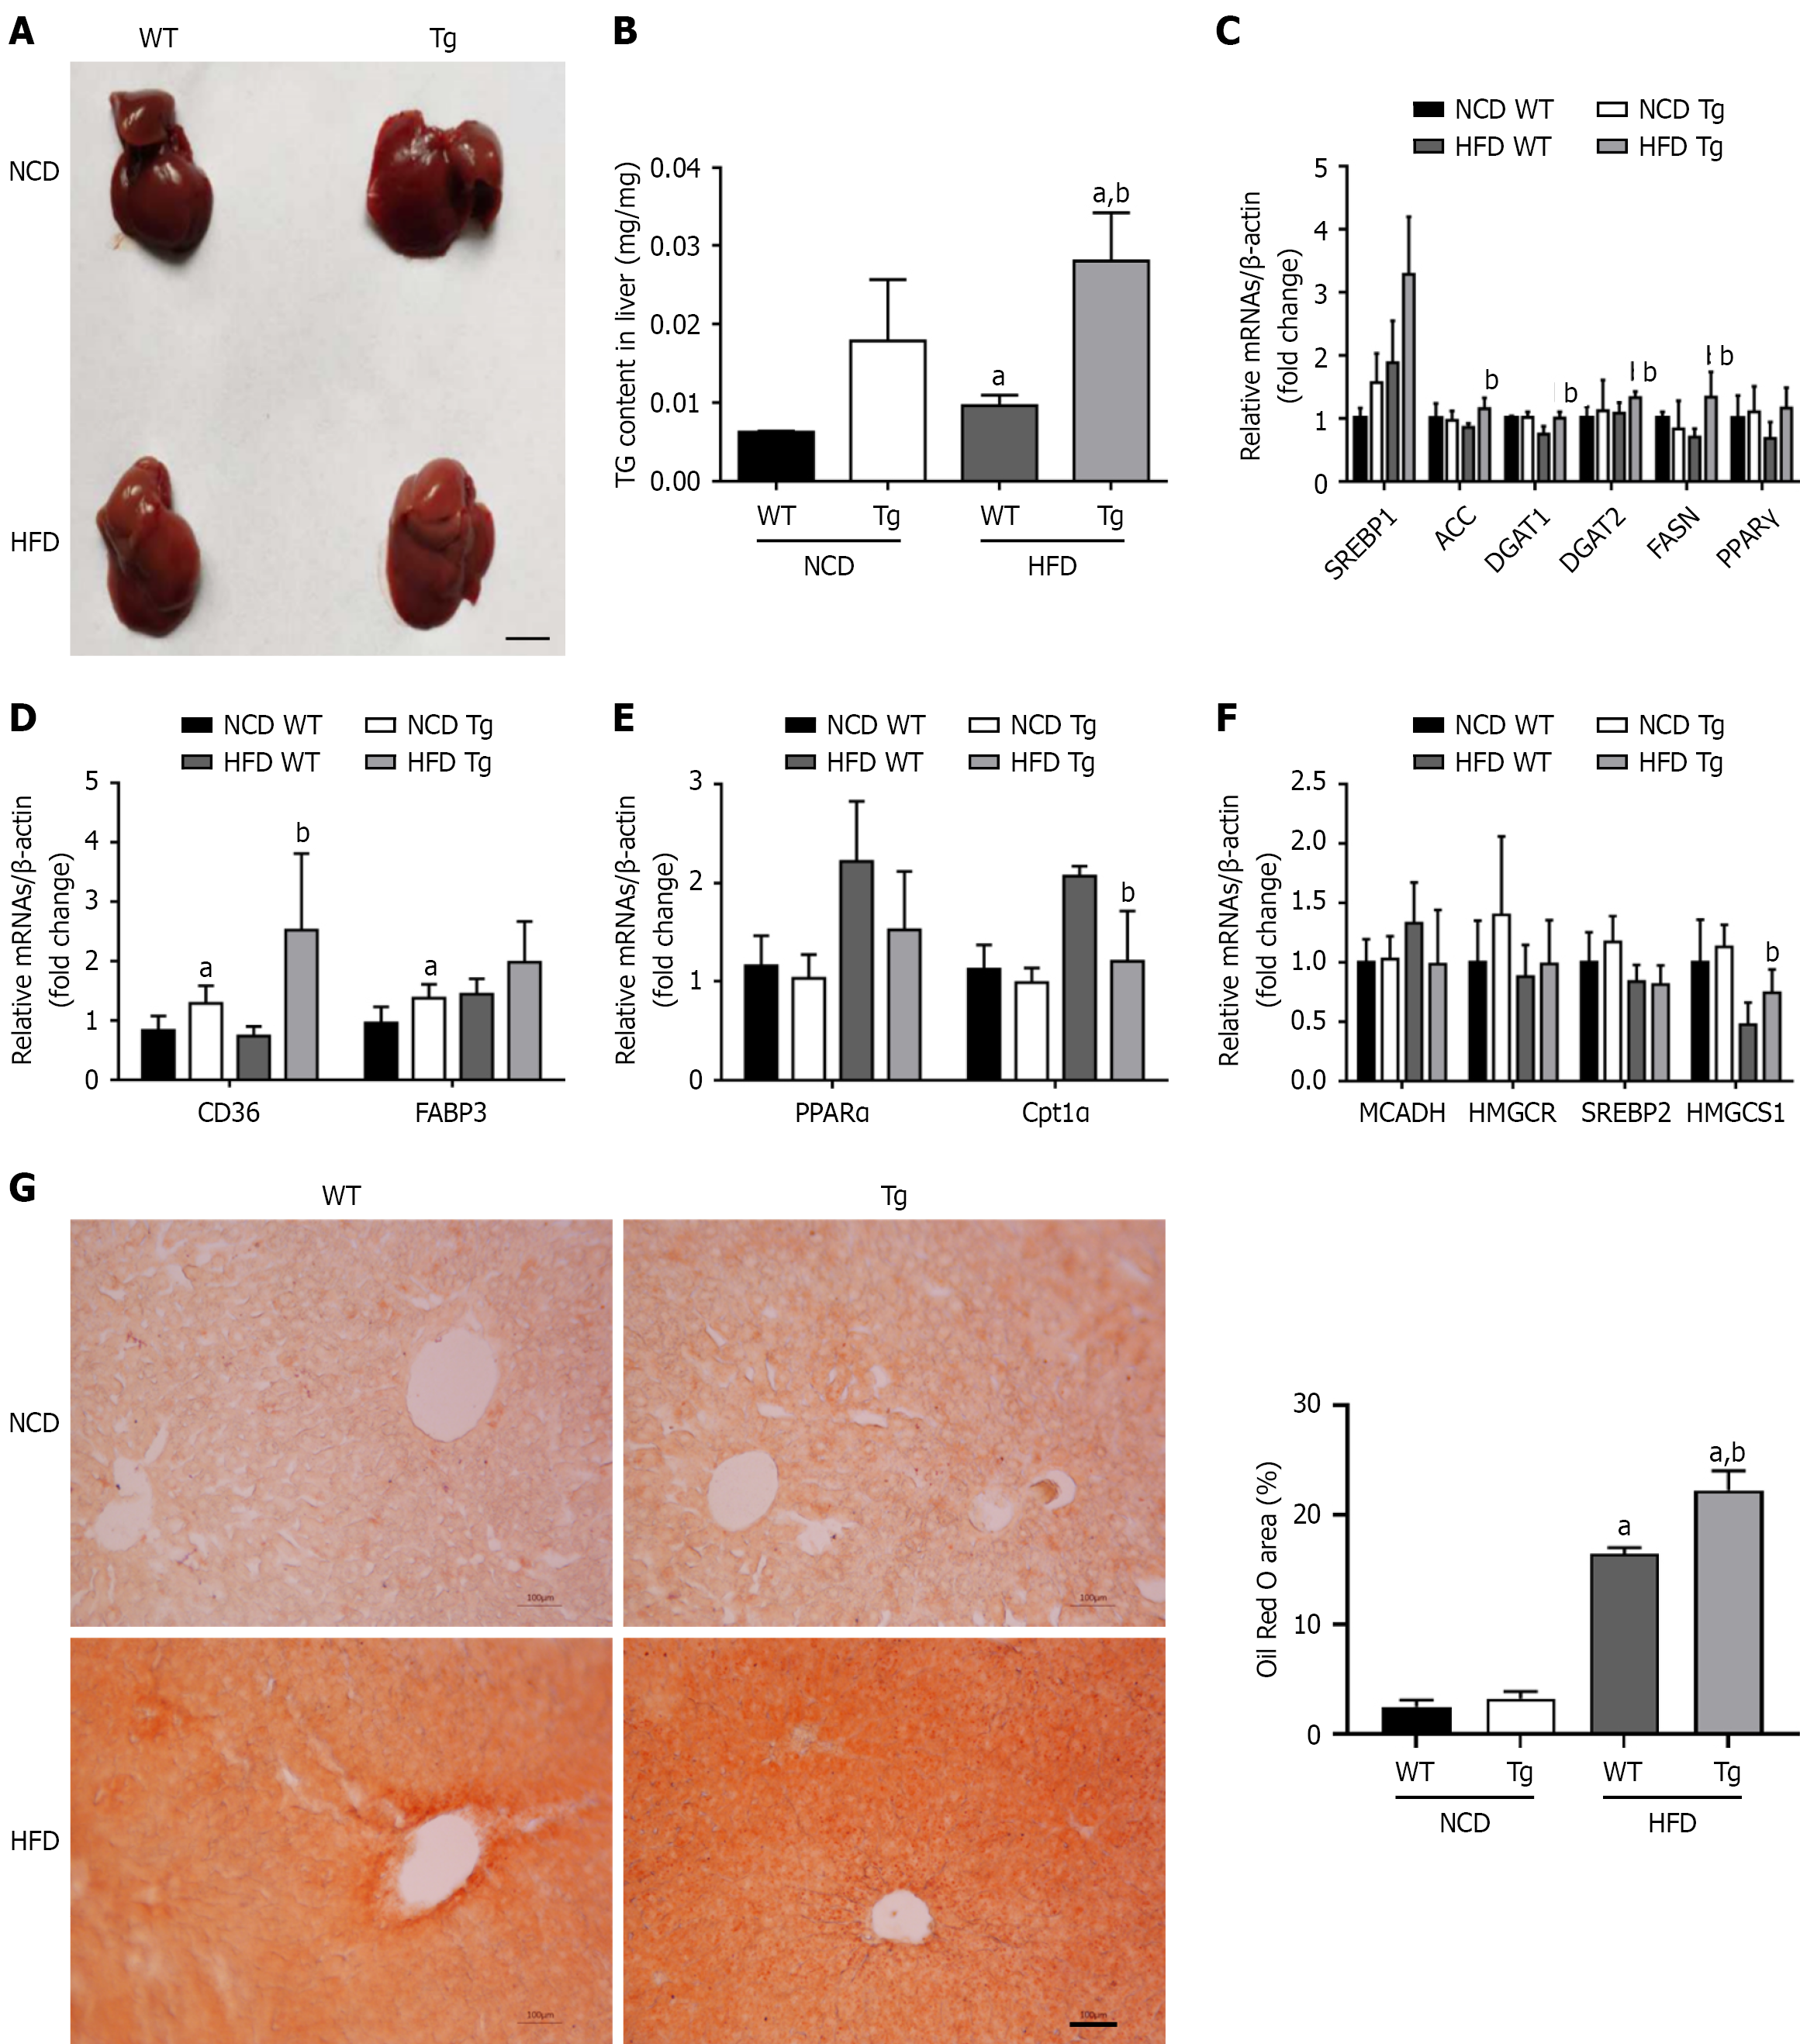
Figure 2 High-fat diet increased liver triglyceride levels in male S100A11-hTg mice.
All data are presented as mean ± SE. n = 5-6 mice/group. Statistical analysis was performed using one-way analysis of variance, P values were adjusted for multiple testing using the Bonferroni correction: aP < 0.05 vs normal-chow diet wild type, bP < 0.05 vs high-fat diet wild type. Five-week-old male S100A11-hTg mice and littermate control mice were fed normal-chow diet or high-fat diet for 12 weeks. A: General liver image of mice at 17 weeks of age, scale bar: 1 cm; B: Triglyceride concentration in the liver of mice at 17 weeks of age; C: Real-time polymerase chain reaction (PCR) was used to detect expression of hepatic lipid synthesis-related genes; D: Real-time PCR was used to detect expression of hepatic lipid uptake-related genes; E: Real-time PCR was used to detect expression of hepatic lipid oxidation-related genes; F: Real-time PCR was used to detect expression of hepatic cholesterol synthesis-related genes; G: Oil Red O staining of mouse liver and quantification of positive areas, scale bar: 100 μm. NCD: Normal-chow diet; HFD: High-fat diet; WT: Wild type; ACC: Acetyl-CoA carboxylase; DGAT: Diacylglycerol acyltransferase; FASN: Fatty acid synthase; PPAR: Peroxisome proliferator-activated receptor; Cpt1α: Carnitine palmitoyltransferase 1α; MCADH: Medium-chain acyl-CoA dehydrogenase; HMGCR: 3-hydroxy-3-methyl-glutaryl-CoA reductase; SREBP2: Sterol regulatory element-binding protein 2; HMGCS1: 3-hydroxy-3-methylglutaryl-CoA synthase 1.
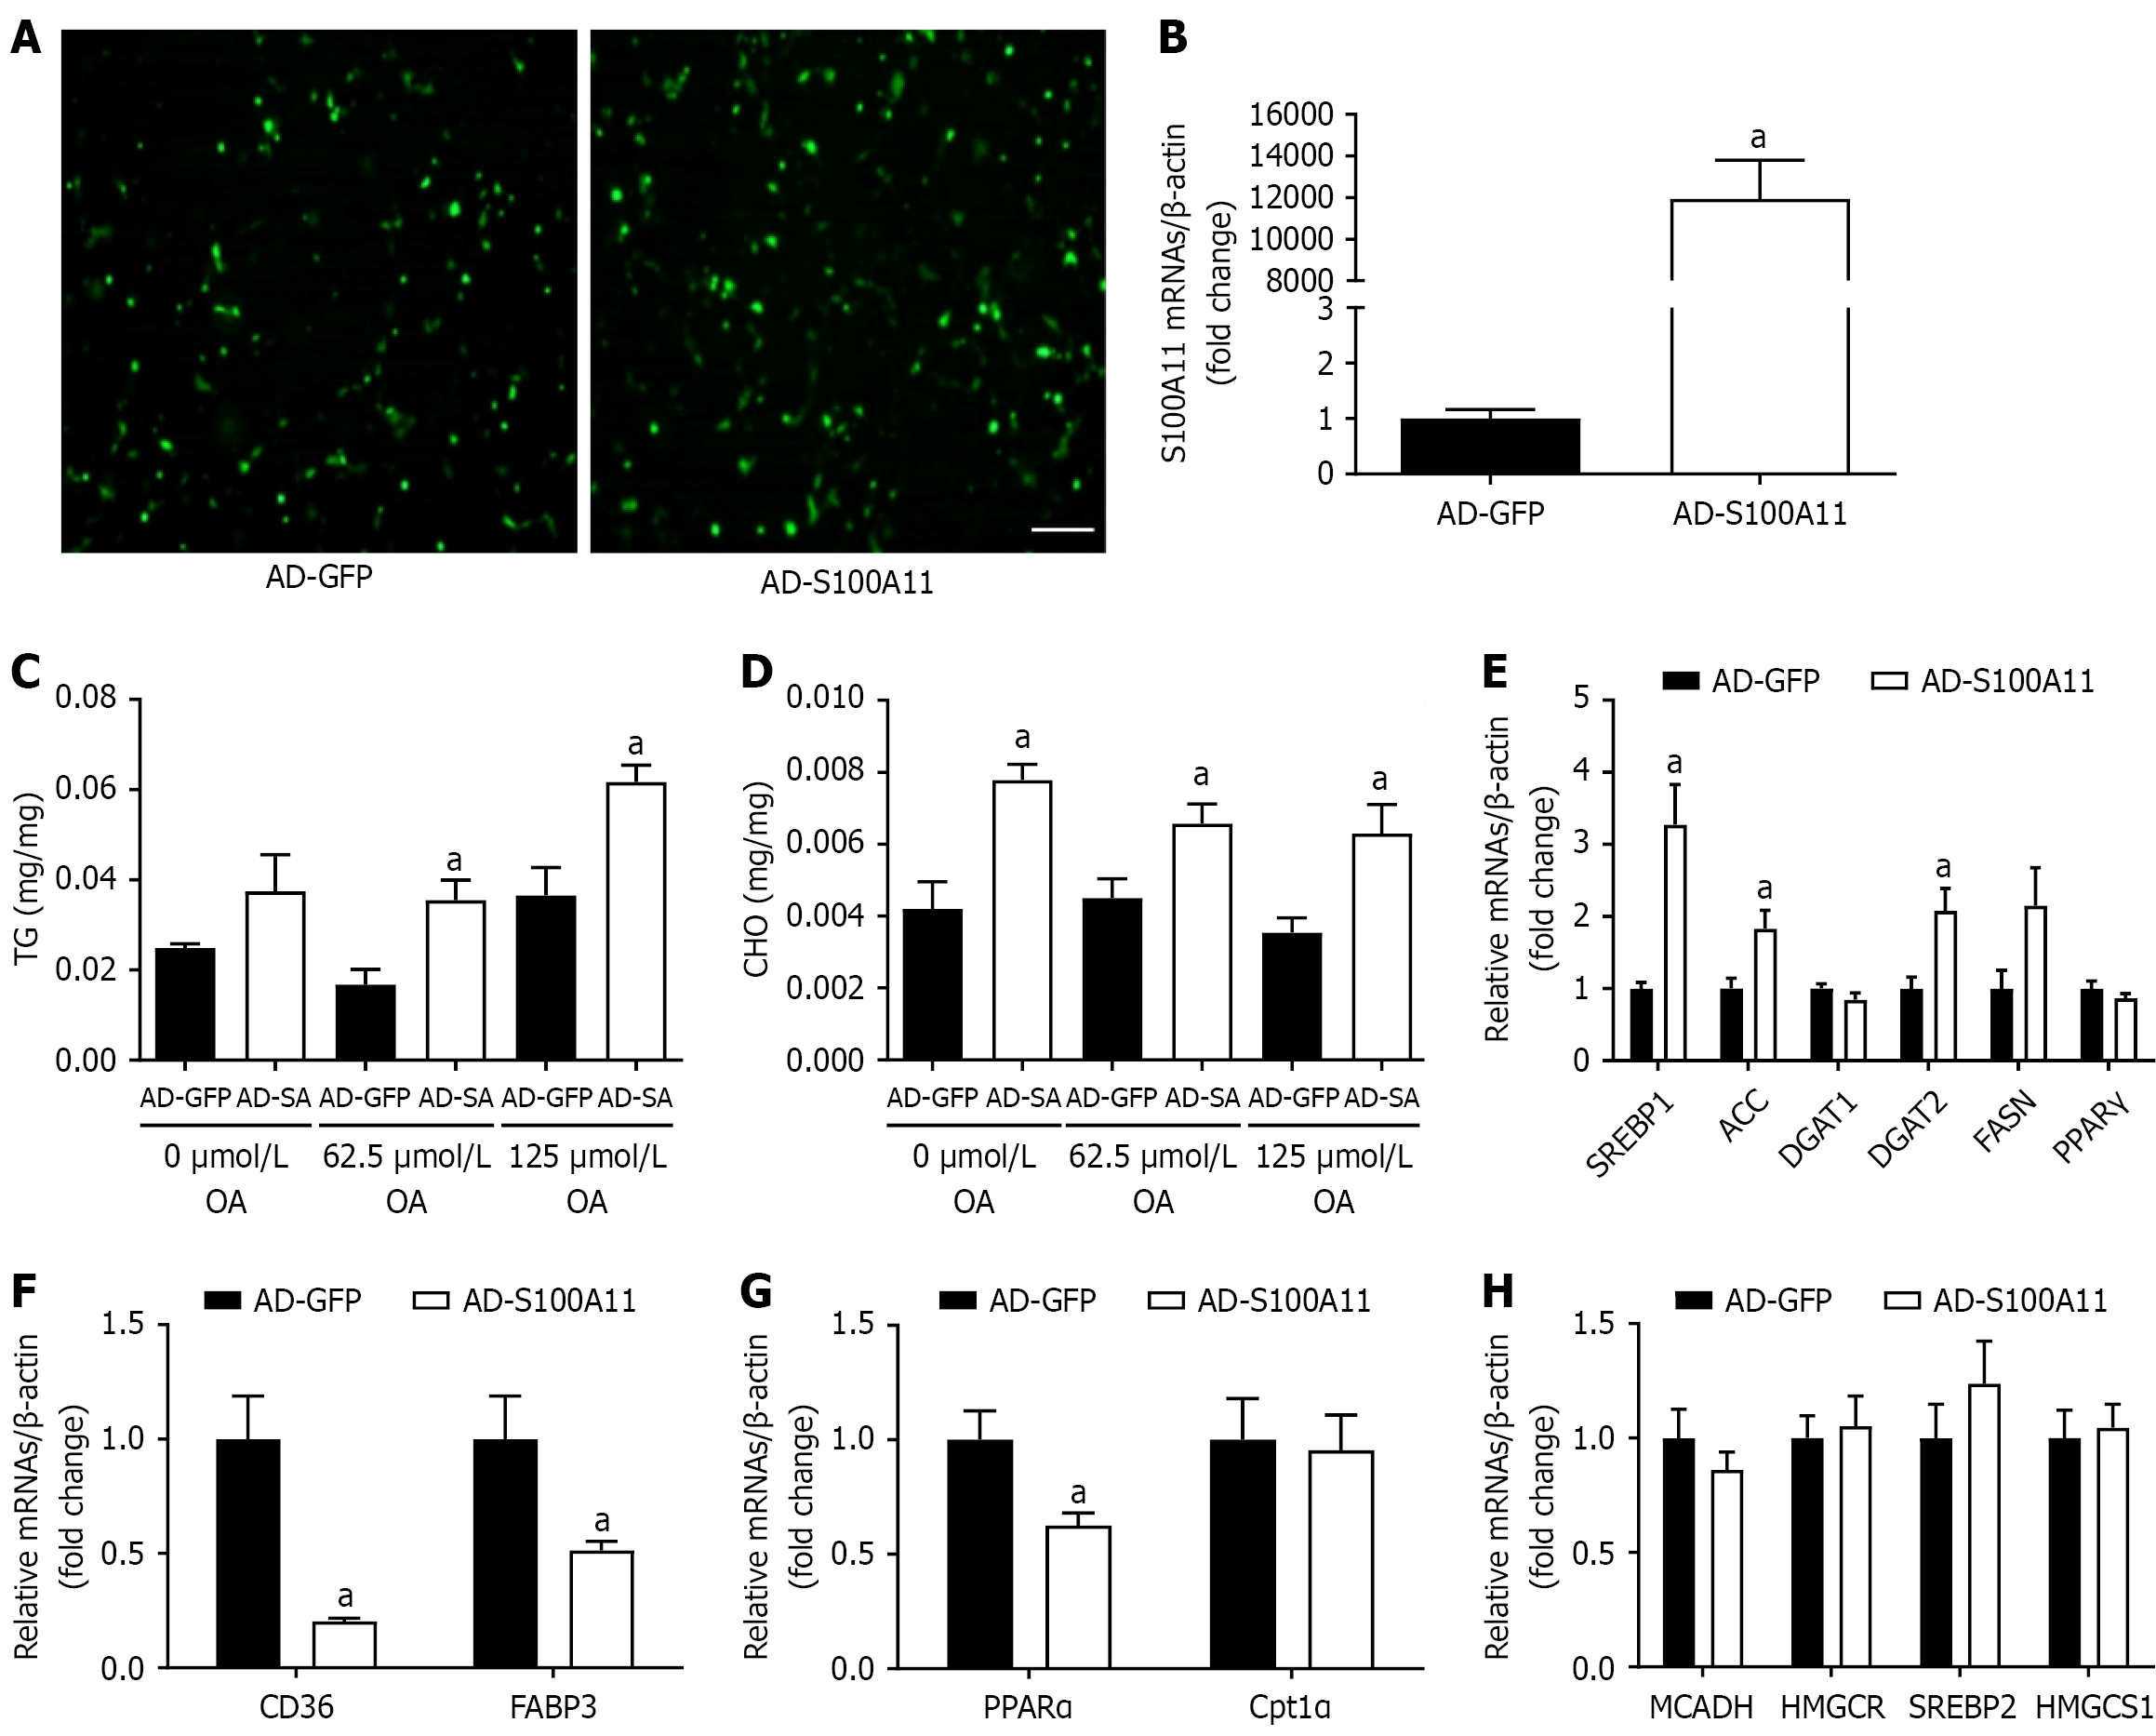
Figure 3 S100A11 gene overexpression of in vitro promotes lipid accumulation in AML12 hepatocyte cell line.
All data are presented as mean ± SE. n = 3-5 biological repeats. Statistical analysis was performed using unpaired two-tailed Student’s t test: aP < 0.05 vs recombinant adenoviruses encoding (AD) green fluorescent protein (GFP). A: AML12 cells infected with AD-S100A11 or AD-GFP as a control and observed under a fluorescent microscope after 48 hours, scale bar: 100 μm; B: Real-time polymerase chain reaction was used to detect expression of S100A11 mRNA; C: AML12 cells were infected with AD-S100A11 or AD-GFP as a control and treated with 0 nmol/L, 62.5 nmol/L, or 125 nmol/L oleic acid for 36 hours to detect triglyceride concentration; D: AML12 cells were infected with AD-S100A11 or AD-GFP as a control and treated with 0 nmol/L, 62.5 nmol/L, or 125 nmol/L oleic acid for 36 hours to detect cholesterol concentration; E-H: Real-time polymerase chain reaction was used to detect expression of liver lipid metabolism. AD-GFP: Recombinant adenoviruses encoding green fluorescent protein; AD-SA/AD-S100A11: Recombinant adenoviruses encoding S100A11; OA: Oleic acid; ACC: Acetyl-CoA carboxylase; DGAT: Diacylglycerol acyltransferase; FASN: Fatty acid synthase; PPAR: Peroxisome proliferator-activated receptor; Cpt1α: Carnitine palmitoyltransferase 1α; MCADH: Medium-chain acyl-CoA dehydrogenase; HMGCR: 3-hydroxy-3-methyl-glutaryl-CoA reductase; SREBP2: Sterol regulatory element-binding protein 2; HMGCS1: 3-hydroxy-3-methylglutaryl-CoA synthase 1.
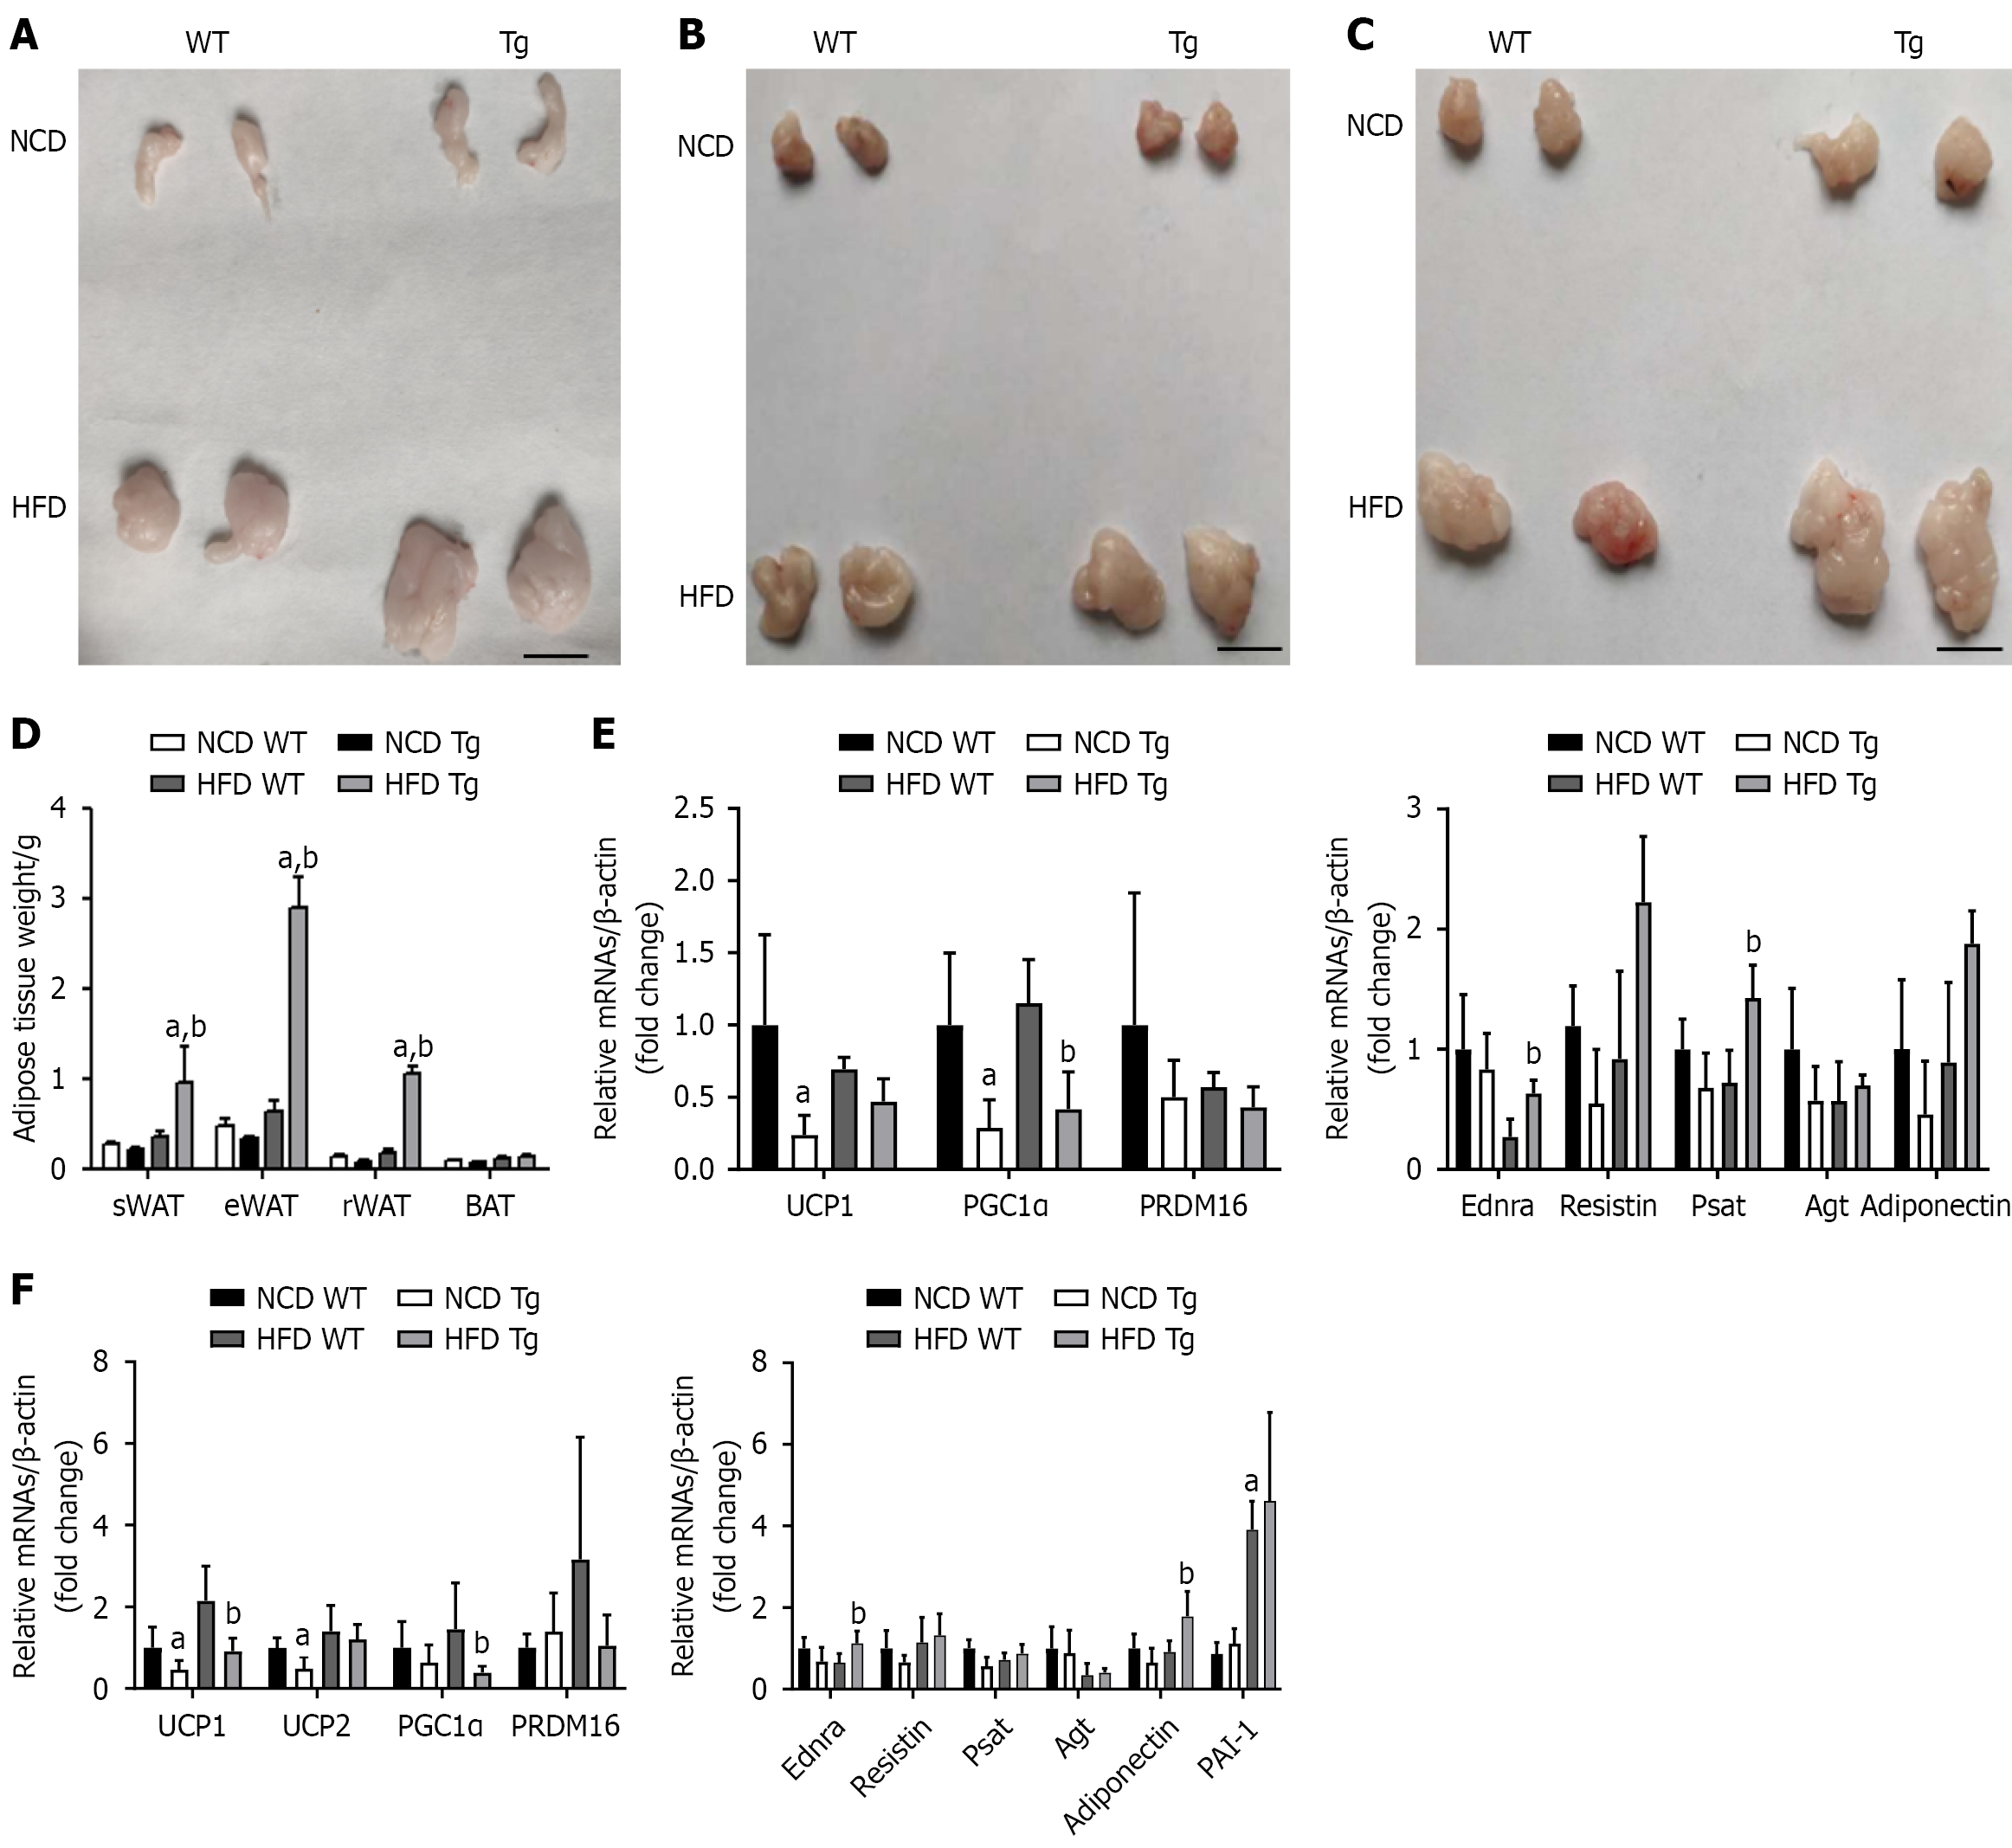
Figure 4 Adipose tissue and expression of fat-related gene mRNA in different tissues of male S100A11-hTg mice.
All data are presented as mean ± SE. n = 6 mice/group. Statistical analysis was performed using one-way analysis of variance, P values were adjusted for multiple testing using the Bonferroni correction: aP < 0.05 vs normal-chow diet wild type, bP < 0.05 vs high-fat diet wild type. Five-week-old male S100A11-hTg mice and control mice were fed with normal-chow diet or high-fat diet for 12 weeks. A: General picture of subcutaneous fat at 17 weeks of age; B: General picture of perirenal fat at 17 weeks of age; C: General picture of epididymal fat at 17 weeks of age; D: At 17 weeks, the weight of adipose tissue in each region of the mice; E: Real-time polymerase chain reaction was used to detect expression of brown fat-related genes (left) and white fat-related genes (right) in white adipose tissue of the epididymis. F: Real time polymerase chain reaction was used to detect the expression level of brown fat-related genes (left) and white fat-related genes (right) in brown adipose tissue. Scale bar: 1 cm. NCD: Normal-chow diet; HFD: High-fat diet; WT: Wild type; sWAT: Subcutaneous white adipose tissue; eWAT: Epididymal white adipose tissue; rWAT: Retroperitoneal white adipose tissue; BAT: Brown adipose tissue; UCP1: Uncoupling protein 1; PGC1α: Peroxisome proliferator-activated receptor gamma coactivator 1-α; PRDM16: PR domain containing 16; PAI-1: Plasminogen activator inhibitor-1.
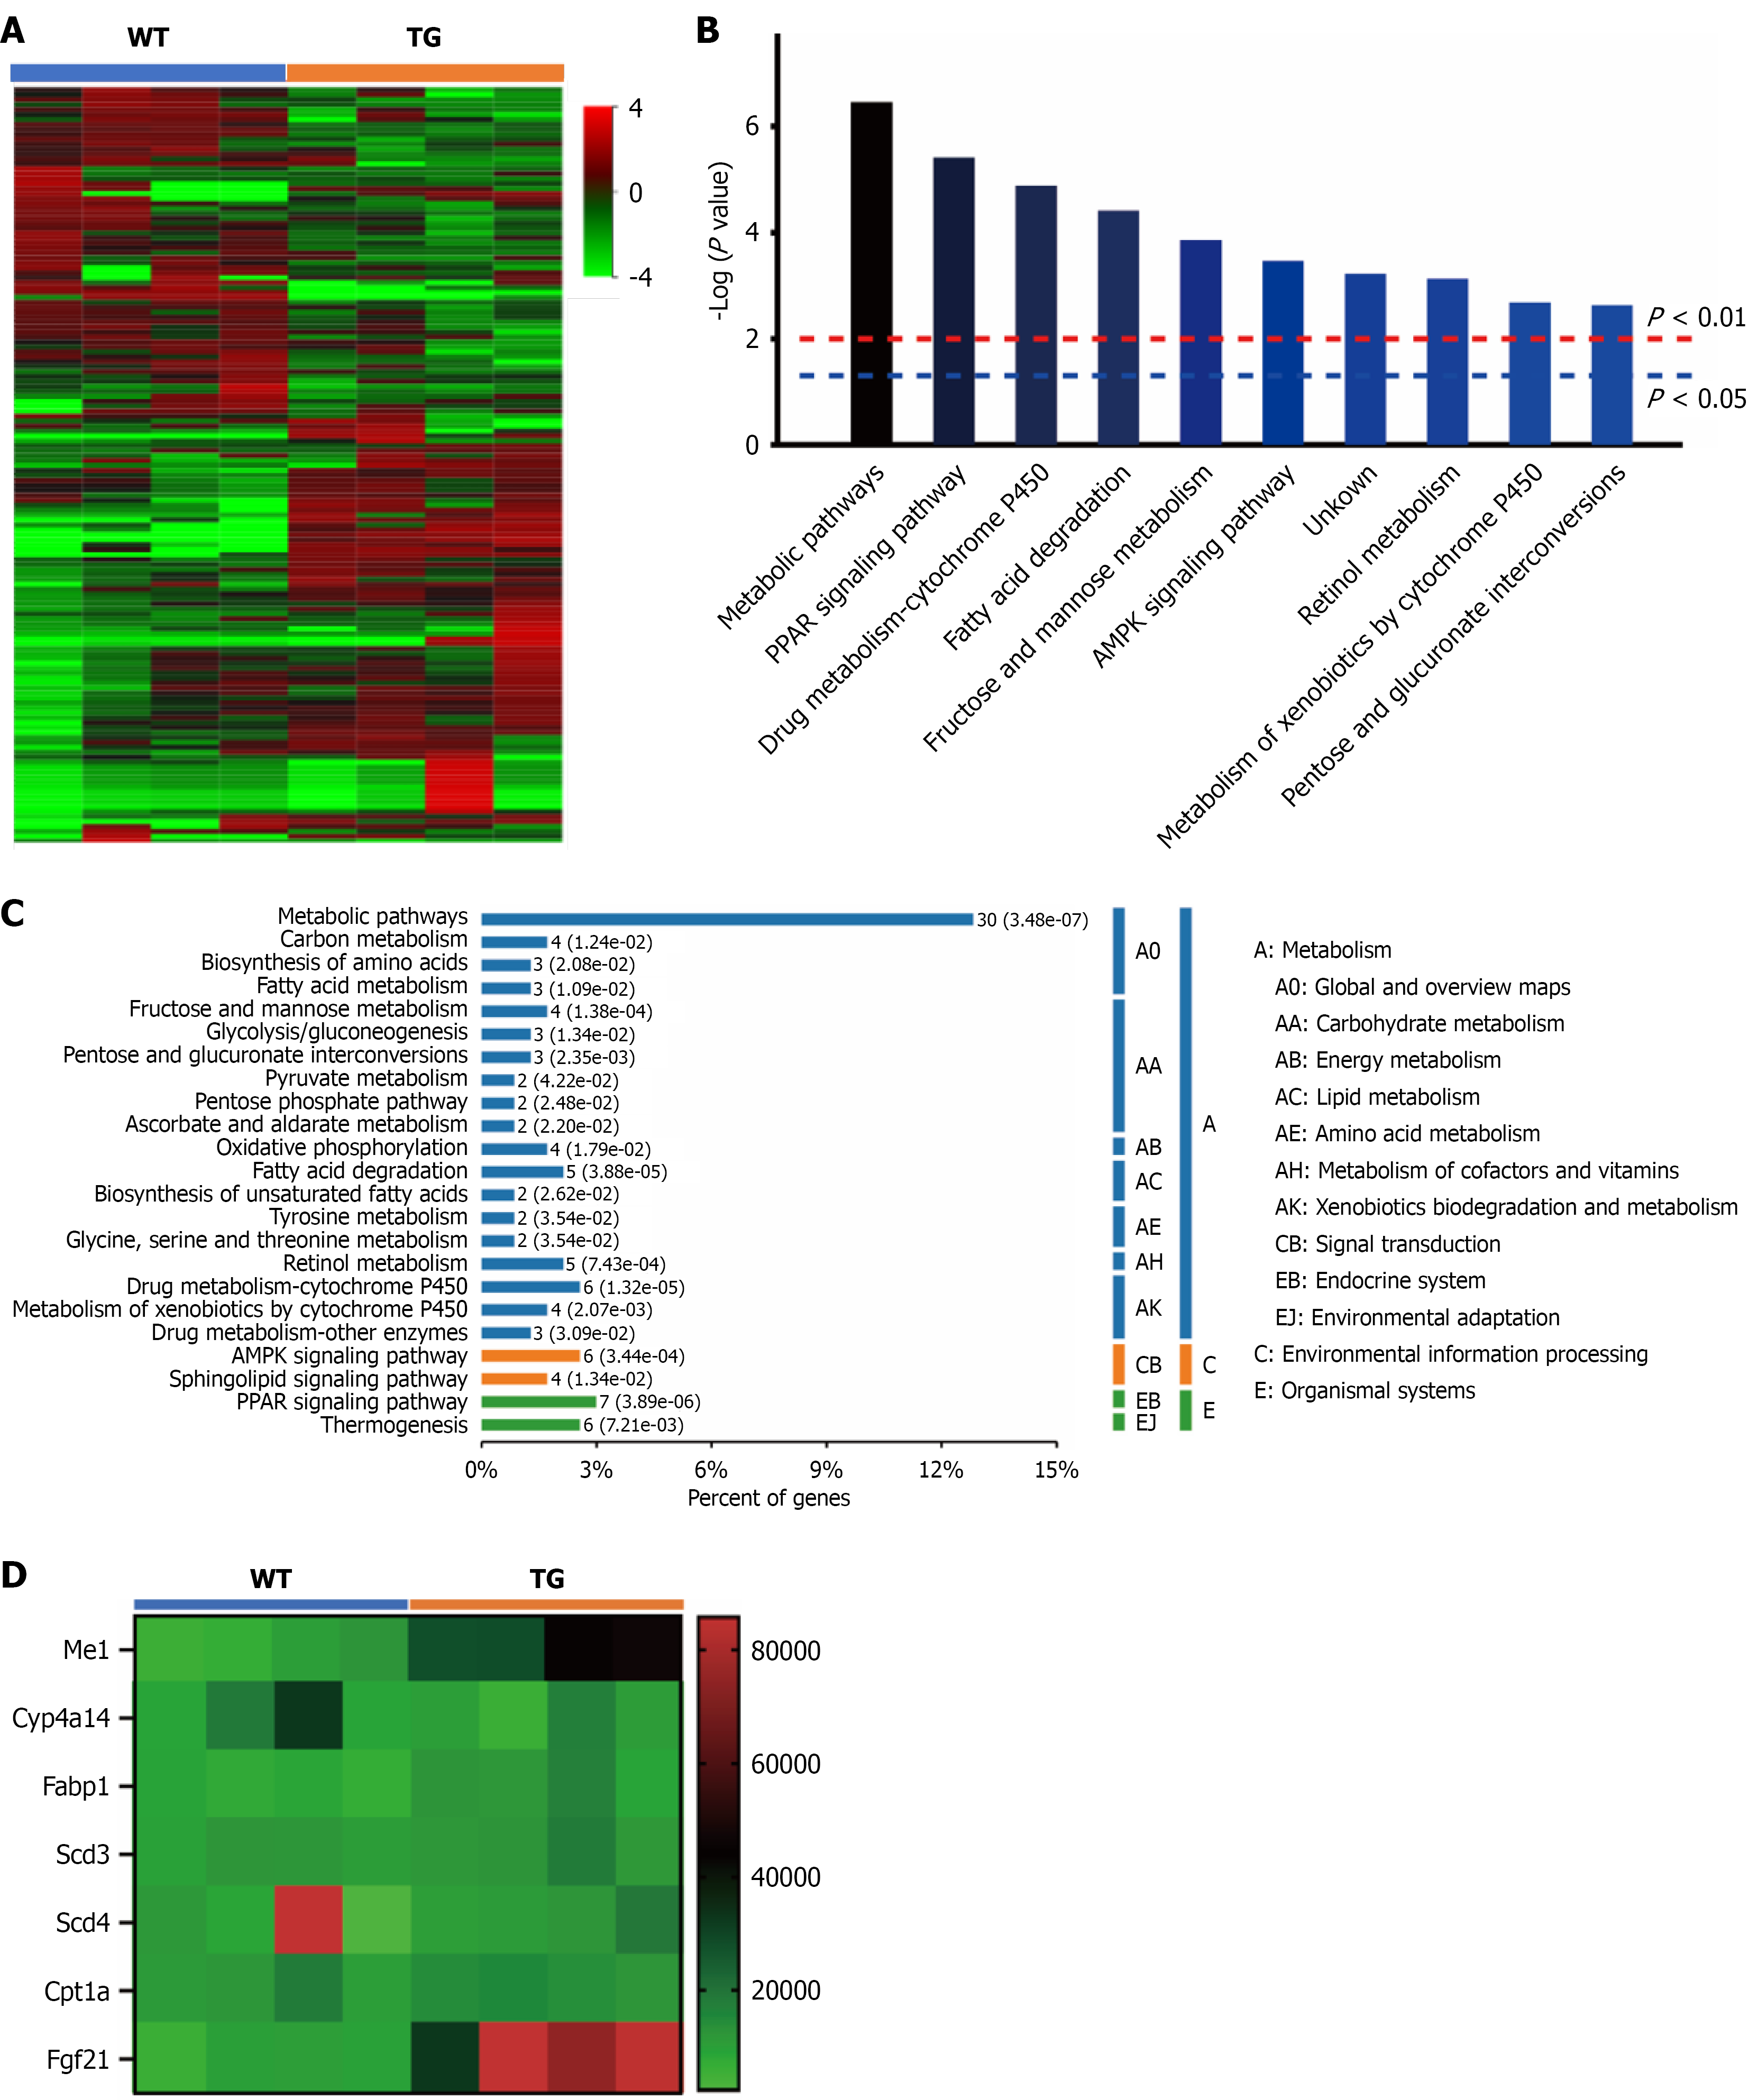
Figure 5 Fibroblast growth factor 21 may play a crucial role in promoting S100A11-mediated lipogenesis.
Proteomic analysis of liver tissues from high-fat diet-fed male mice. A: Heatmap of differentially expressed genes according to the threshold of |fold change| ≥ 1.5 with a false discovery rate-adjusted P < 0.05 (Benjamini-Hochberg method); B: Distribution of enriched Kyoto Encyclopedia of Genes And Genomes pathway; C: Class of enriched Kyoto Encyclopedia of Genes And Genomes pathway; D: Gene heatmap enriched in the peroxisome proliferator-activated receptor signaling pathway. n = 4 mice/group. WT: Wild type.
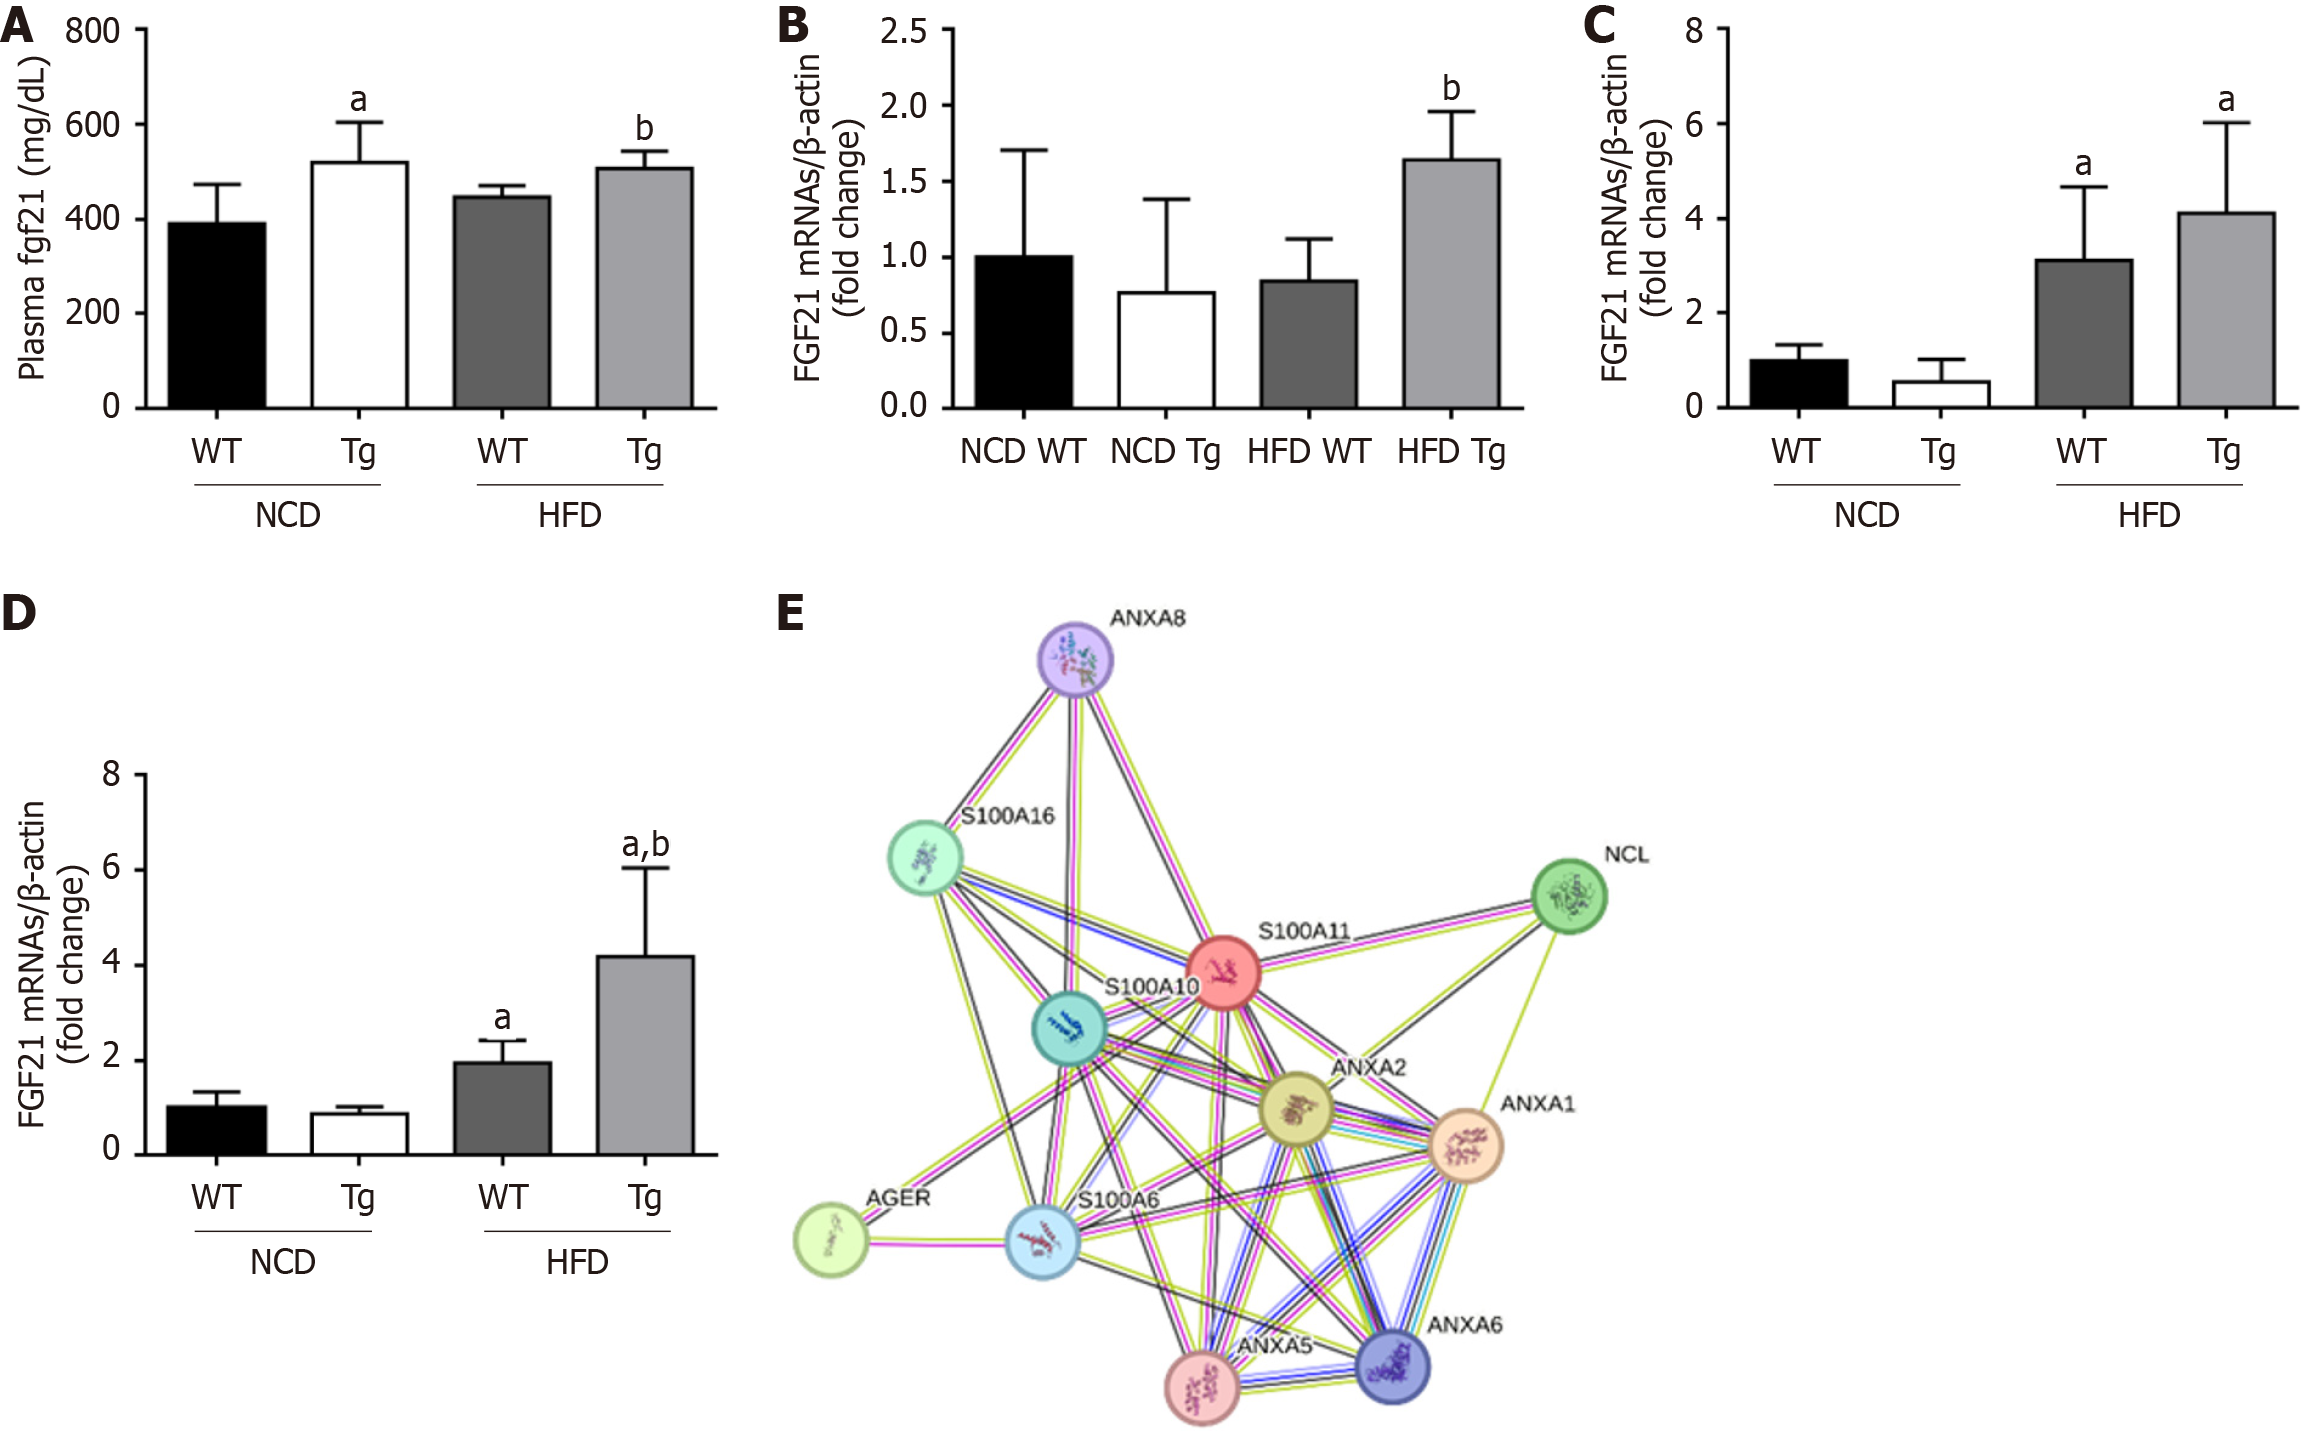
Figure 6 Fibroblast growth factor 21 levels in tissues and plasma of male S100A11-hTg mice.
All data are presented as means ± SE. n = 5 or 6 mice/group. Statistical analysis was performed using one-way analysis of variance, P values were adjusted for multiple testing using the Bonferroni correction: aP < 0.05 vs normal-chow diet wild type, bP < 0.05 vs high-fat diet wild type. Five-week-old male S100A11-hTg mice and littermate control mice were fed normal-chow diet or high-fat diet for 12 weeks. A: Plasma fibroblast growth factor 21 (FGF21) level at 17 weeks of age; B: Liver FGF21 mRNA expression level at 17 weeks of age; C: Fgf21 mRNA expression level in brown adipose tissue at 17 weeks of age; D: Fgf21 mRNA expression level in epididymal white adipose tissue of mice at 17 weeks of age; E: Protein interaction network of human S100A11. Protein-protein interaction network of human S100A11 generated by the STRING database (Homo sapiens). High-confidence interactors are shown (minimum required interaction score: 0.700). Key interaction partners are labeled, including members of the S100 protein family, annexin family proteins, the receptor for advanced glycation end products, and the multifunctional nucleolar protein nucleolin. FGF21: Fibroblast growth factor 21; NCD: Normal-chow diet; HFD: High-fat diet; WT: Wild type.
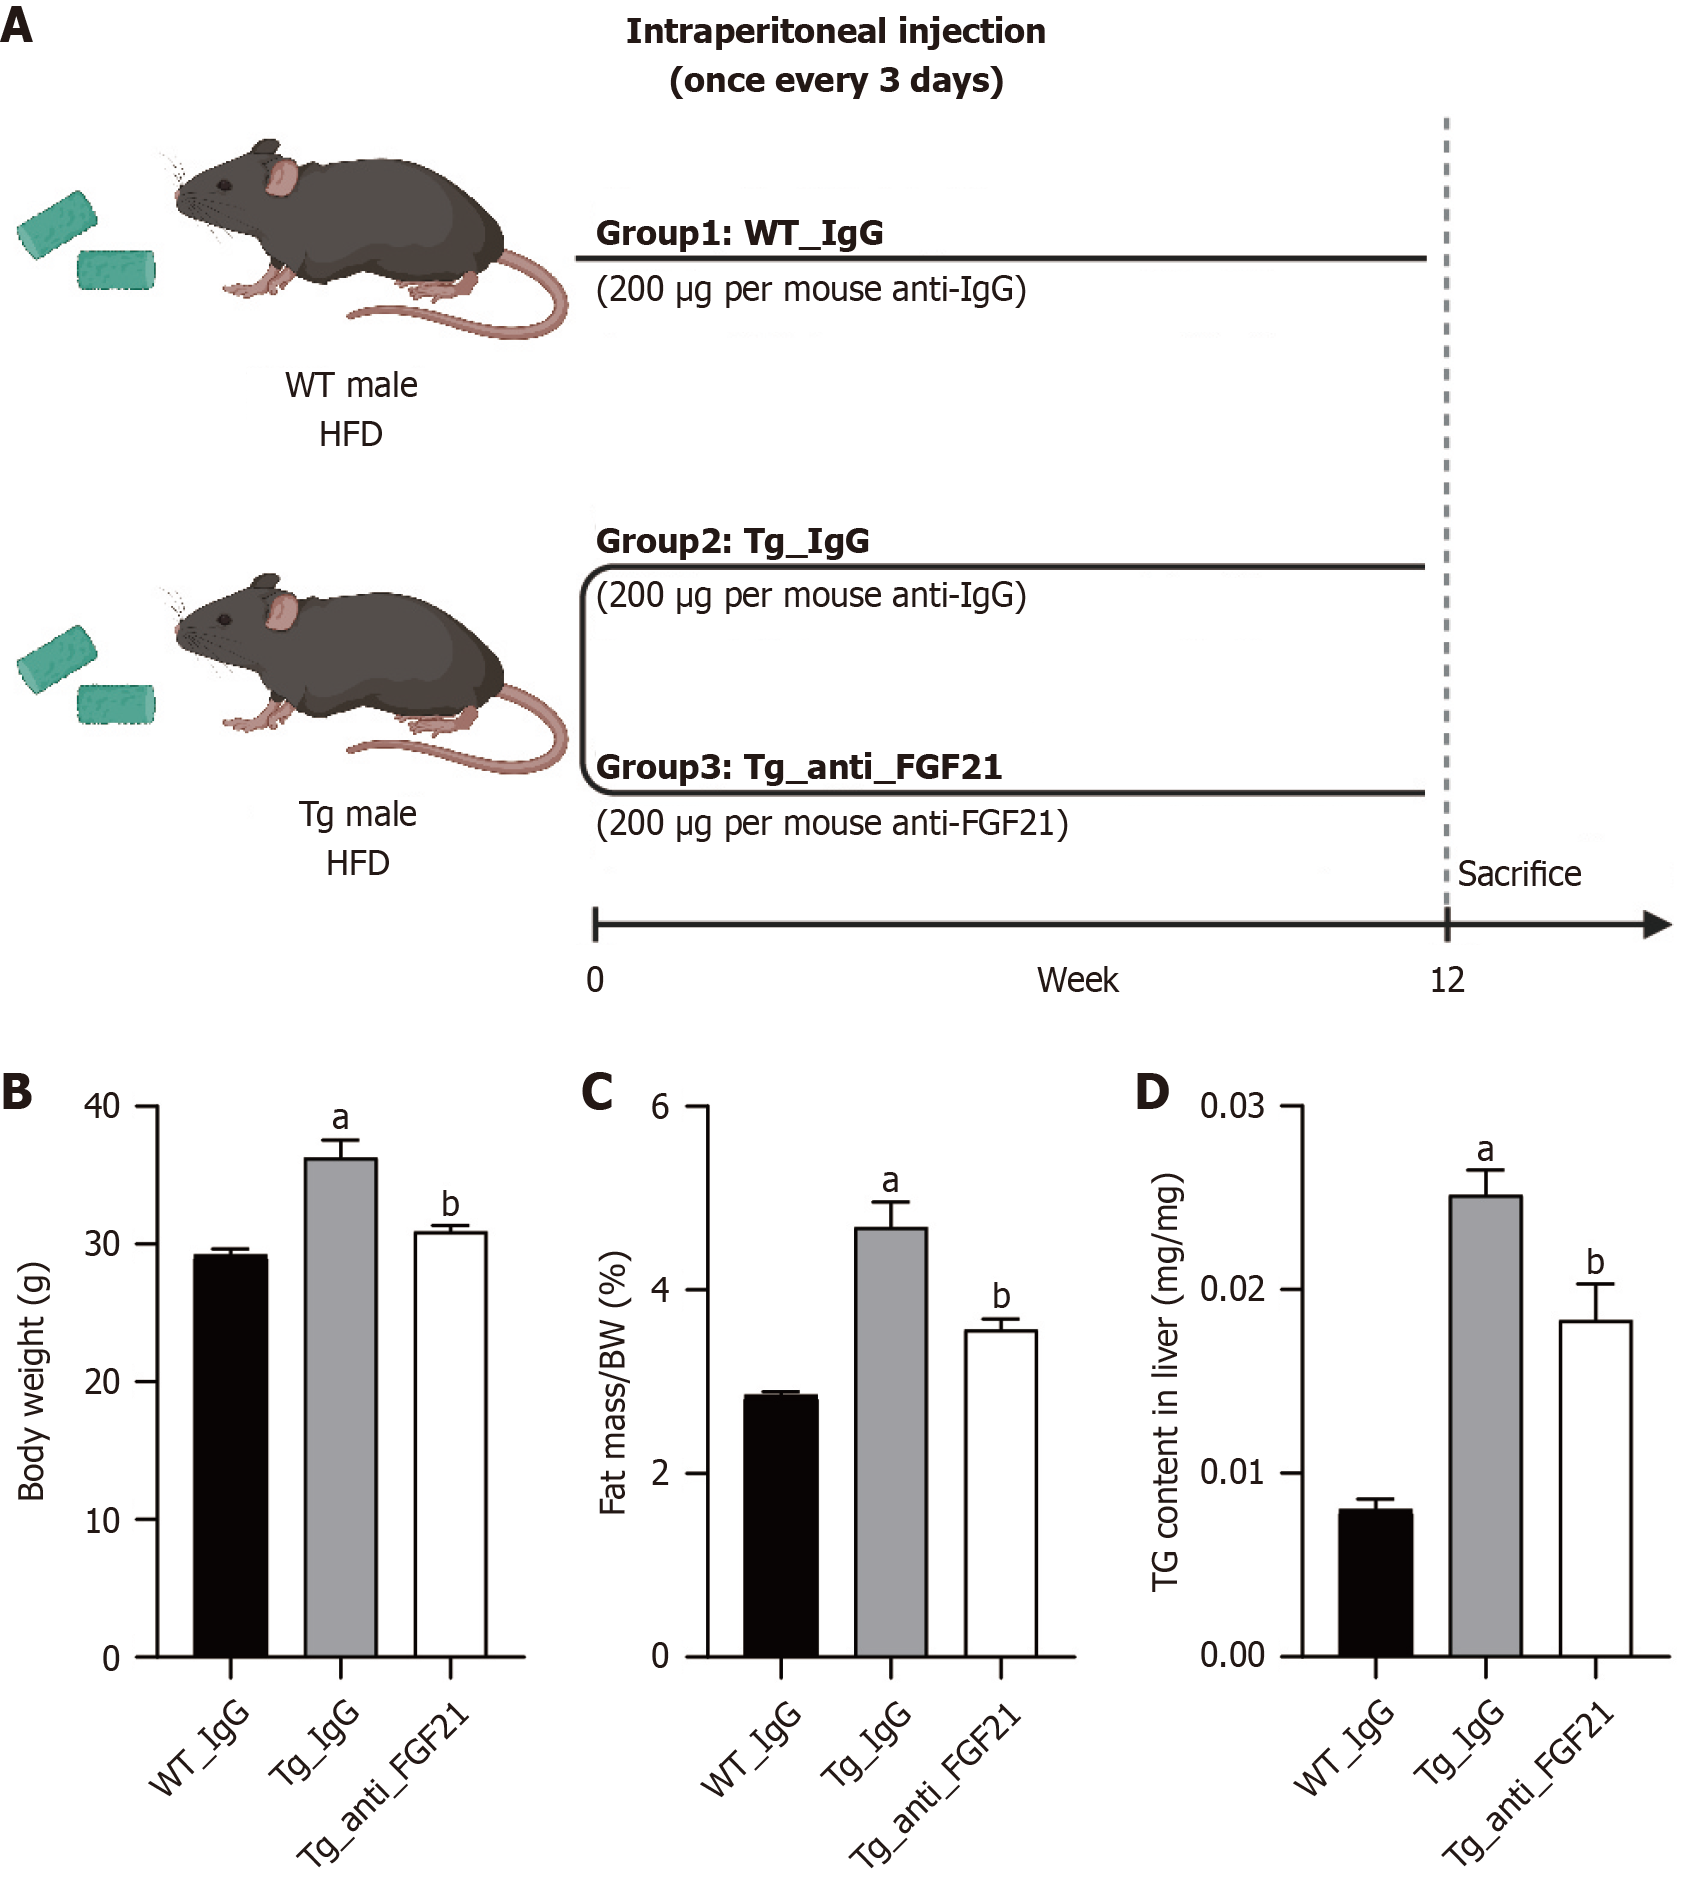
Figure 7 Fibroblast growth factor 21 neutralization partially reverses S100A11-induced lipid accumulation in vivo.
All data are presented as mean ± SE. n = 6 biological replicates. Statistical analysis was performed using unpaired two-tailed Student’s t-test: aP < 0.05 vs wild type_IgG, bP < 0.05 vs transgenic _IgG. Five-week-old male wild type and transgenic mice were fed a high-fat diet for 12 weeks, during which they were injected with either a fibroblast growth factor 21-neutralizing antibody or its isotype control every 3 days. A: Schematic diagram of the experimental design; B: Body weight; C: Body fat percentage; D: Hepatic triglyceride content. FGF21: Fibroblast growth factor 21; WT: Wild type; BW: Body weight.
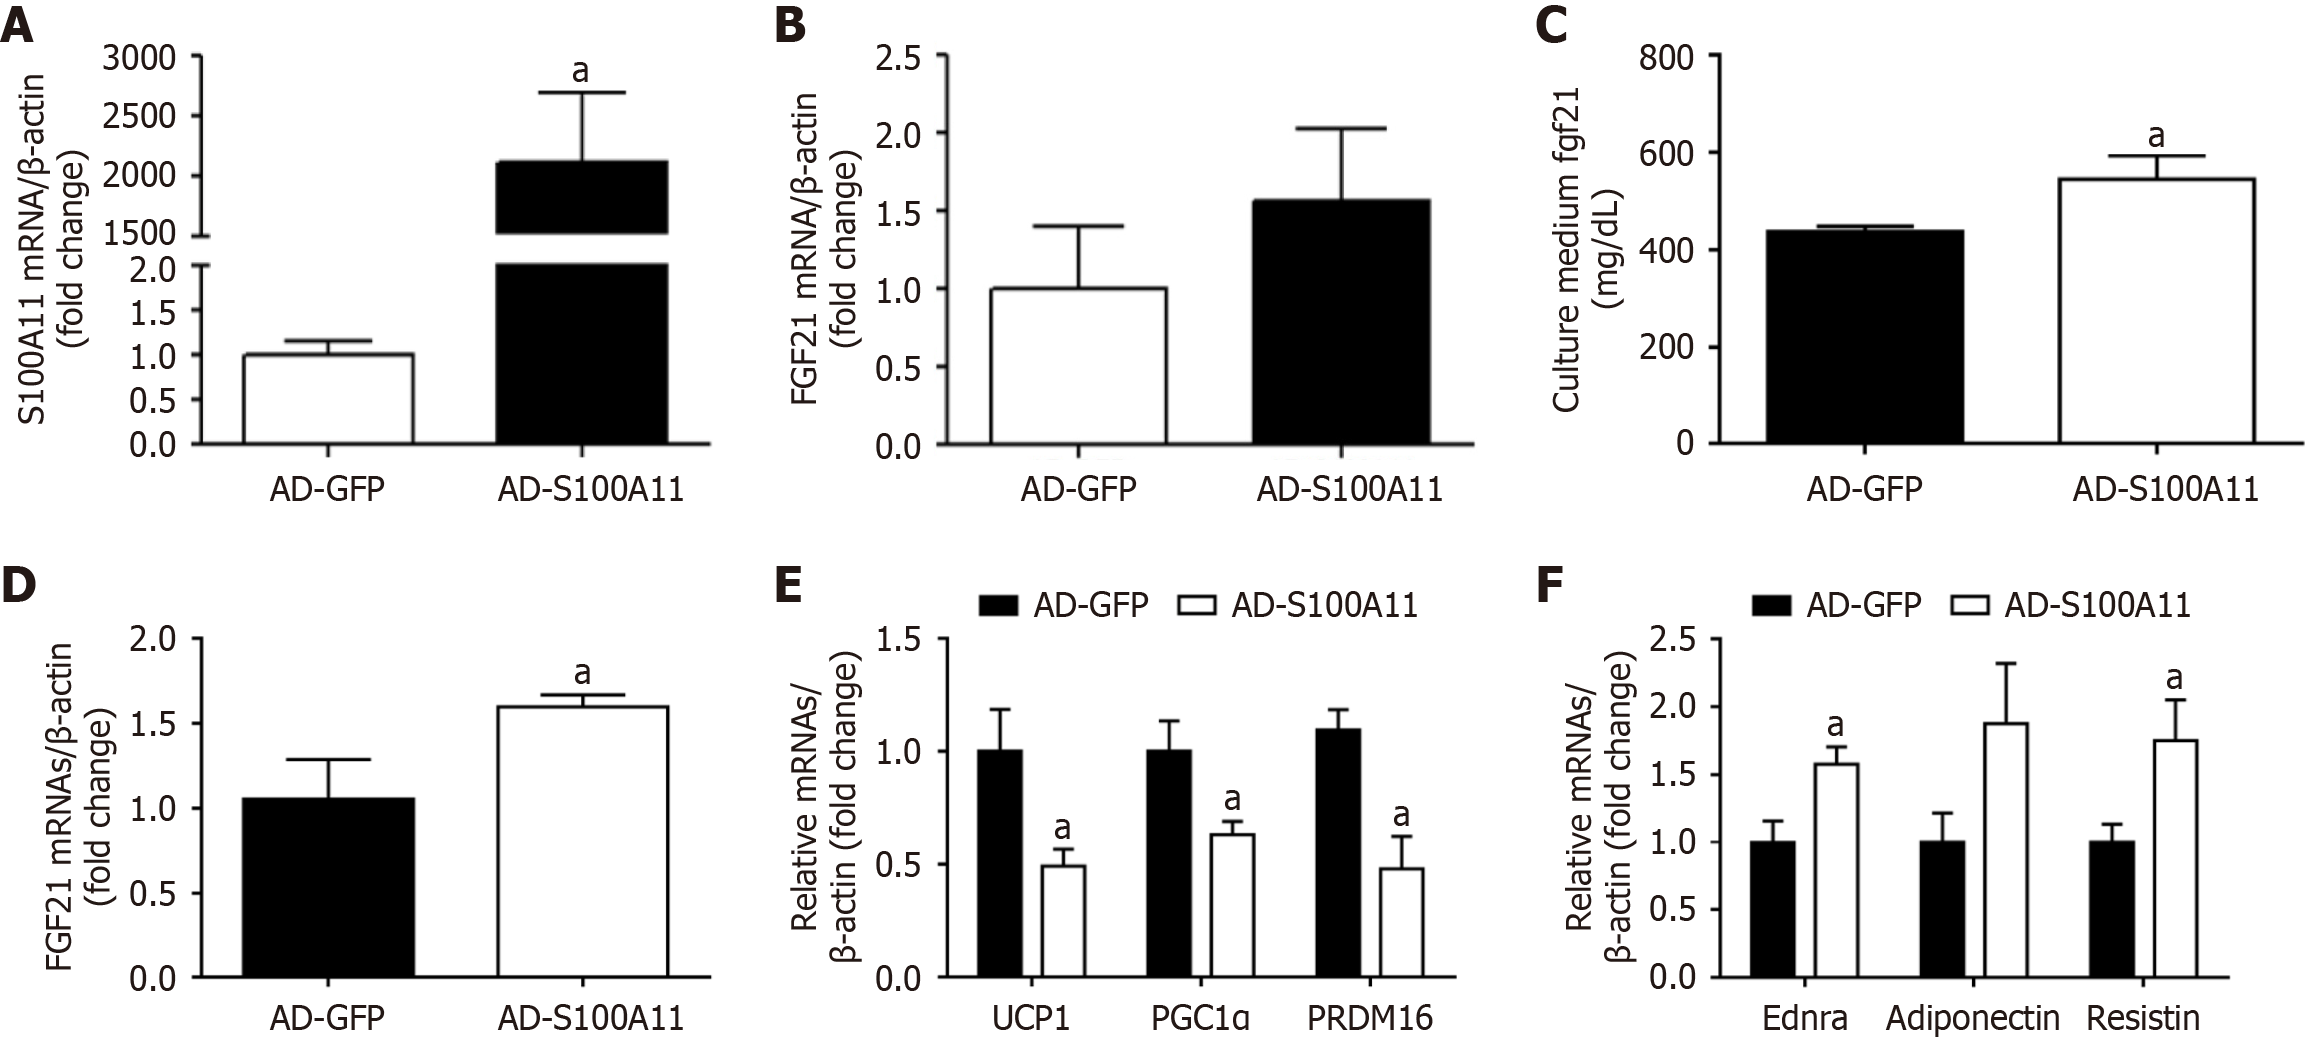
Figure 8 S100A11 overexpression in hepatocytes promotes lipid accumulation in adipocytes.
All data are presented as mean ± SE. n = 5 or 6 biological repeats. Statistical analysis was performed using unpaired two-tailed Student’s t test: aP < 0.05 vs recombinant adenoviruses encoding green fluorescent protein. Mouse-derived normal liver AML12 cells were cocultured with preadipocyte 3T3-L1 cells in vitro. When 3T3-L1 cells were approximately 70% confluent, adipogenic differentiation was performed, and recombinant adenoviruses encoding S100A11 were transfected into hepatocytes. Real-time polymerase chain reaction was used to detect related mRNA levels of AML12 cells and 3T3-L1 cells after 72 hours. A: MRNA level of S100A11 in AML12 cells; B: MRNA level of fibroblast growth factor 21 (FGF21) in AML12 cells; C: FGF21 level in AML12 cell culture supernatant; D: MRNA level of Fgf21 in 3T3-L1 cells; E and F: Expression levels of genes related to brown adipose tissue and white adipose tissue in 3T3-L1 cells. FGF21: Fibroblast growth factor 21; AD-GFP: Recombinant adenoviruses encoding green fluorescent protein; AD-SA/AD-S100A11: Recombinant adenoviruses encoding S100A11; UCP1: Uncoupling protein 1; PGC1α: Peroxisome proliferator-activated receptor gamma coactivator 1-α; PRDM16: PR domain containing 16.
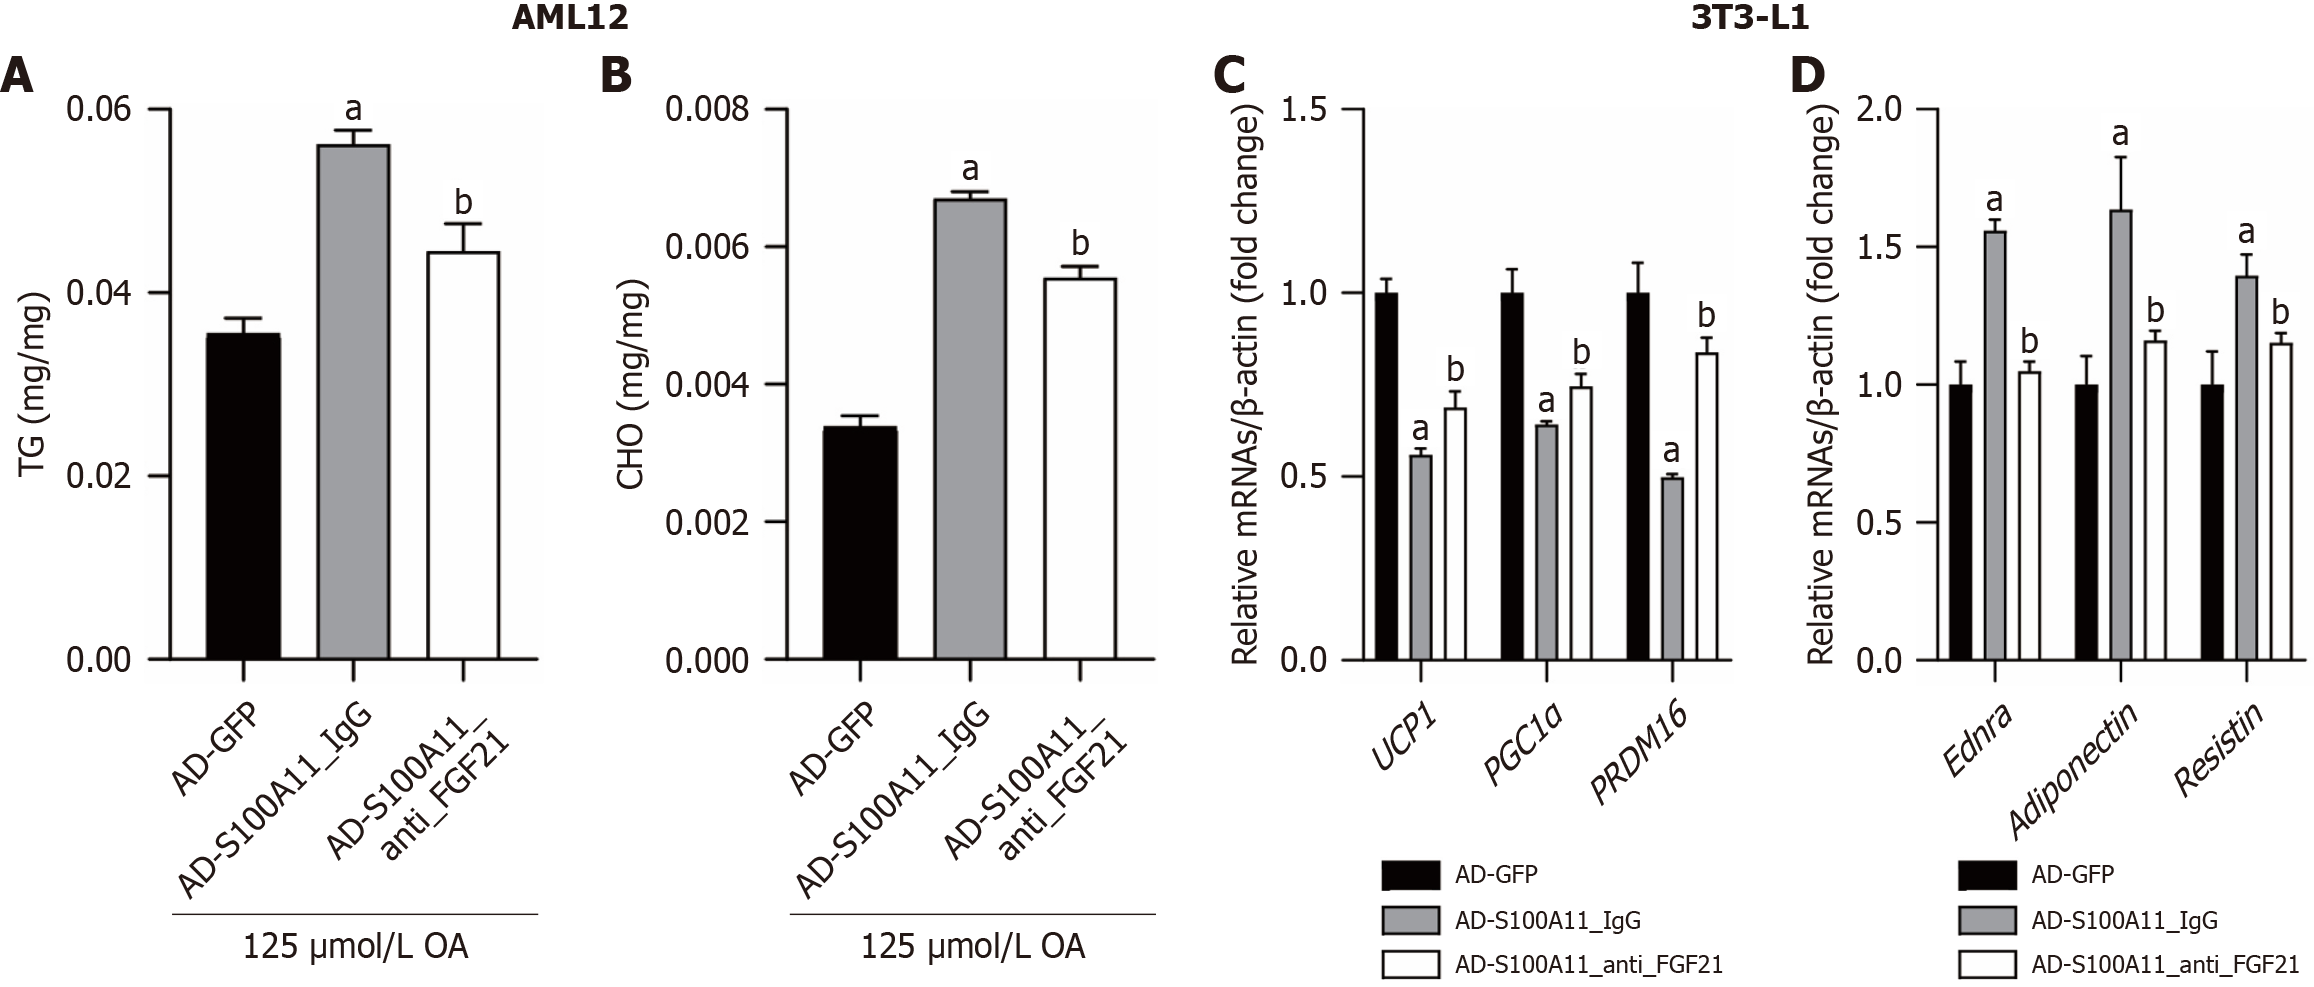
Figure 9 Fibroblast growth factor 21 neutralization partially reverses S100A11-induced lipid accumulation in vitro.
All data are presented as mean ± SE. n = 6 biological replicates. Statistical analysis was performed using unpaired two-tailed Student’s t-test: aP < 0.05 vs recombinant adenoviruses encoding green fluorescent protein, bP < 0.05 vs recombinant adenoviruses encoding S100A11_IgG. A: Triglyceride content in AML12; B: Cholesterol content in AML12; C and D: Expression levels of brown adipose tissue and white adipose tissue related genes in 3T3-L1 cells. FGF21: Fibroblast growth factor 21; AD-GFP: Recombinant adenoviruses encoding green fluorescent protein; AD-SA/AD-S100A11: Recombinant adenoviruses encoding S100A11; UCP1: Uncoupling protein 1; PGC1α: Peroxisome proliferator-activated receptor gamma coactivator 1-α; PRDM16: PR domain containing 16.
- Citation: Zhang QQ, Lu XQ, Shang BZ, Liu LC, Lu ET, Li HY, Xia MM, Jin YX, Zhang WZ, Zhang Y, Han JY, Li Y. Calcium-dependent signaling protein family member S100A11 promotes liver and adipose lipid accumulation through fibroblast growth factor 21. World J Gastroenterol 2026; 32(25): 118597
- URL: https://www.wjgnet.com/1007-9327/full/v32/i25/118597.htm
- DOI: https://dx.doi.org/10.3748/wjg.118597