
















Copyright: ©Author(s) 2026.
World J Gastroenterol. Jun 7, 2026; 32(21): 115964
Published online Jun 7, 2026. doi: 10.3748/wjg.v32.i21.115964
Published online Jun 7, 2026. doi: 10.3748/wjg.v32.i21.115964
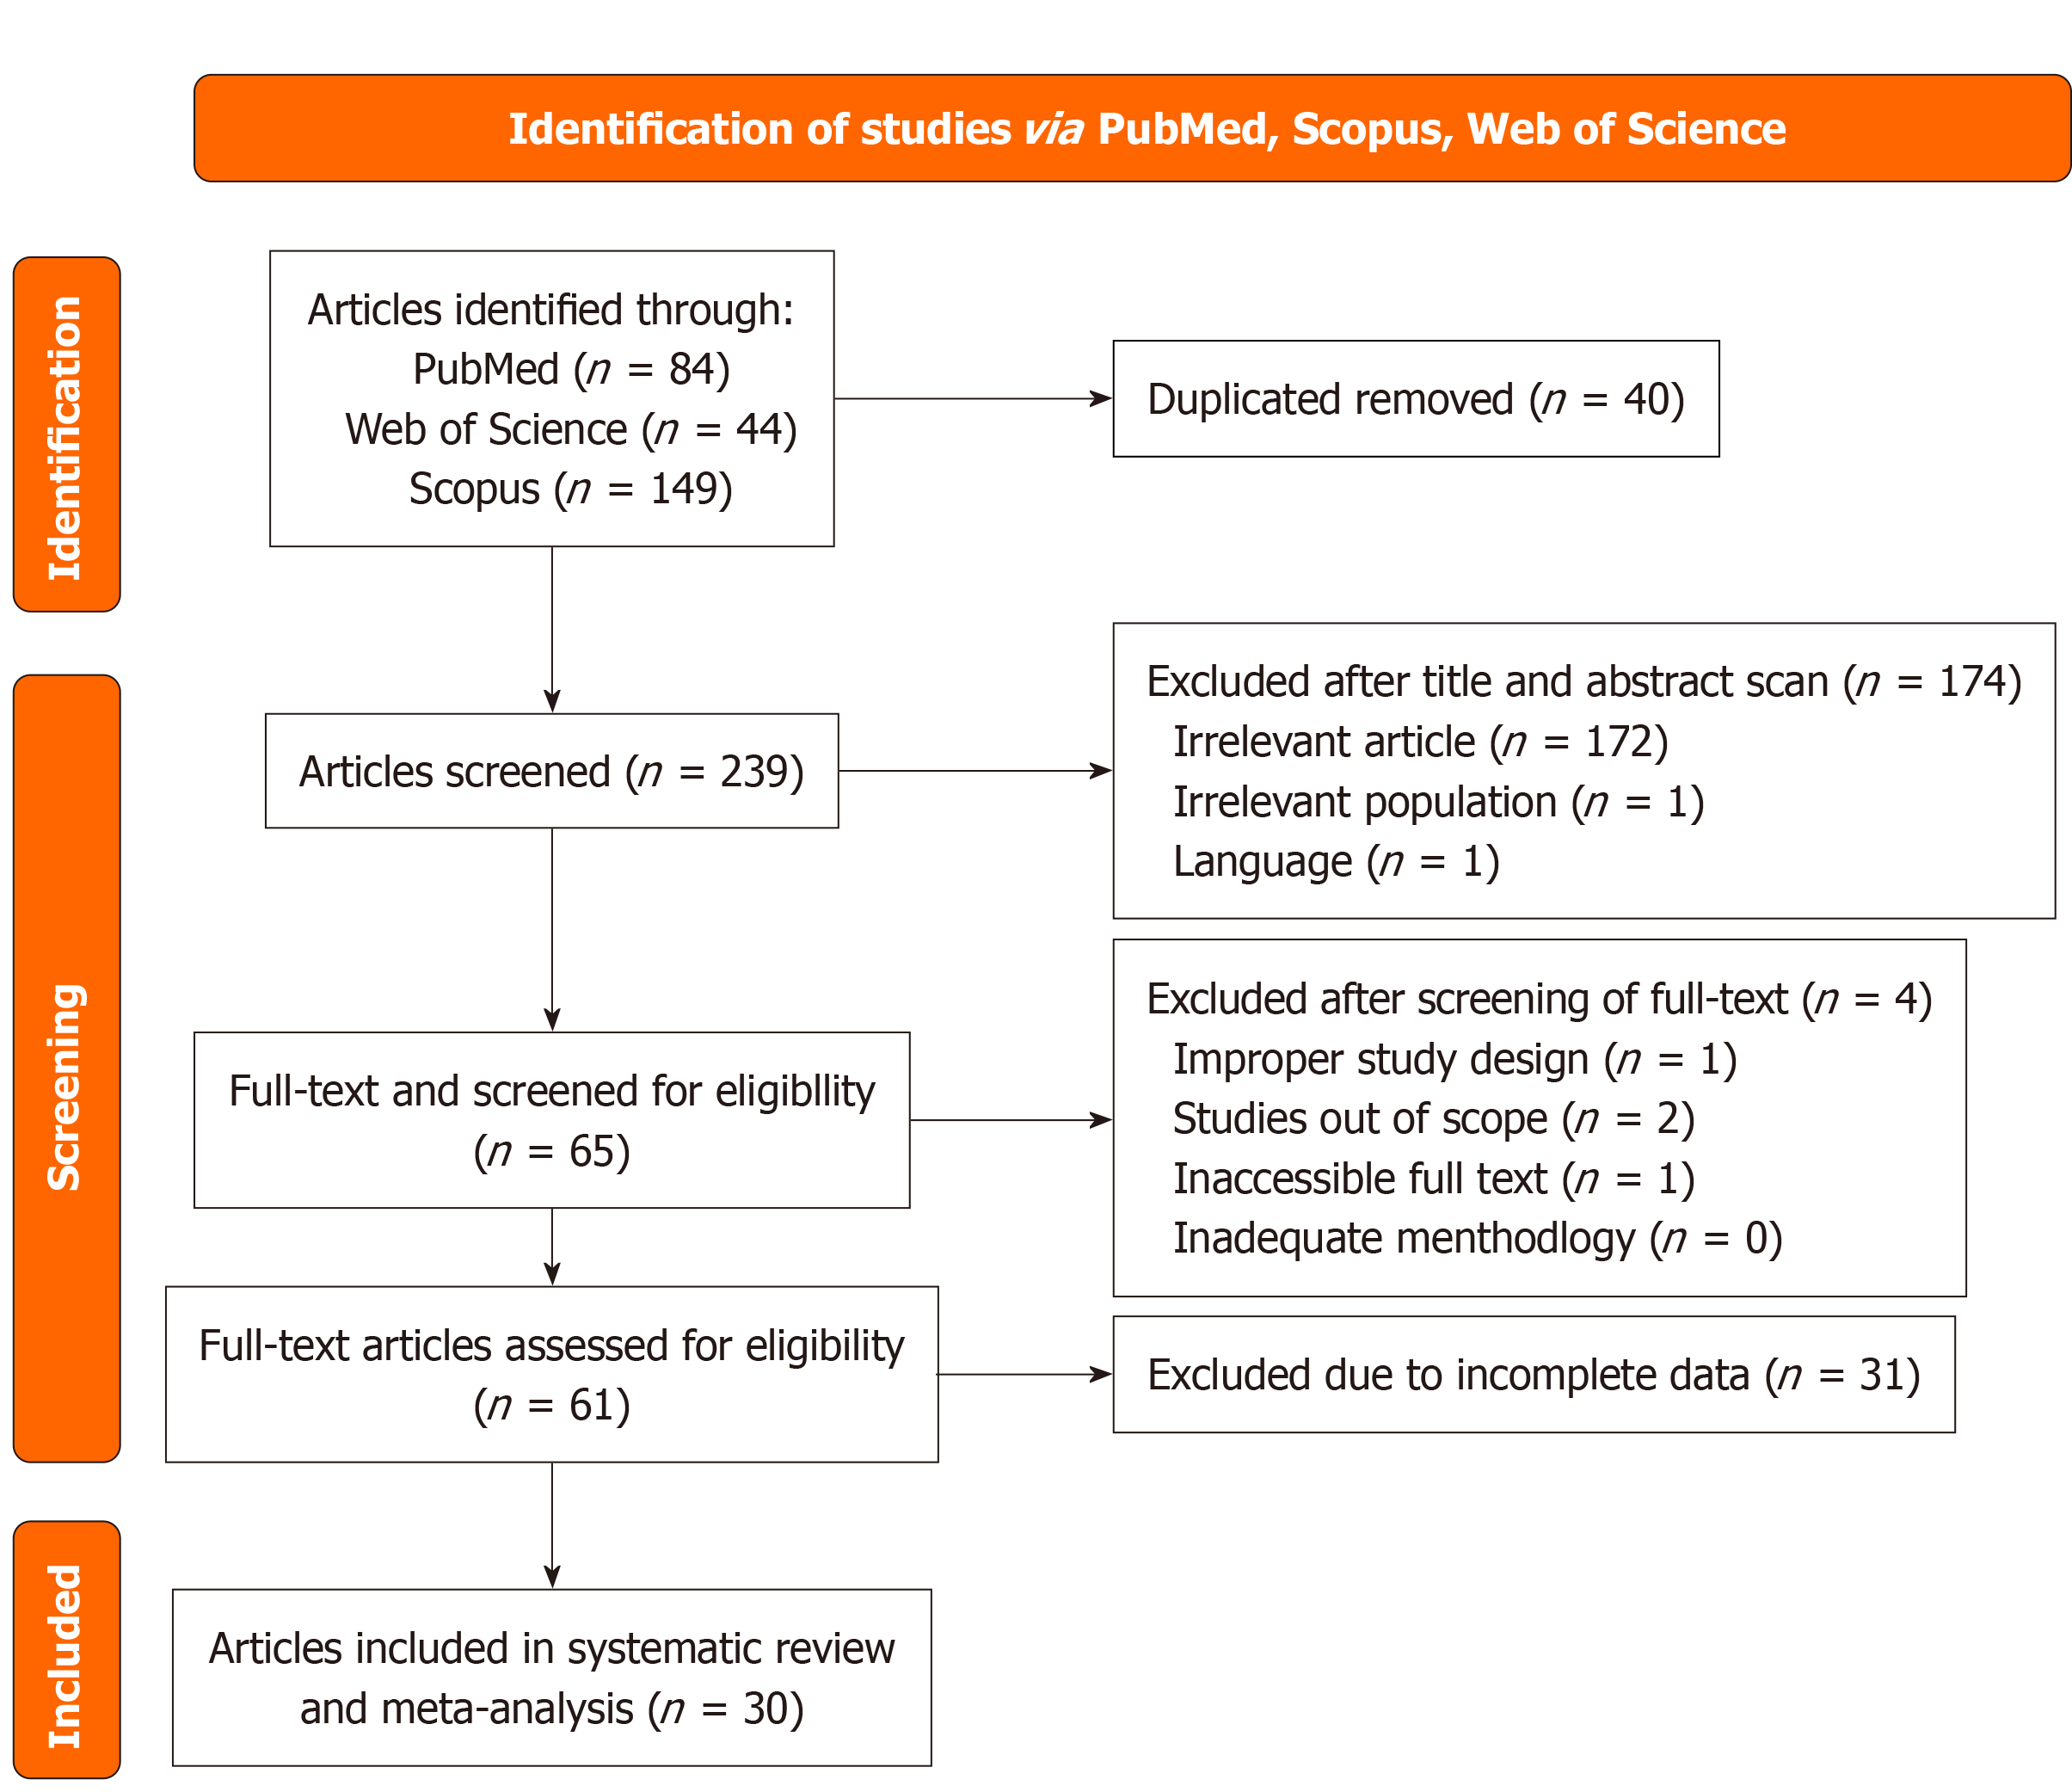
Figure 1 The steps of the literature search and selection.
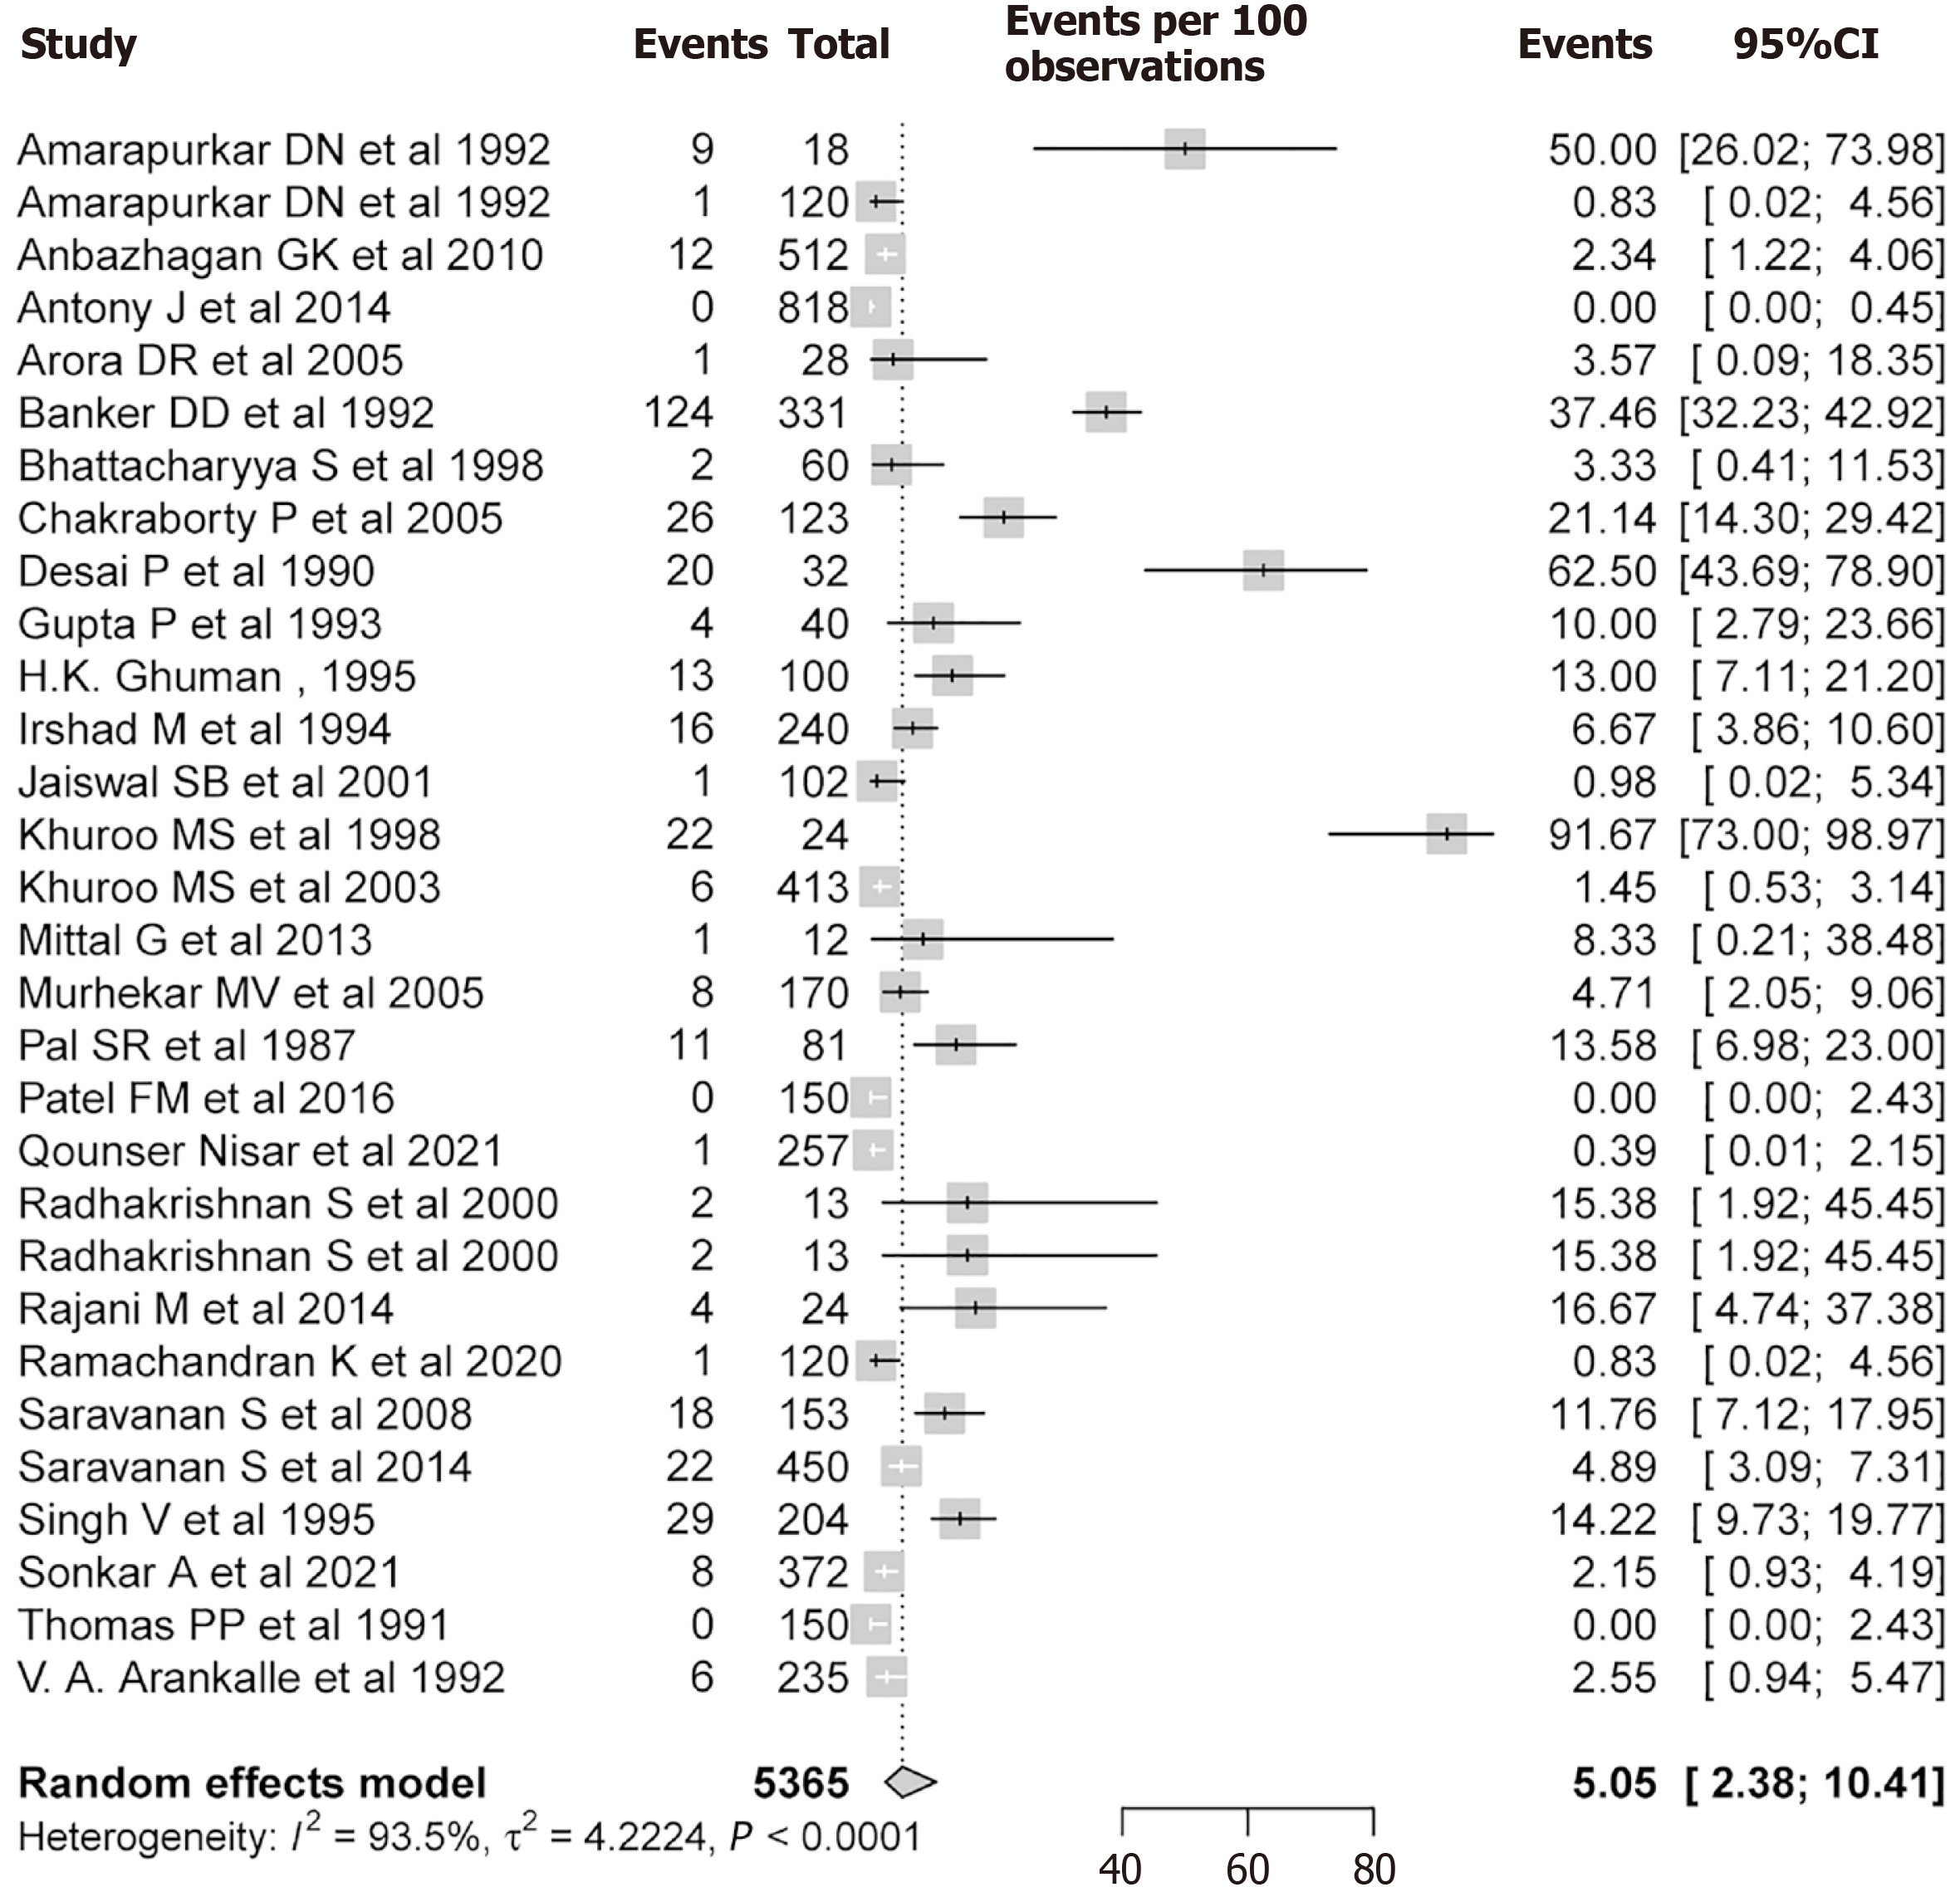
Figure 2 Forest plot.
Forest plot of prevalence estimates (pooled: 5.05%, 95% confidence interval: 2.37-10.41; random-effects model) showing substantial heterogeneity (I2 = 93.5%, τ2 = 4.2224, P < 0.0001) across 30 regional studies. CI: Confidence interval.
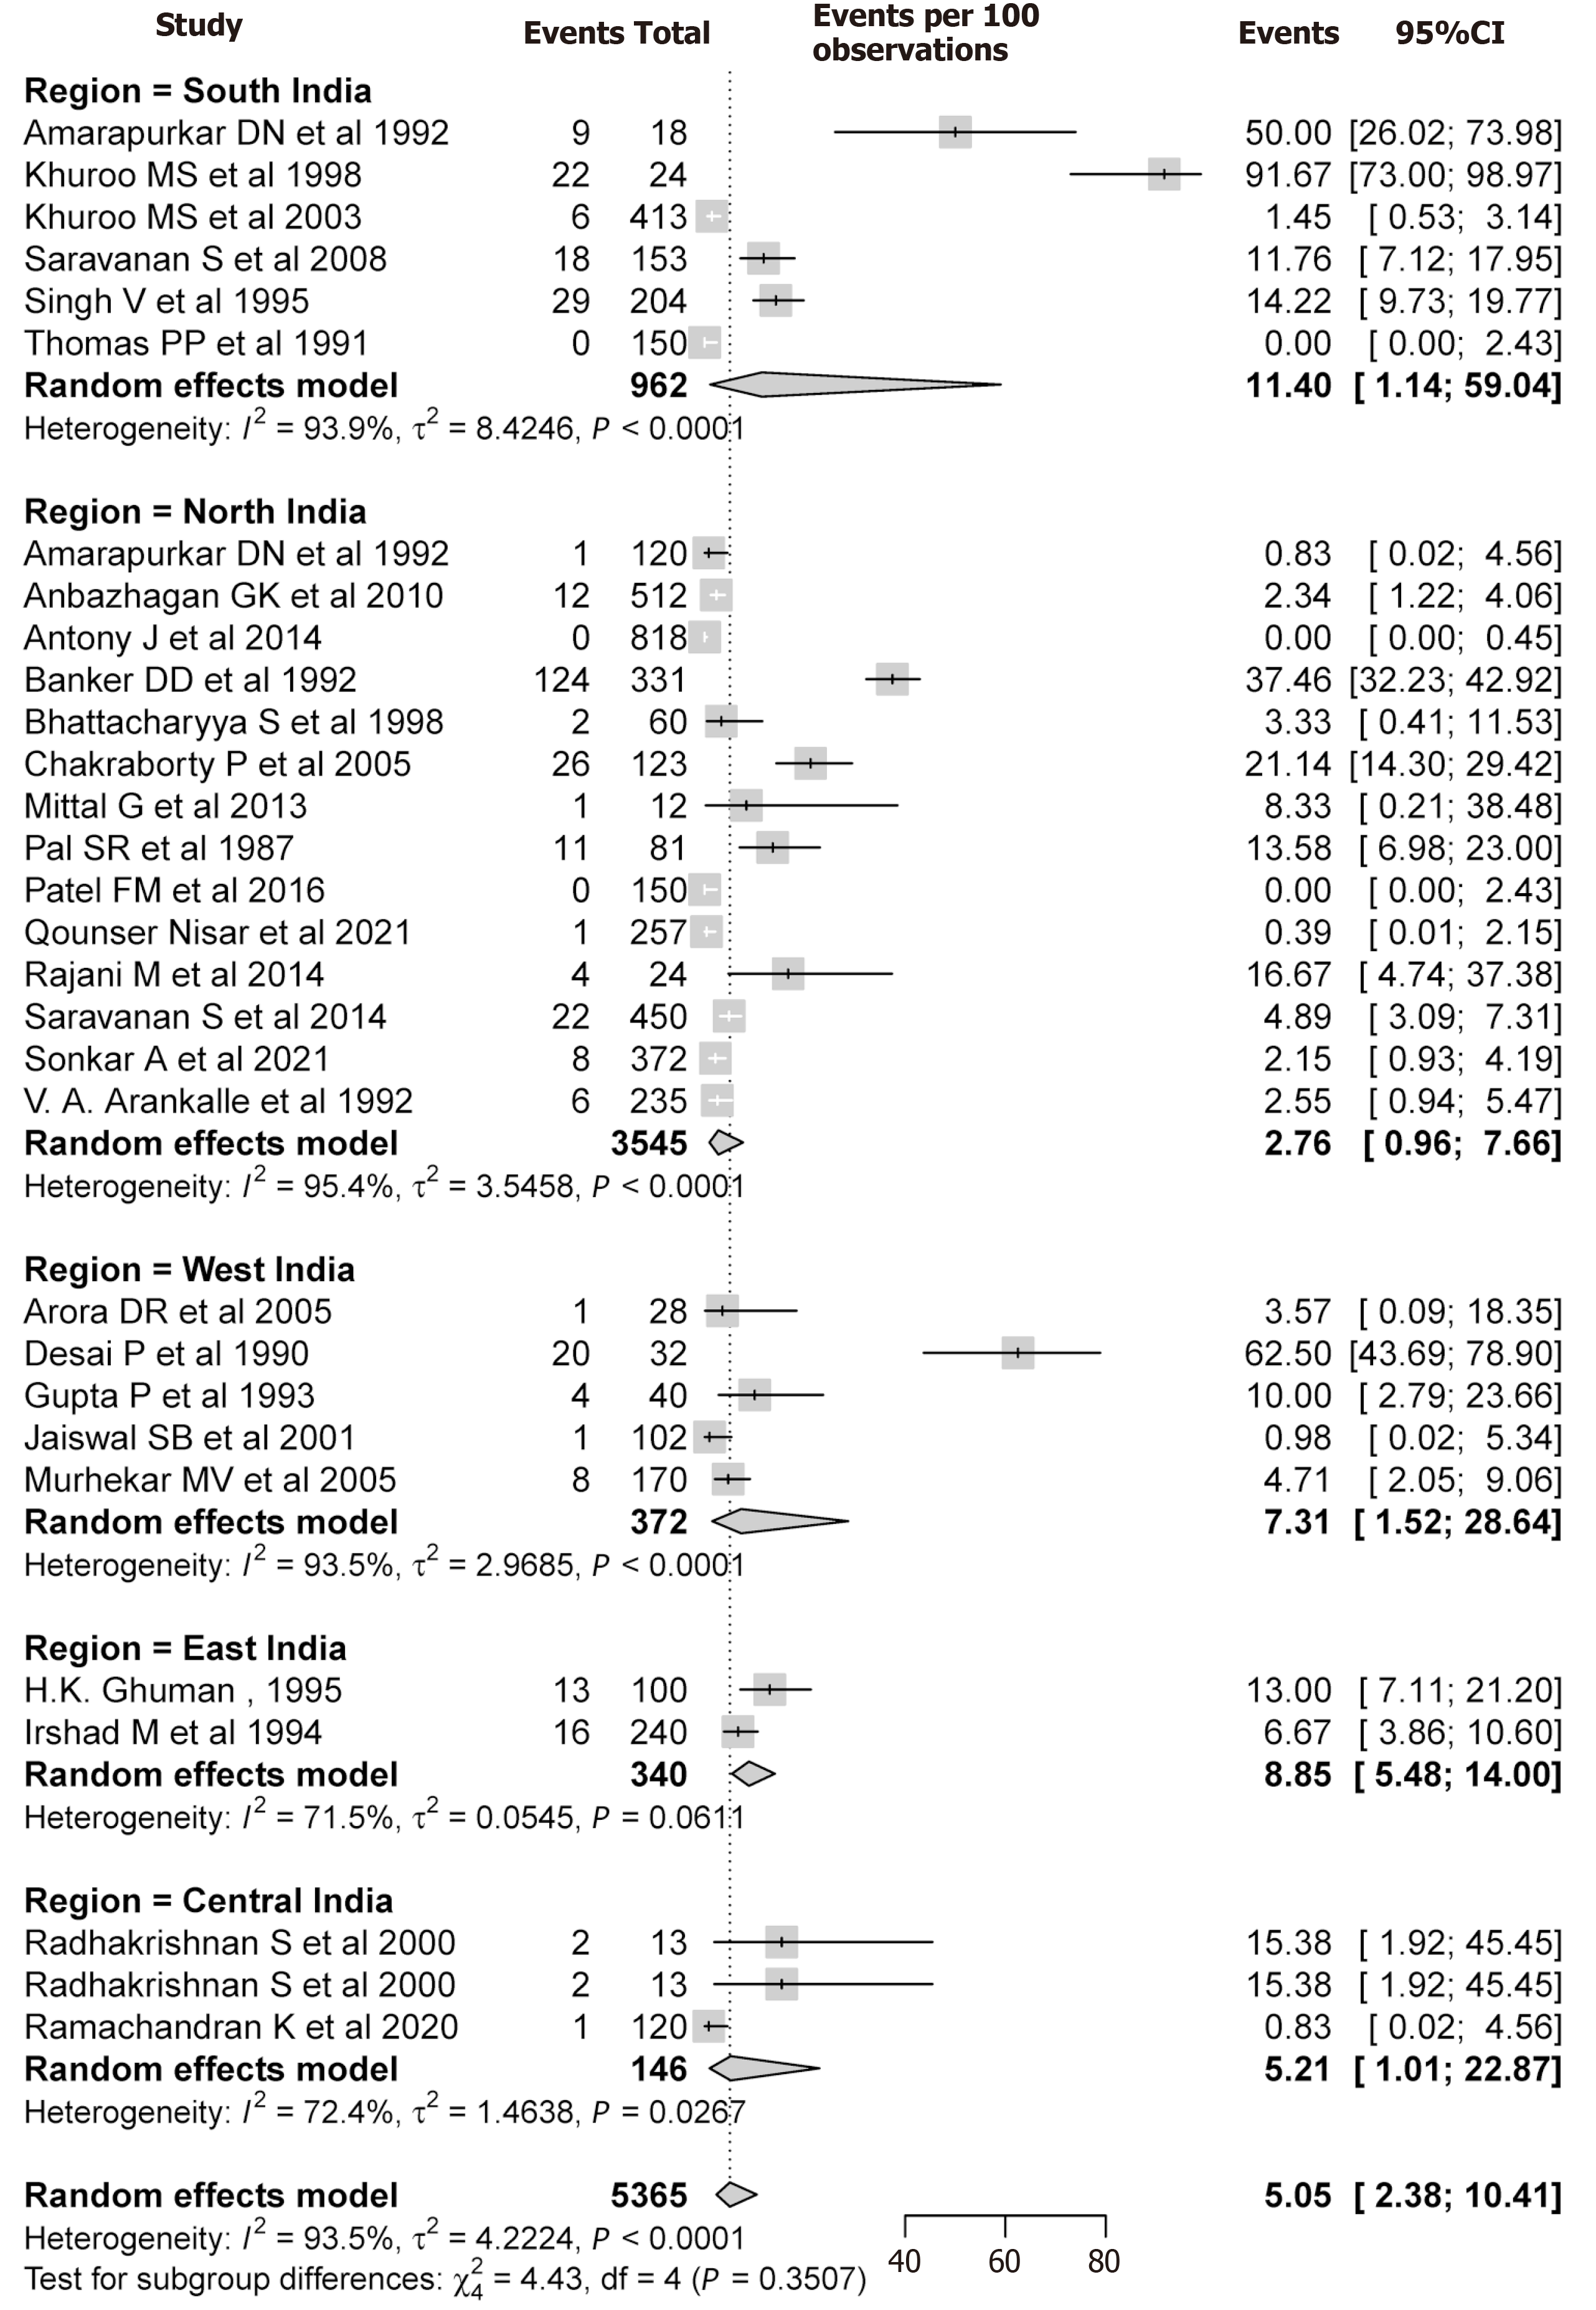
Figure 3 Regional prevalence of hepatitis D virus in India.
CI: Confidence interval.
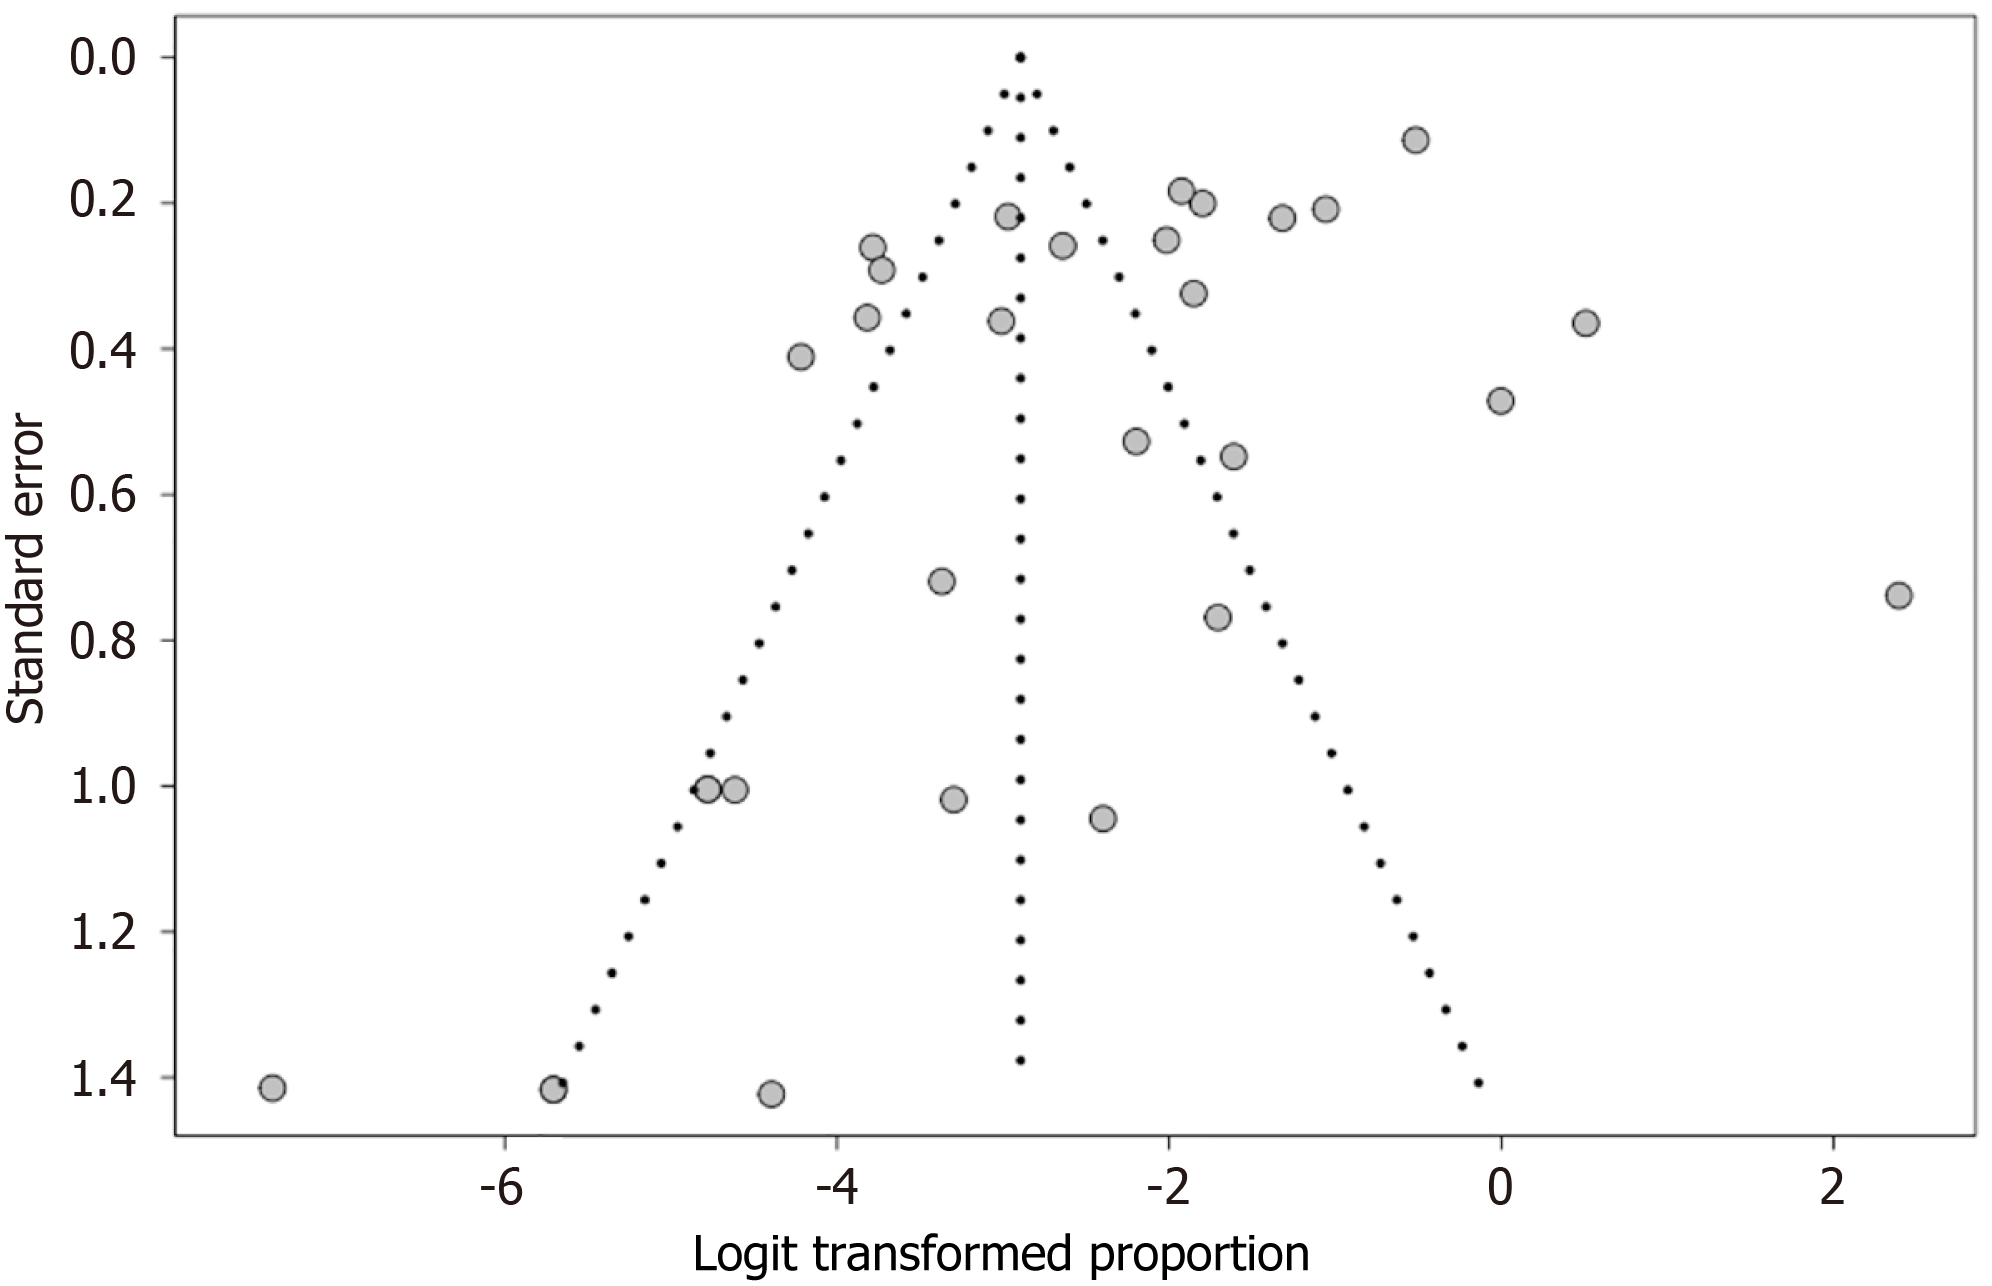
Figure 4 Funnel plot of logit-transformed proportions vs standard errors.
Begg’s P = 0.57; Egger’s P = 0.006, showing moderate symmetry with potential small-study effects at higher standard errors.
- Citation: Mishra N, Gupta A, Singh AK, Nagar J, Vyas AK, Yadav V, Ravindran GC, Pandey MK, Corovic IF, Mandal U, Tiwari RR, Mishra PK, Rawat SK, Nema RK. Prevalence of hepatitis-D virus in hepatitis B surface antigen-positive patients of India: A meta-analysis (research on behalf of ESGVH). World J Gastroenterol 2026; 32(21): 115964
- URL: https://www.wjgnet.com/1007-9327/full/v32/i21/115964.htm
- DOI: https://dx.doi.org/10.3748/wjg.v32.i21.115964