©The Author(s) 2025.
World J Gastroenterol. Feb 21, 2025; 31(7): 100051
Published online Feb 21, 2025. doi: 10.3748/wjg.v31.i7.100051
Published online Feb 21, 2025. doi: 10.3748/wjg.v31.i7.100051
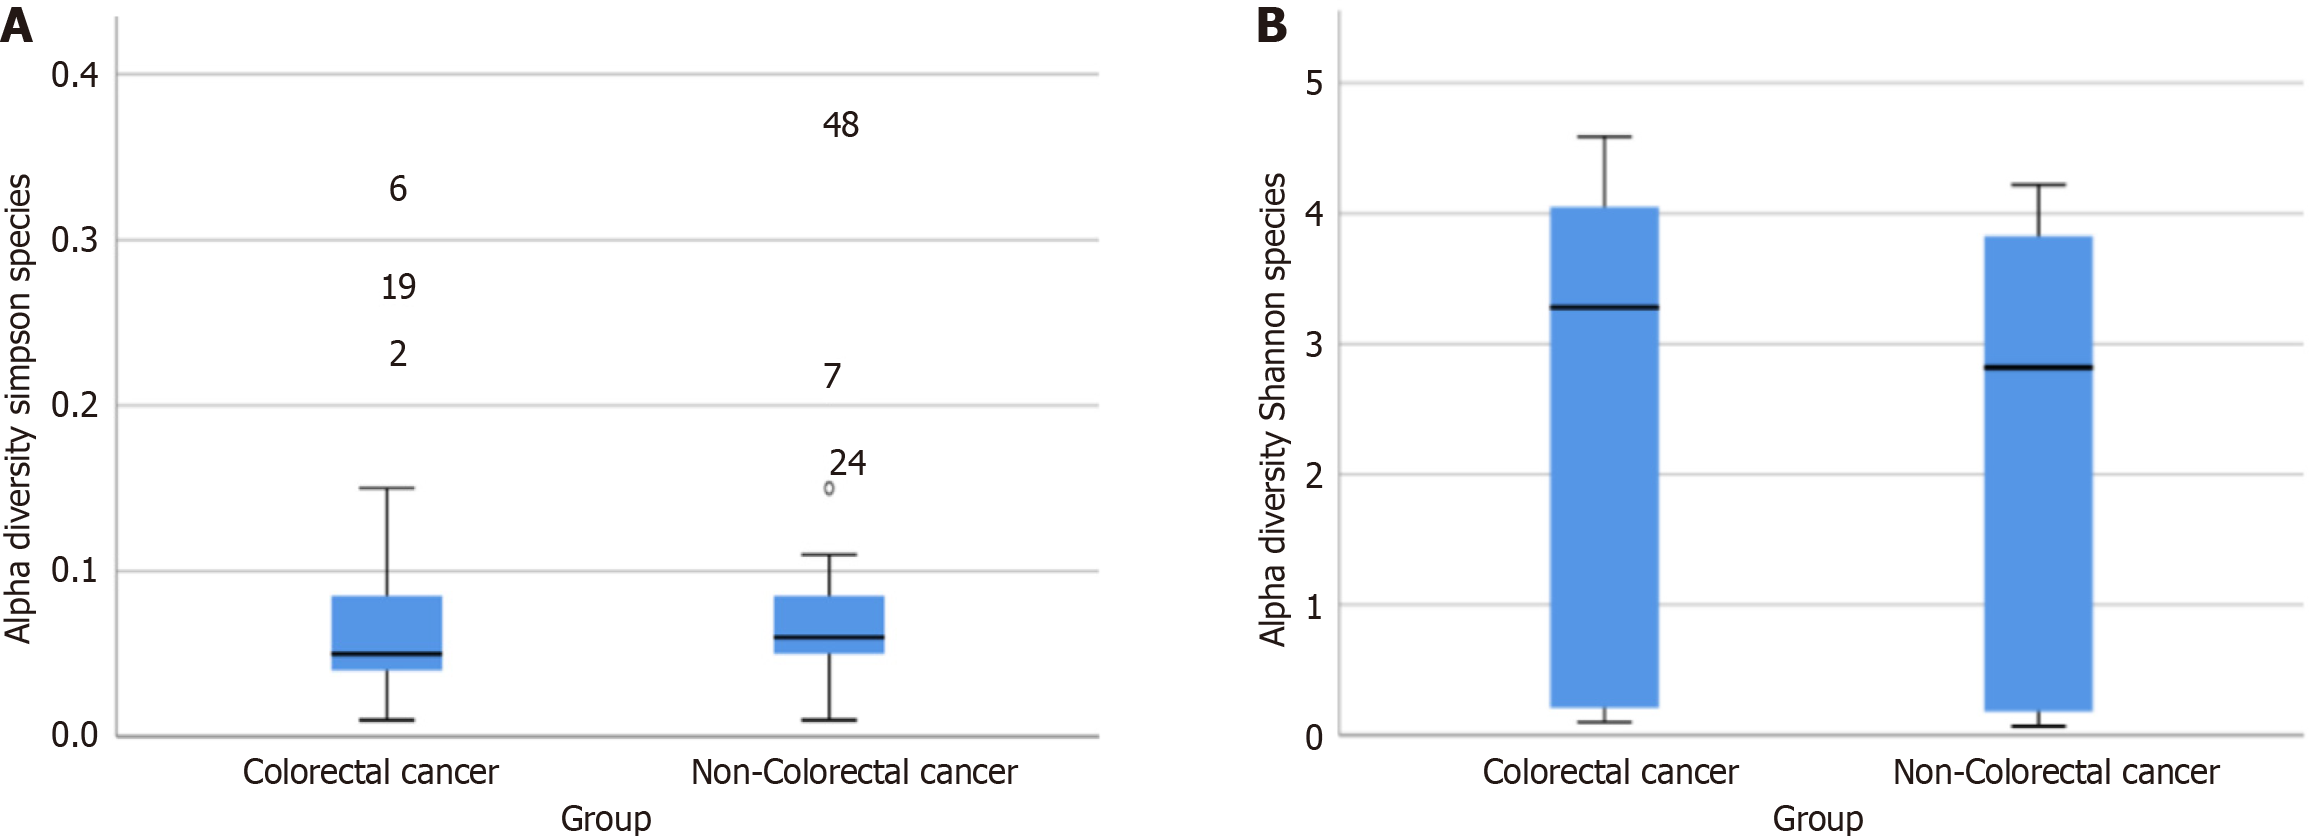
Figure 1 Boxplot.
A: Simpson Diversity Index; B: Shannon Diversity Index.
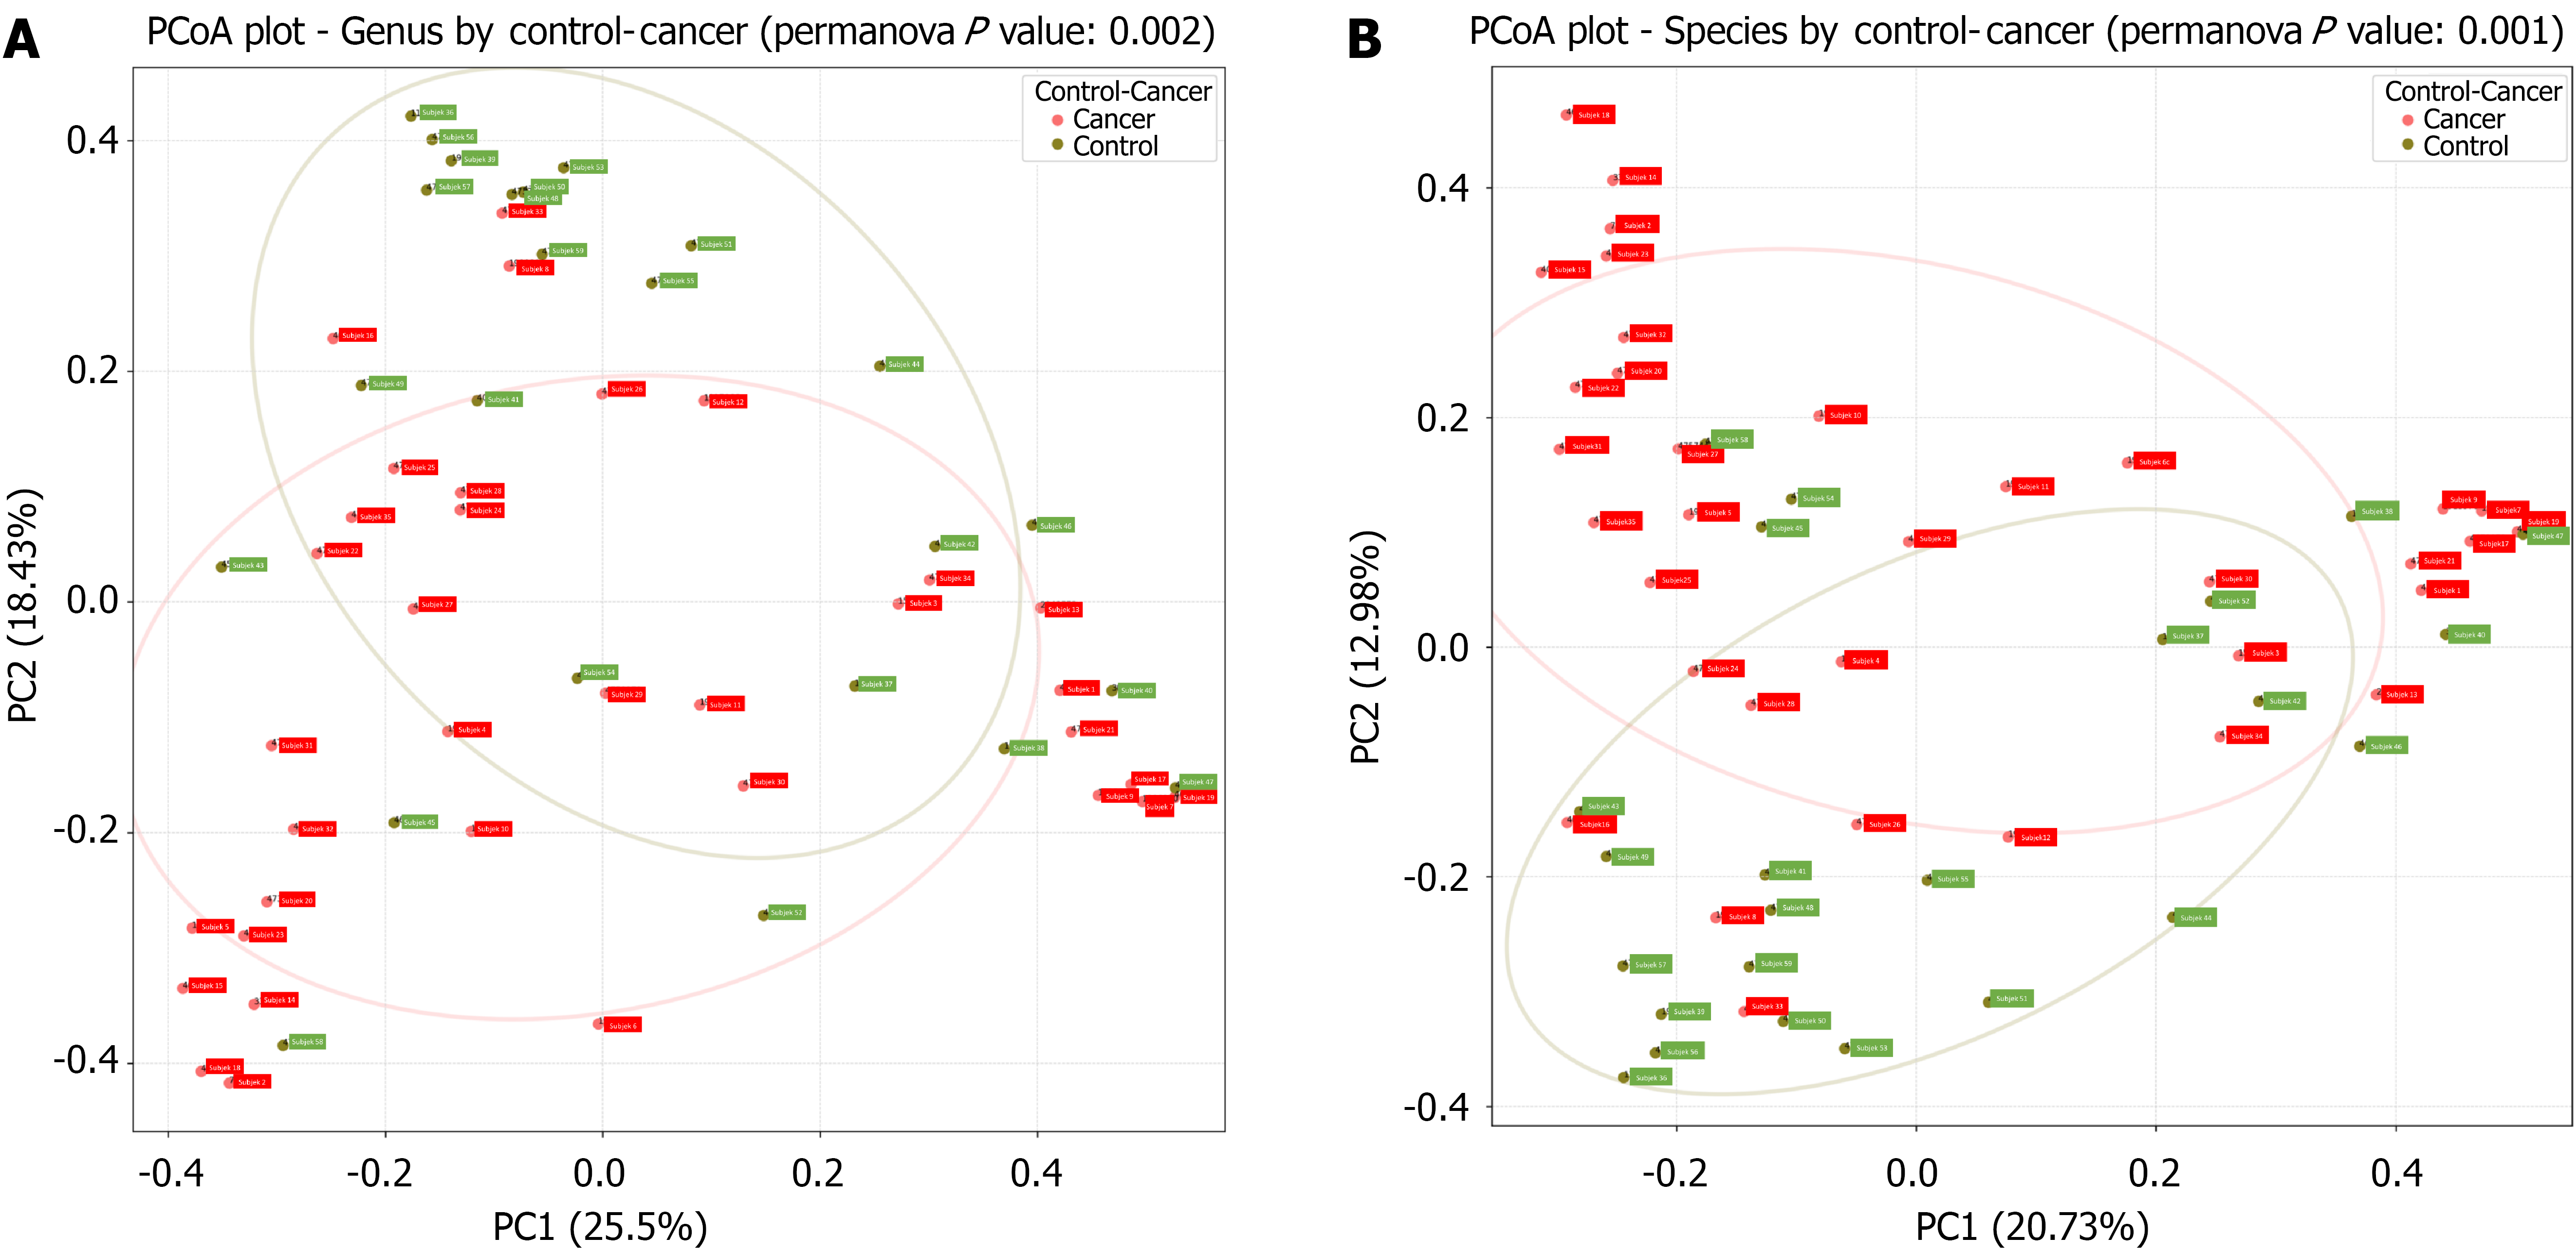
Figure 2 Analysis of beta diversity.
Beta diversity at the A: genus level; and B: species level.
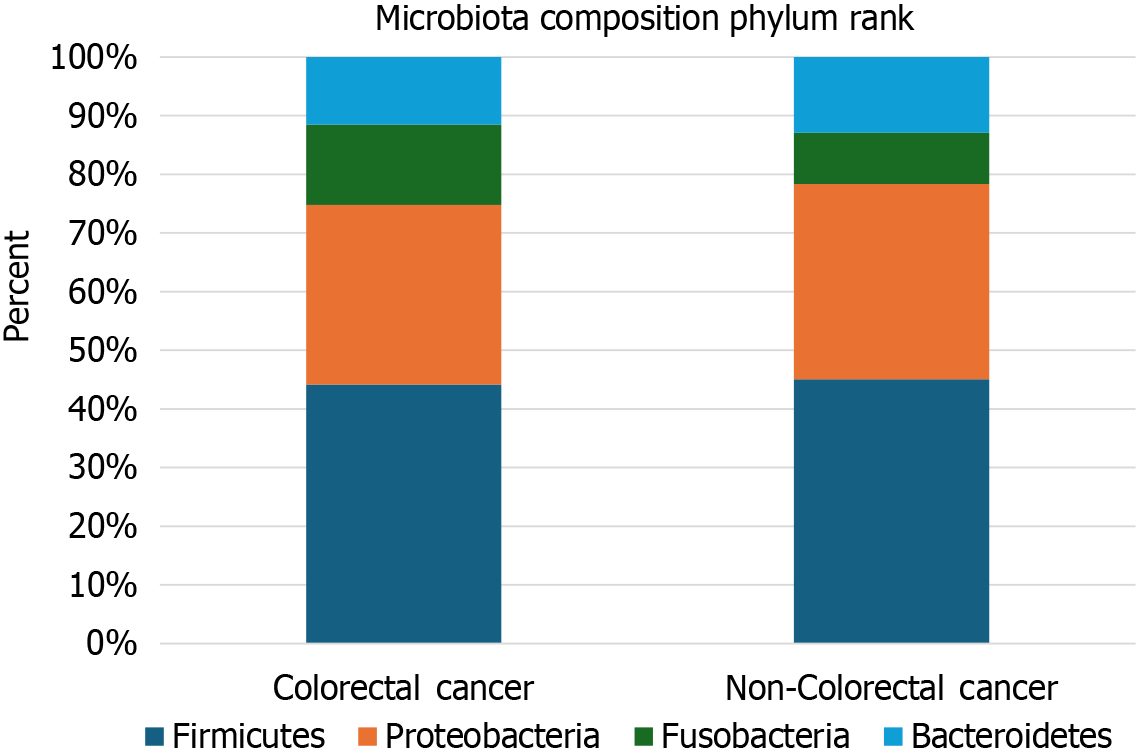
Figure 3 Difference in microbiota composition based on phylum rank.
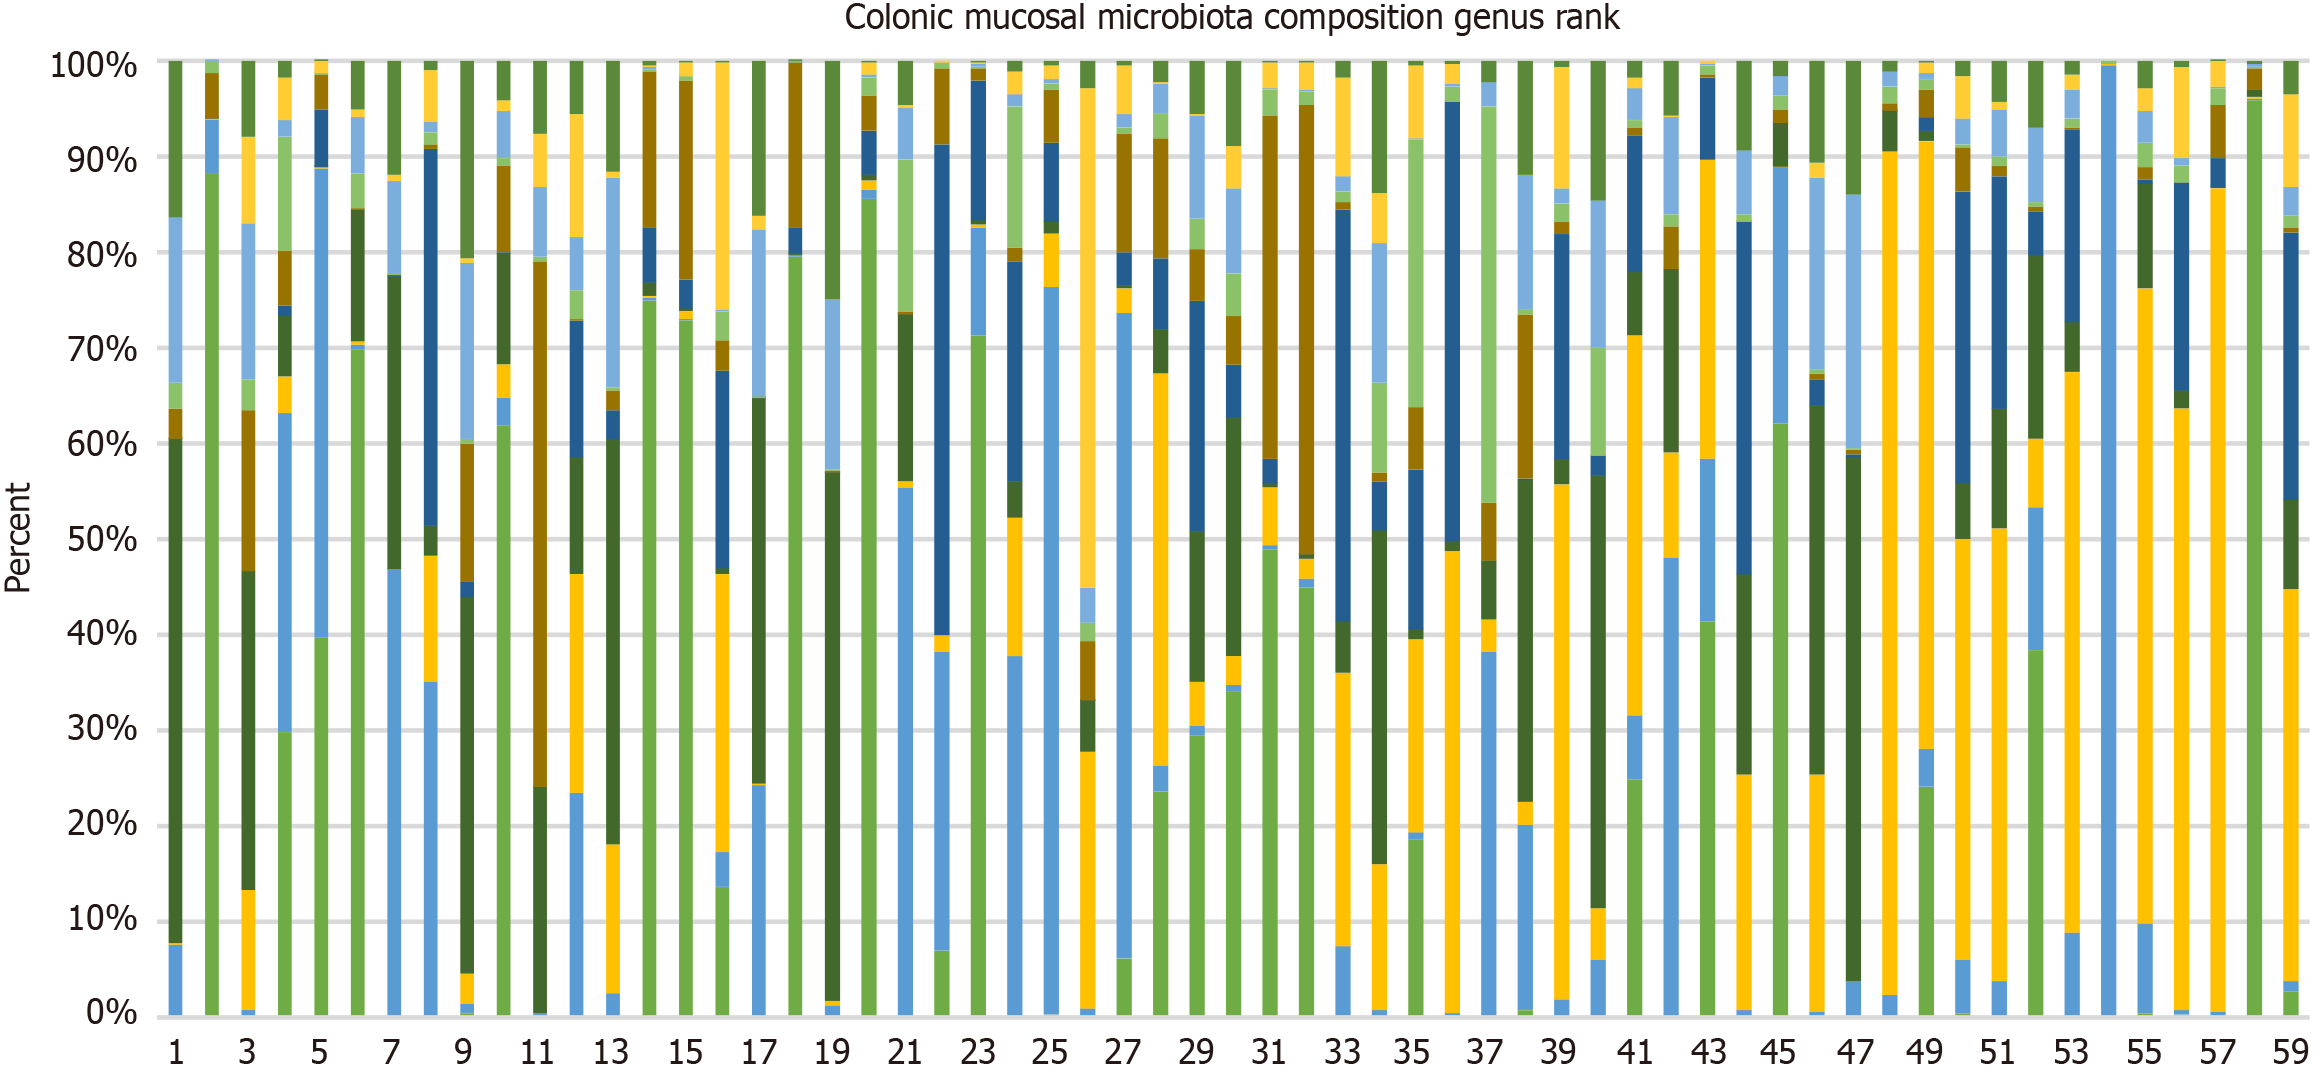
Figure 4 Difference in the composition of the 10 most common microbiota based on genus.
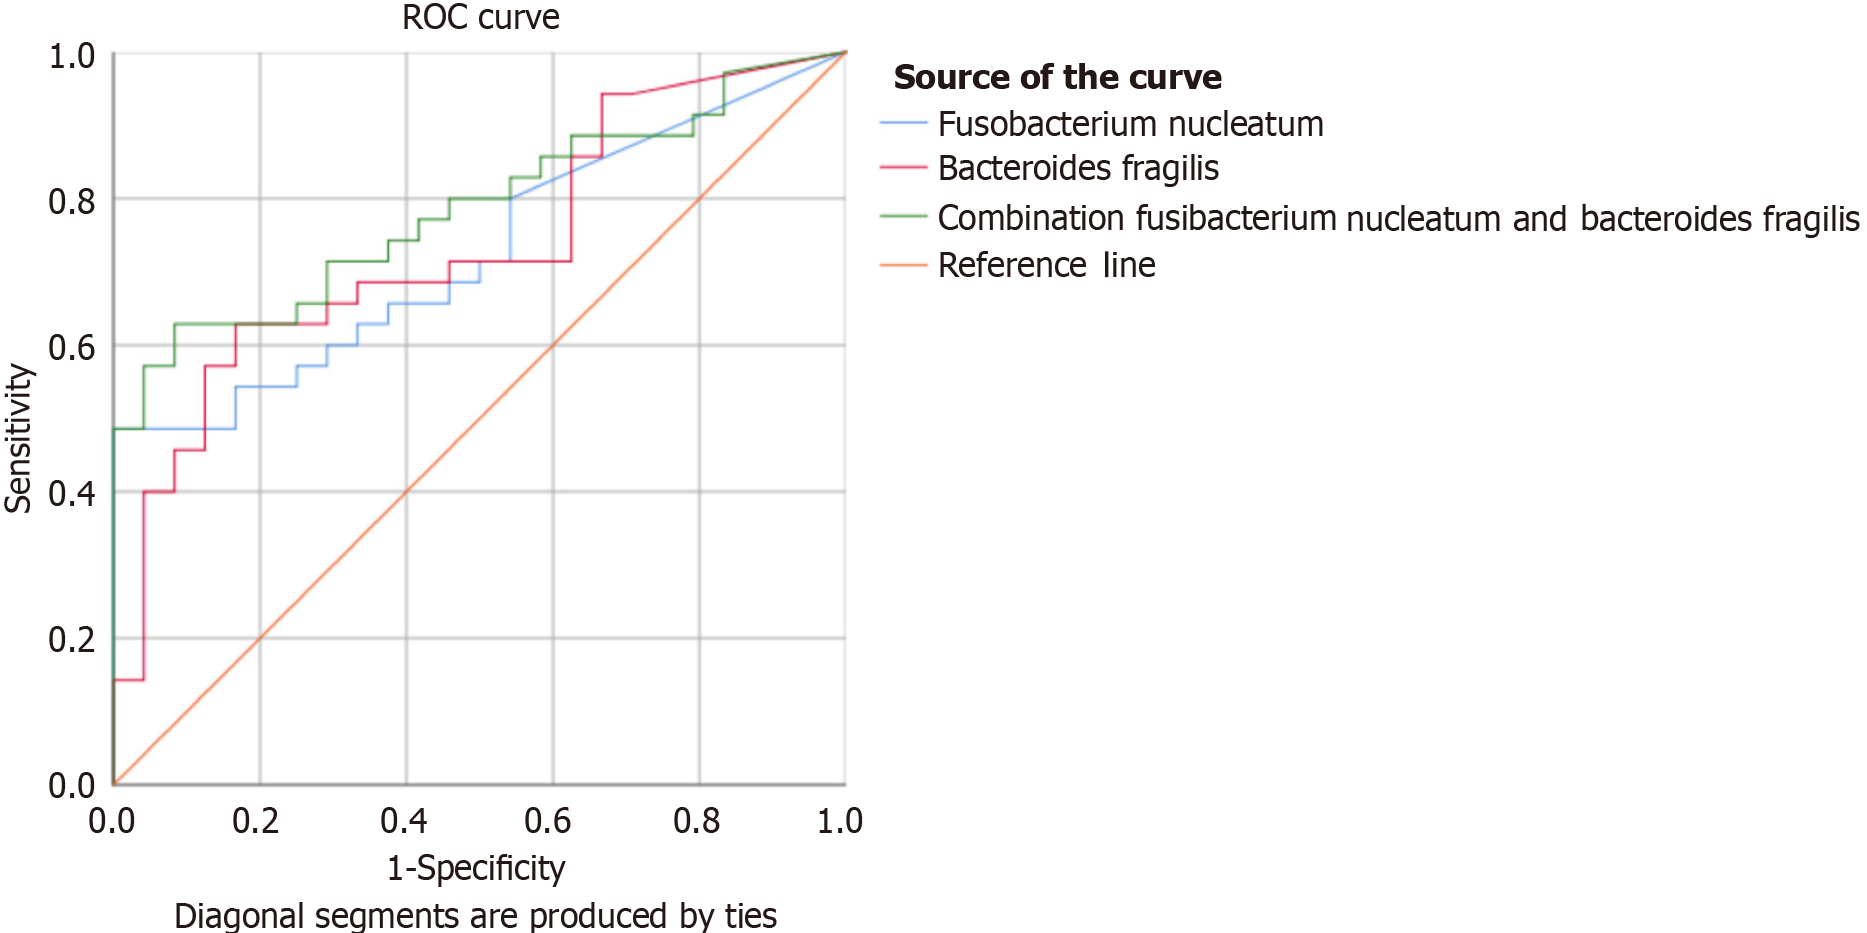
Figure 5 Comparison of area under the curve for Fusobacterium nucleatum, Bacteroides fragilis, and their combination.
ROC: Receiver operating characteristic.
- Citation: Darnindro N, Abdullah M, Sukartini N, Rumende CM, Pitarini A, Nursyirwan SA, Fauzi A, Makmun D, Nelwan EJ, Shatri H, Rinaldi I, Tanadi C. Differences in diversity and composition of mucosa-associated colonic microbiota in colorectal cancer and non-colorectal cancer in Indonesia. World J Gastroenterol 2025; 31(7): 100051
- URL: https://www.wjgnet.com/1007-9327/full/v31/i7/100051.htm
- DOI: https://dx.doi.org/10.3748/wjg.v31.i7.100051


