Copyright
©The Author(s) 2025.
World J Gastroenterol. Feb 7, 2025; 31(5): 98928
Published online Feb 7, 2025. doi: 10.3748/wjg.v31.i5.98928
Published online Feb 7, 2025. doi: 10.3748/wjg.v31.i5.98928
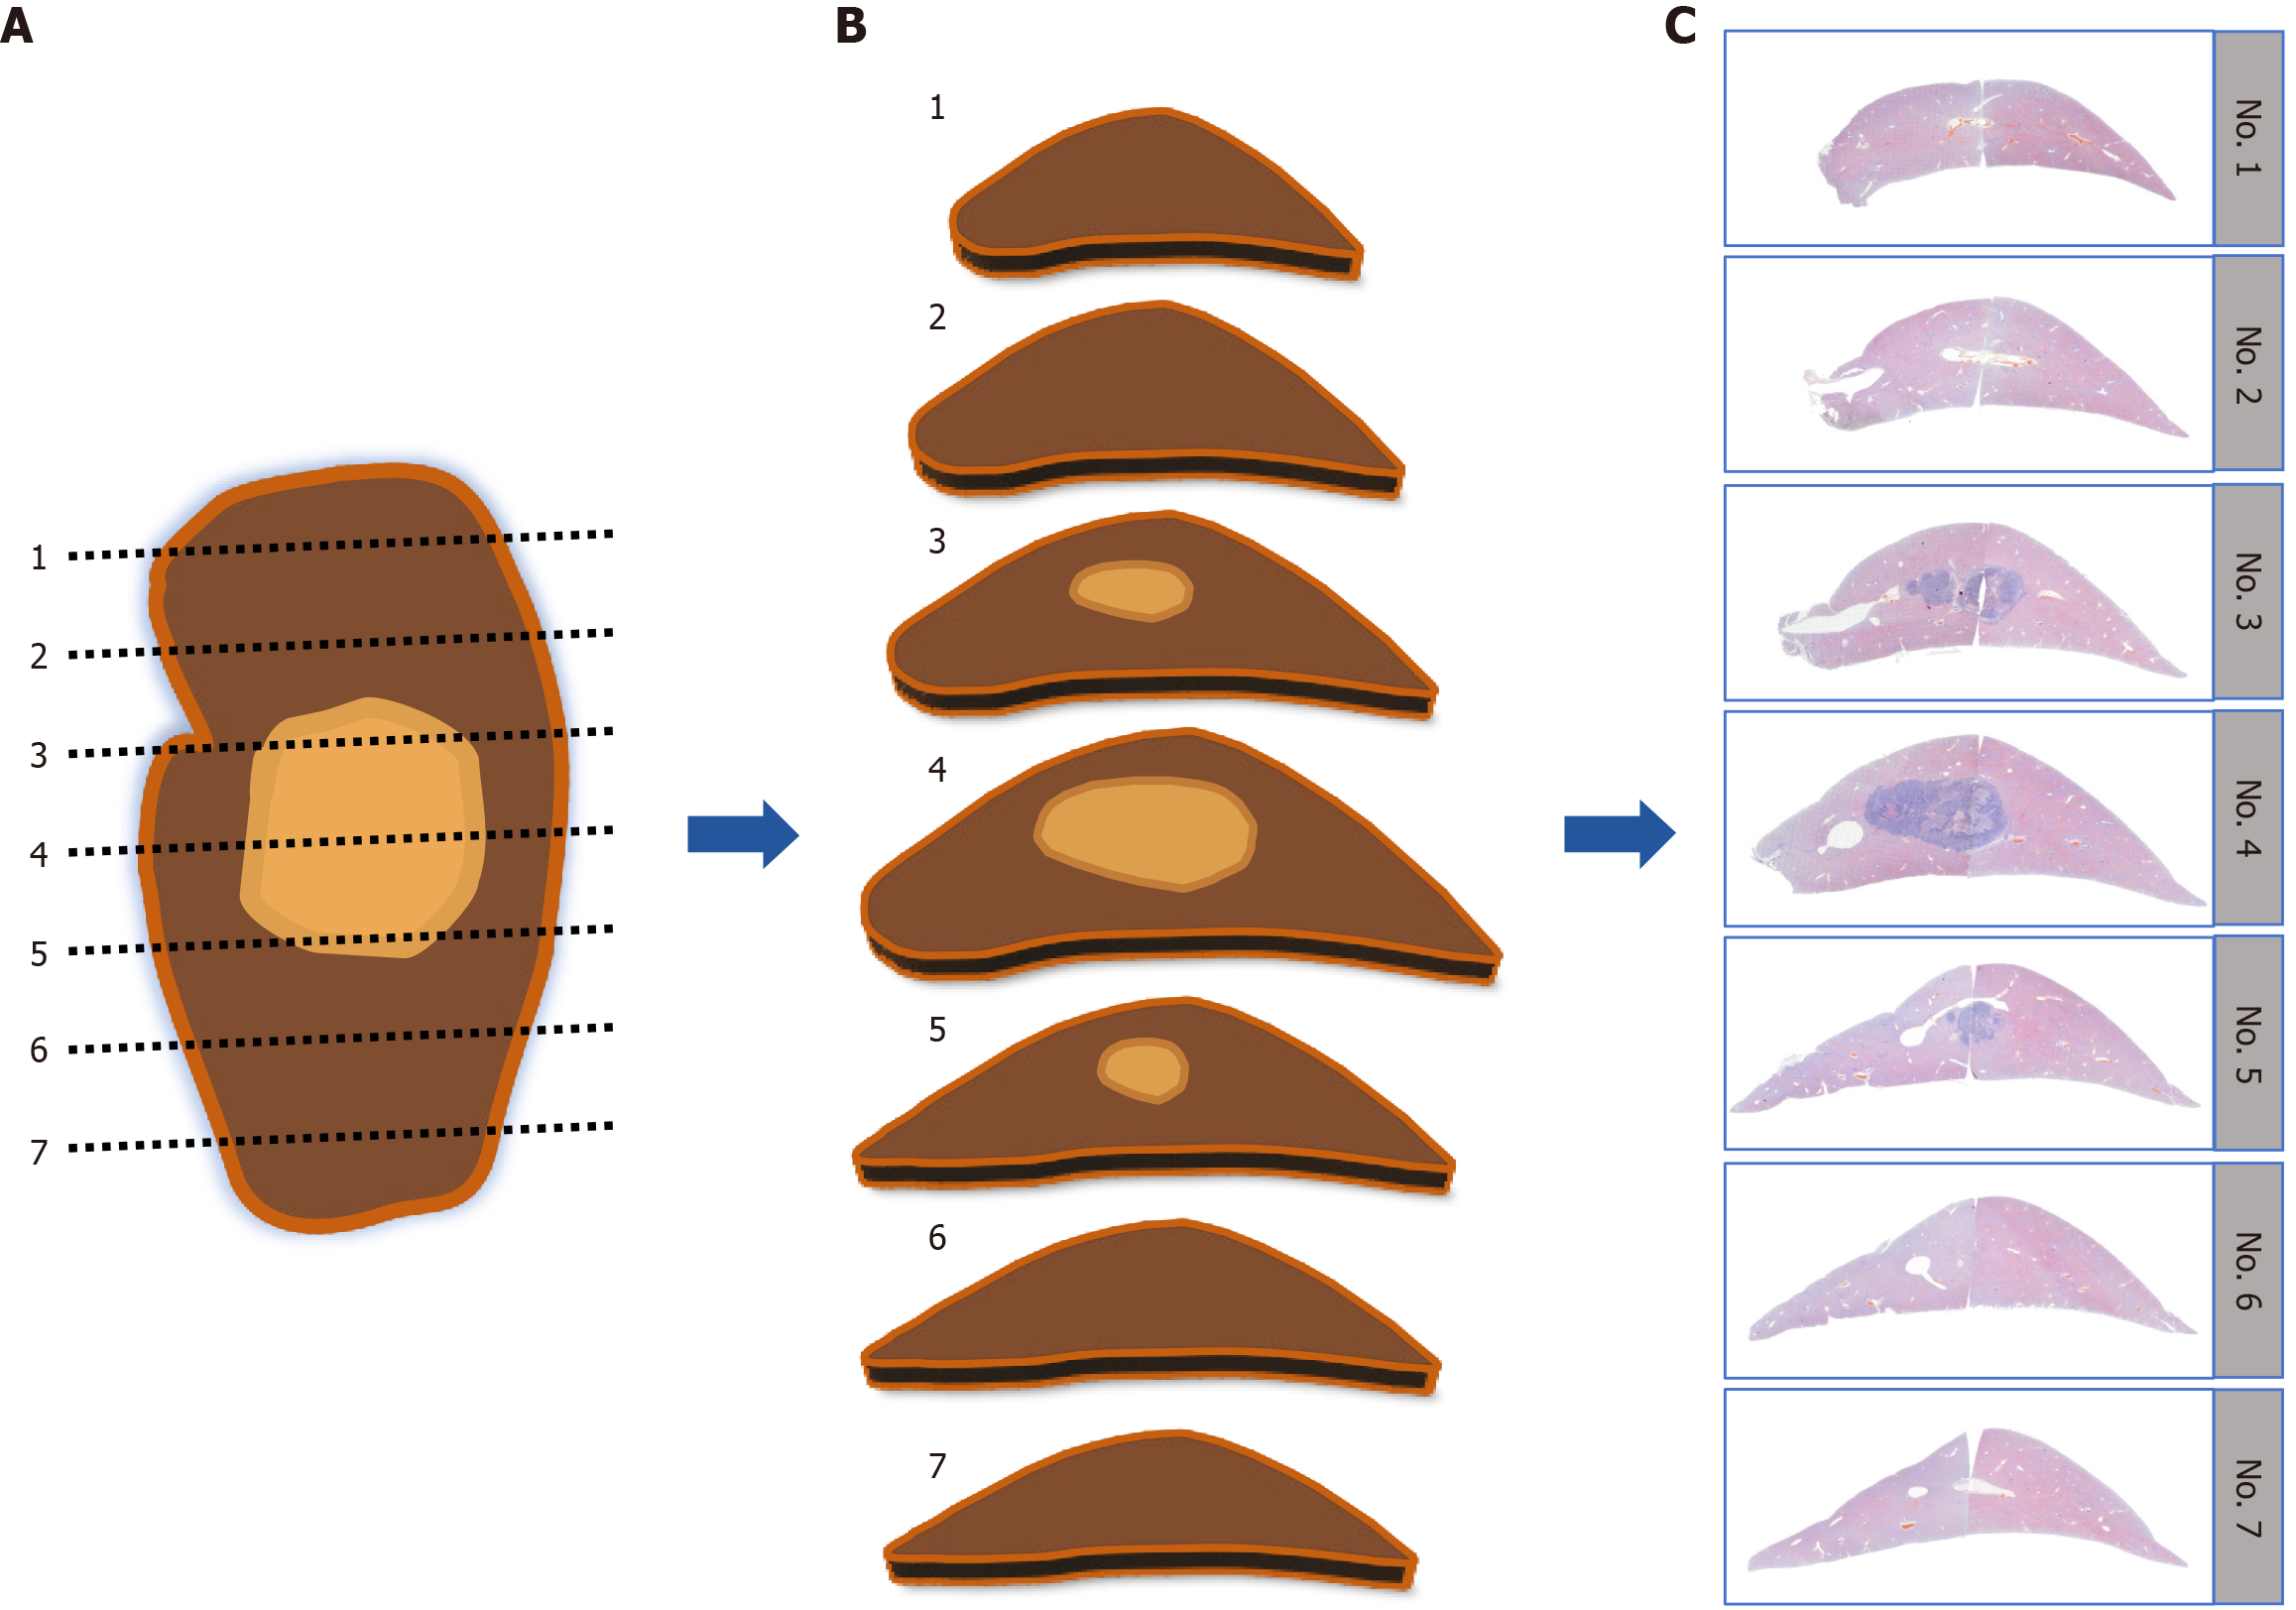
Figure 1 Schematic flowchart illustrating the process of producing whole-mount slide images.
A: The entire liver lobe containing the tumor was sectioned in parallel at a uniform thickness of 3 mm along the maximal tumor section; B: Tissue blocks were consecutively numbered and oriented in the same direction for embedding; C: The first complete whole-mount slide images stained with hematoxylin and eosin was prepared for each tissue block. Whole-mount slide images labeled as number 4 correspond to the maximal tumor section, whereas whole-mount slide images labeled as numbers 3-5 correspond to sections containing the tumor at 3 mm intervals. Whole-mount slide images labeled as numbers 1-7 correspond to sections of the entire liver at 3 mm intervals.
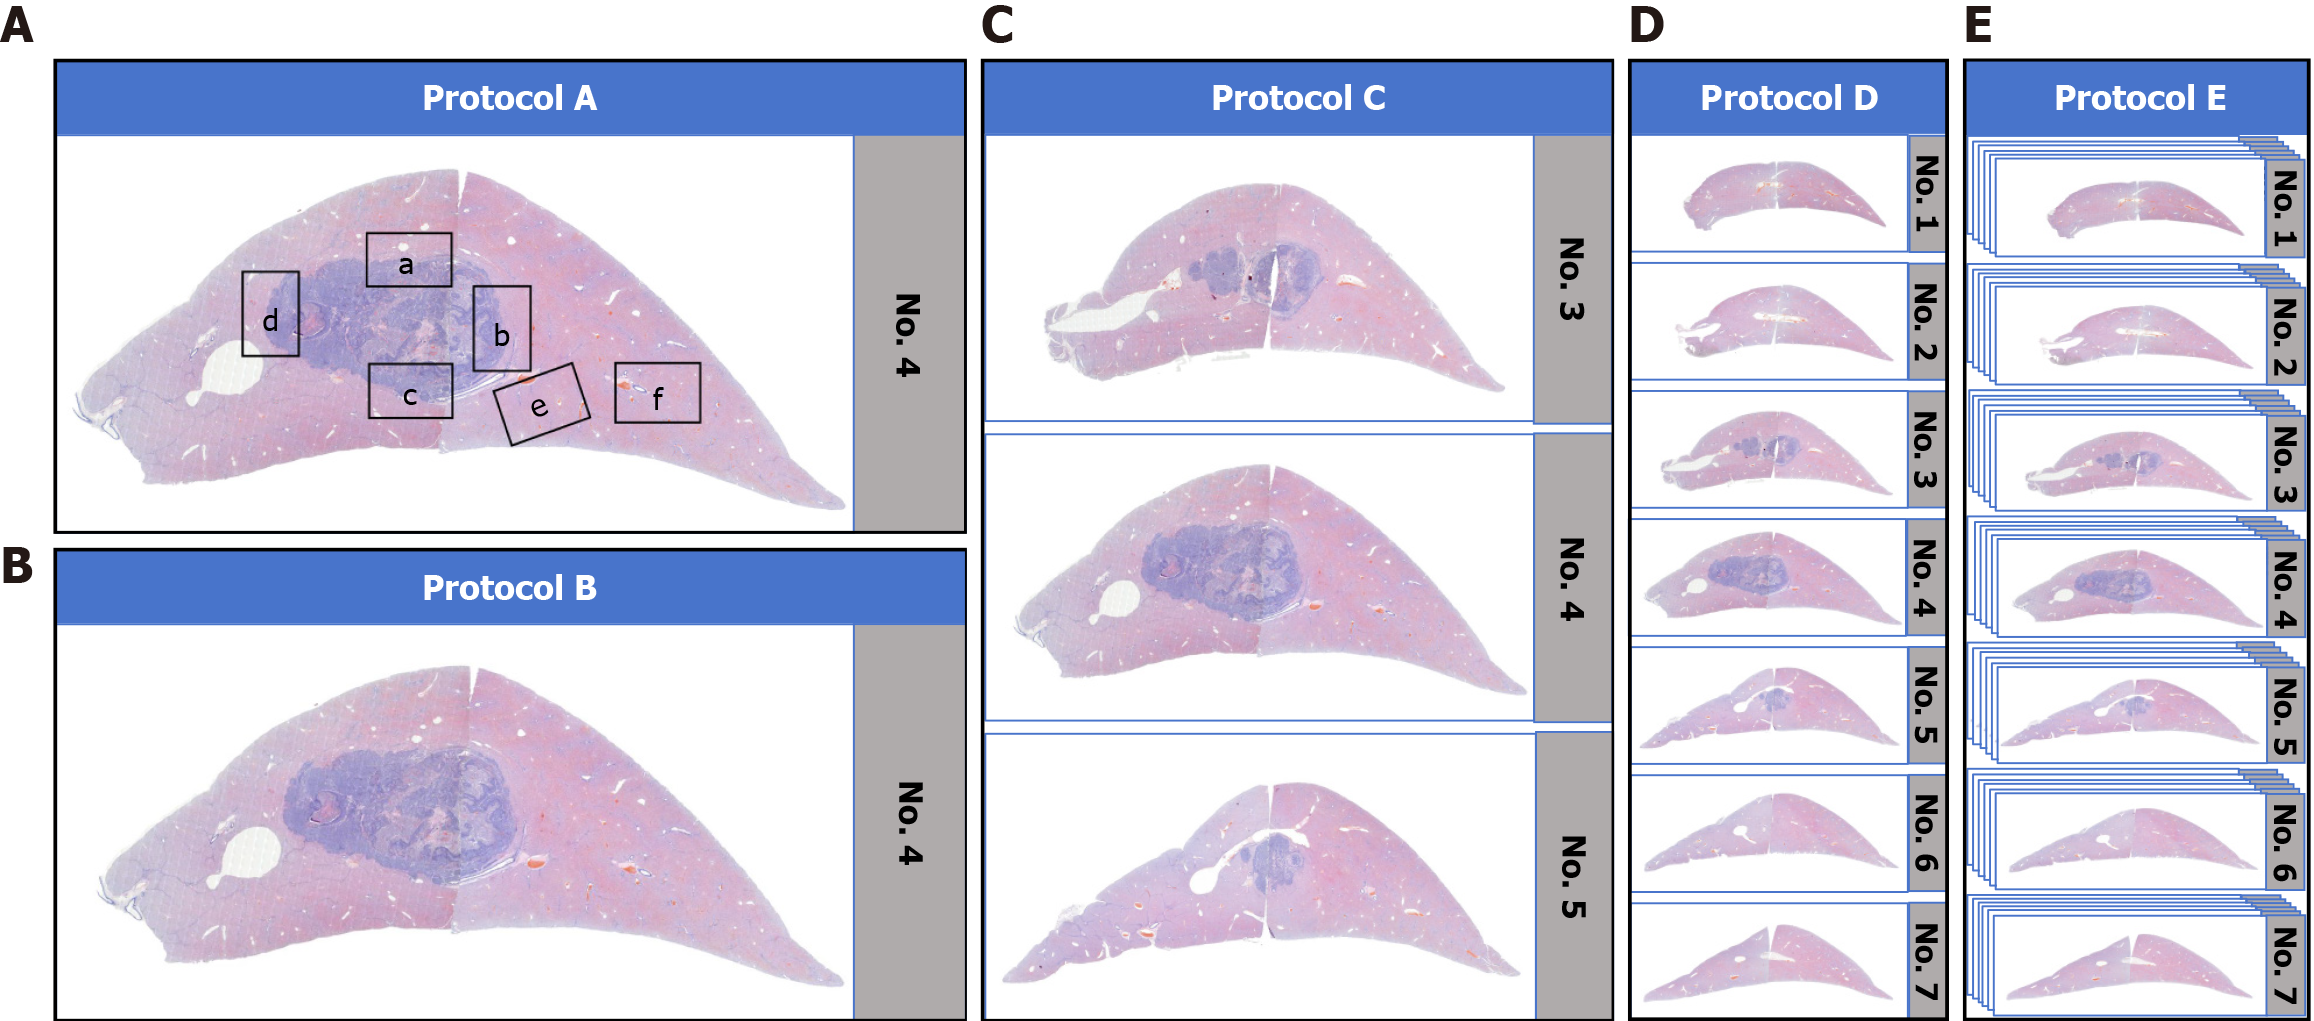
Figure 2 Schematic illustration of various sampling protocols based on whole-mount slide images.
A: Protocol A, six regions (labeled a-f) in the maximal tumor section; B: Protocol B, a single complete whole-mount slide image of the maximal tumor section (number 4); C: Protocol C, whole-mount slide images that included the tumor sections at 3 mm intervals (numbers 3-5); D: Protocol D, whole-mount slide images that included the entire liver at 3 mm intervals (numbers 1-7); E: Protocol E, whole-mount slide images that included the entire liver at 0.3 mm intervals.
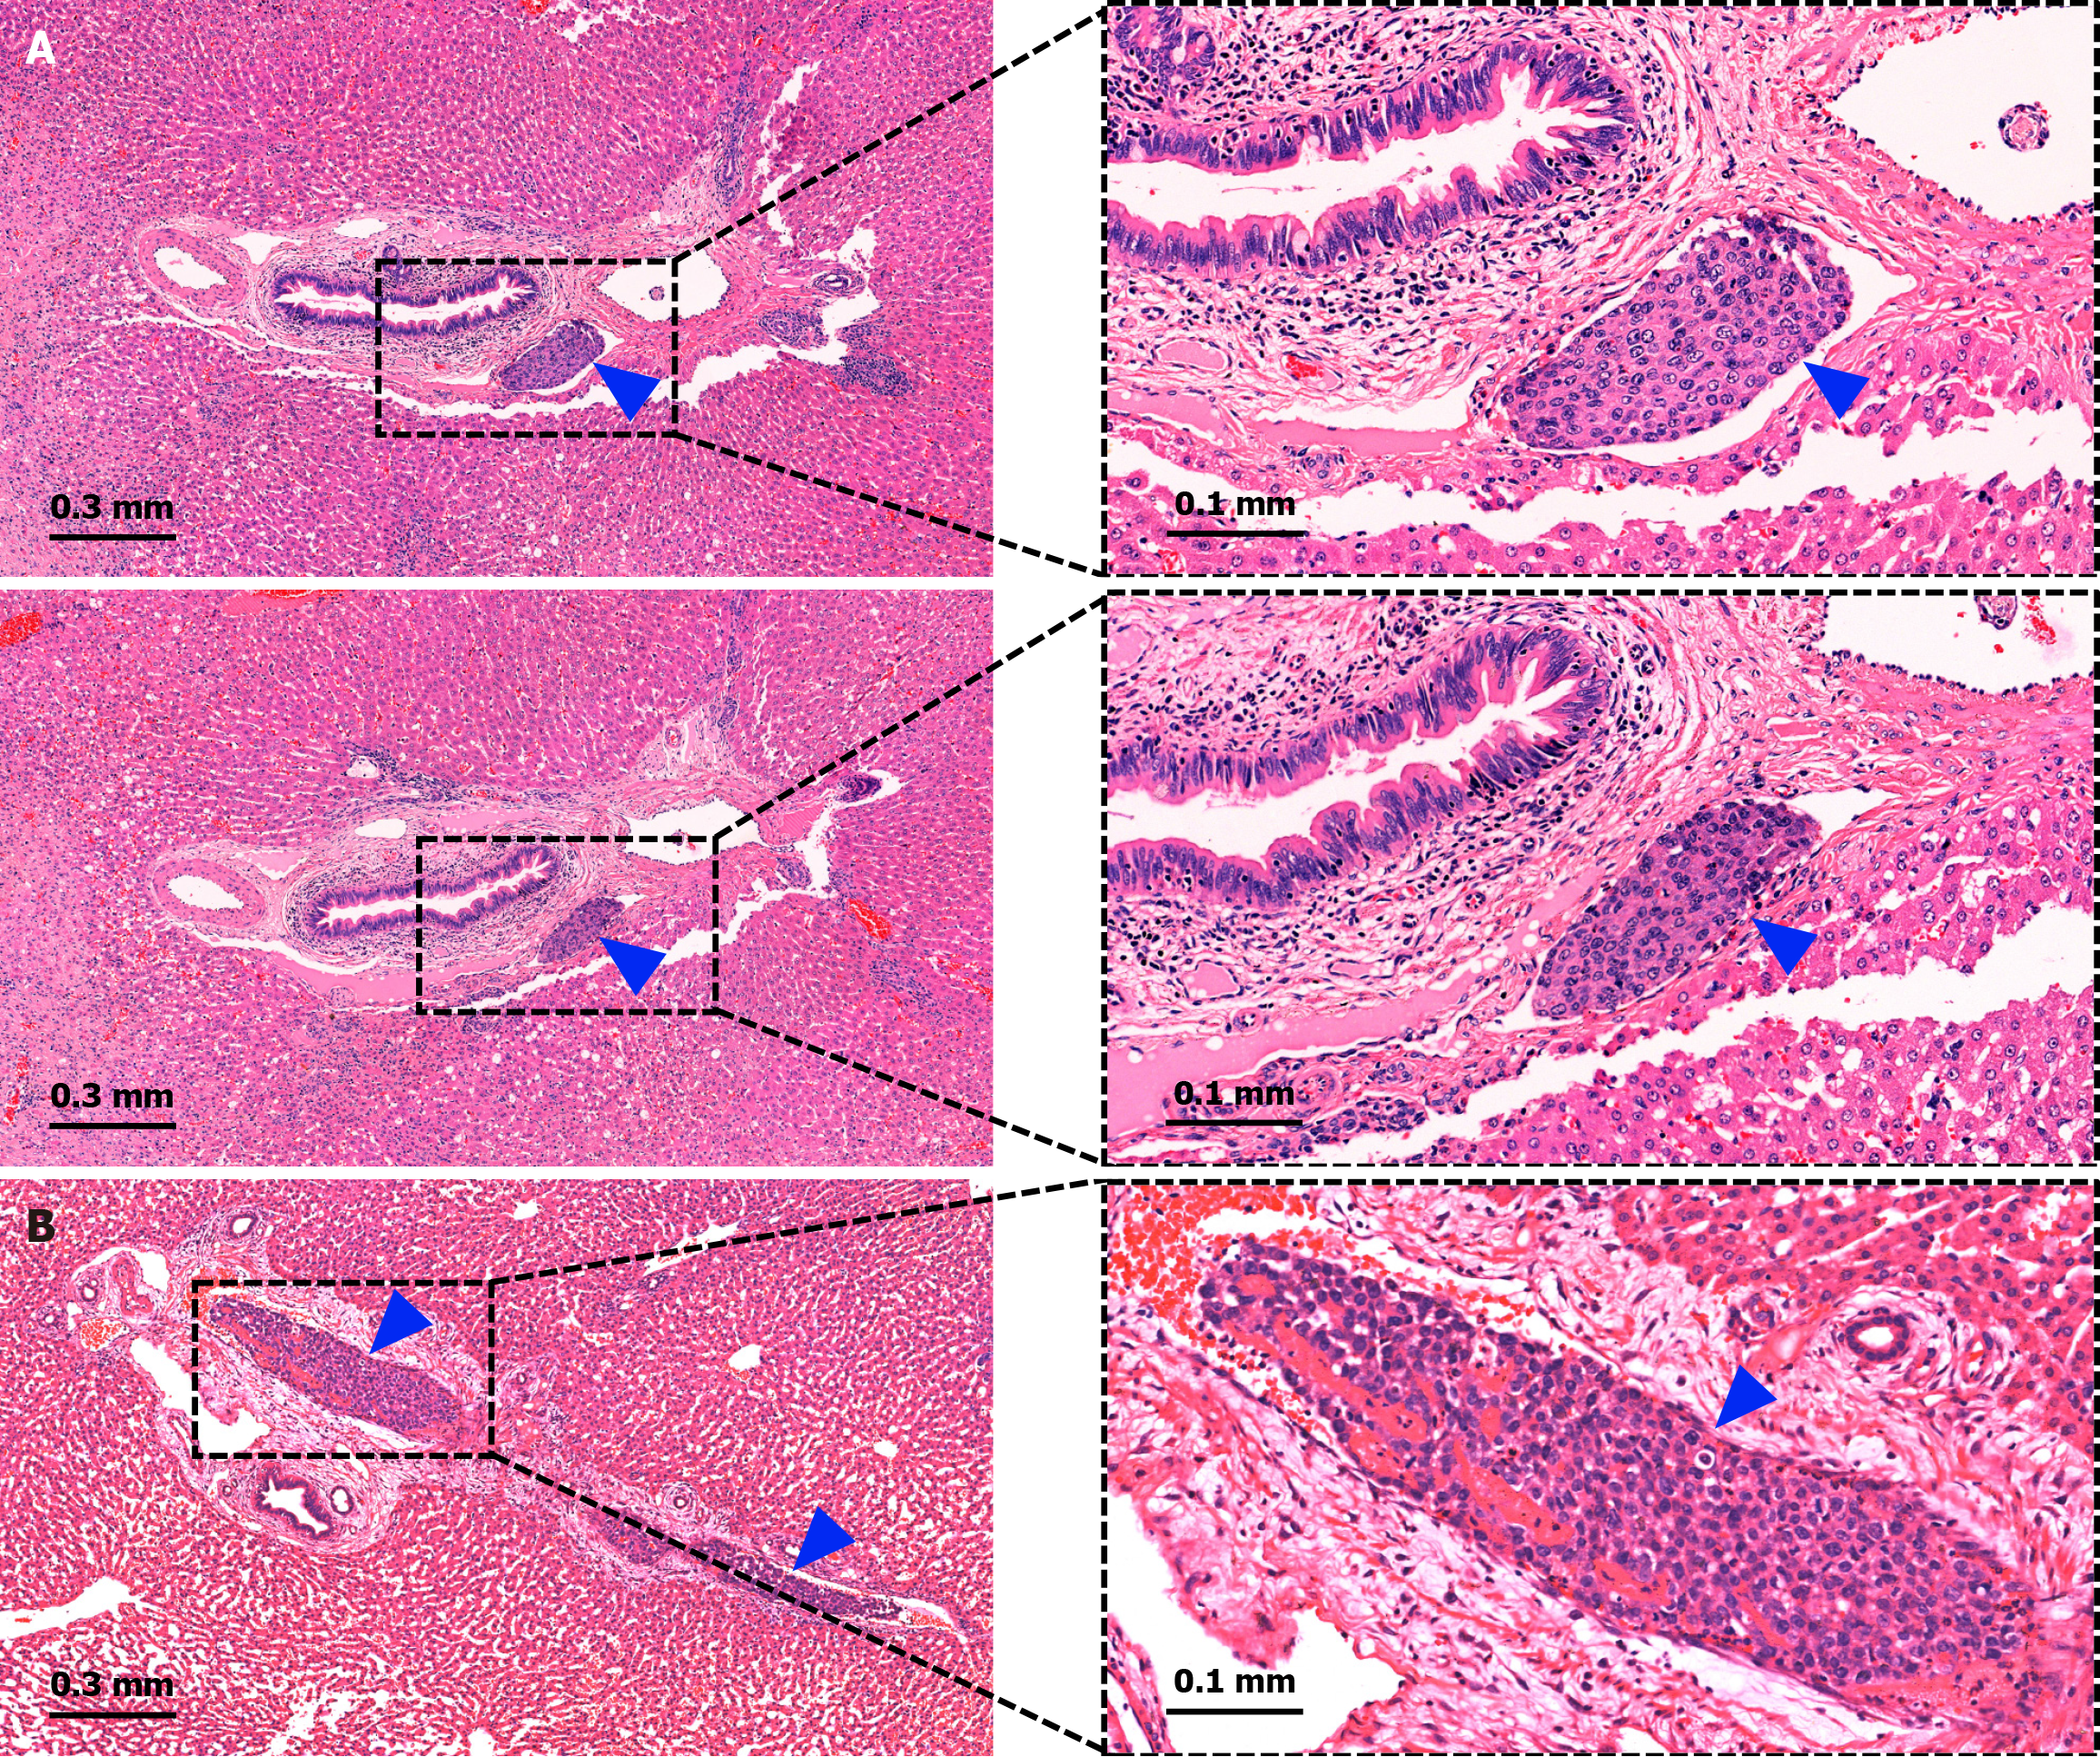
Figure 3 Illustration of counting microvascular invasion-positive lesions.
A: Microvascular invasion (indicated by blue arrows) in two sequential slices showing the same lesion, which was recorded as one lesion; B: Two microvascular invasion lesions (indicated by blue arrows) on one slice that invaded the same microvessel, which were recorded as one lesion.
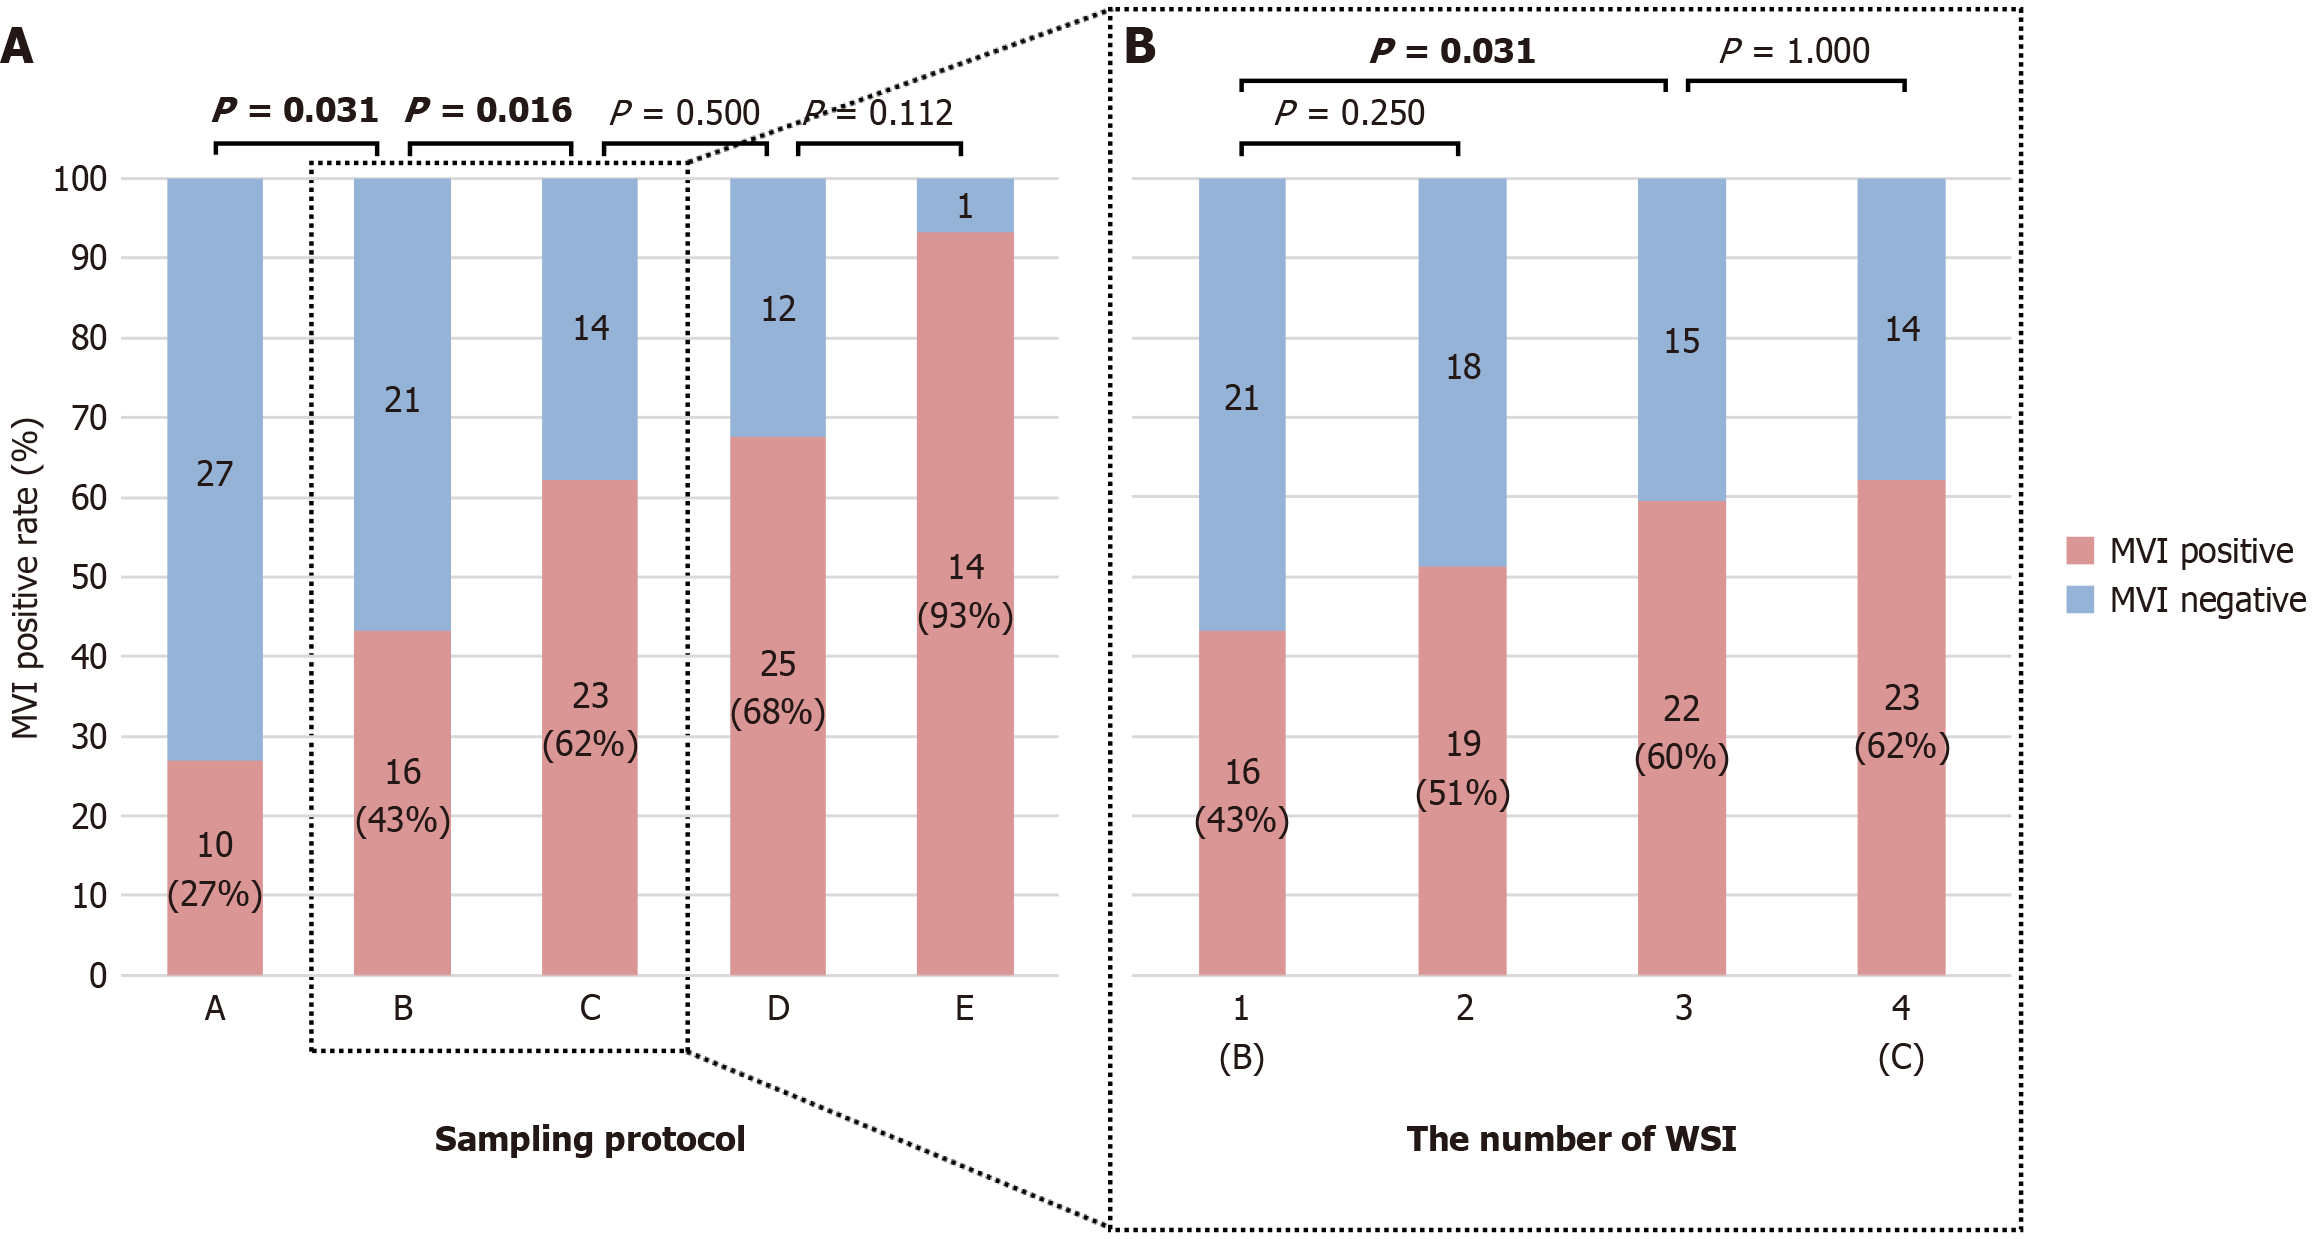
Figure 4 Impact of sampling protocol on the detection rate of microvascular invasion.
A: Sequential comparisons of microvascular invasion detection rates were made for protocols A-E. Statistical analysis was conducted via paired χ2 tests to compare protocol A vs B, B vs C, and C vs D, whereas the χ2 test was used for comparing protocol D vs E; B: The optimal number of whole-mount slide images was further determined by comparing protocols B and C. Paired χ2 tests were used for all comparisons, where whole-mount slide imaging WSI1-WSI4 correspond to the number of WSIs (1-4), respectively. MVI: Microvascular invasion; WSI: Whole-mount slide imaging.
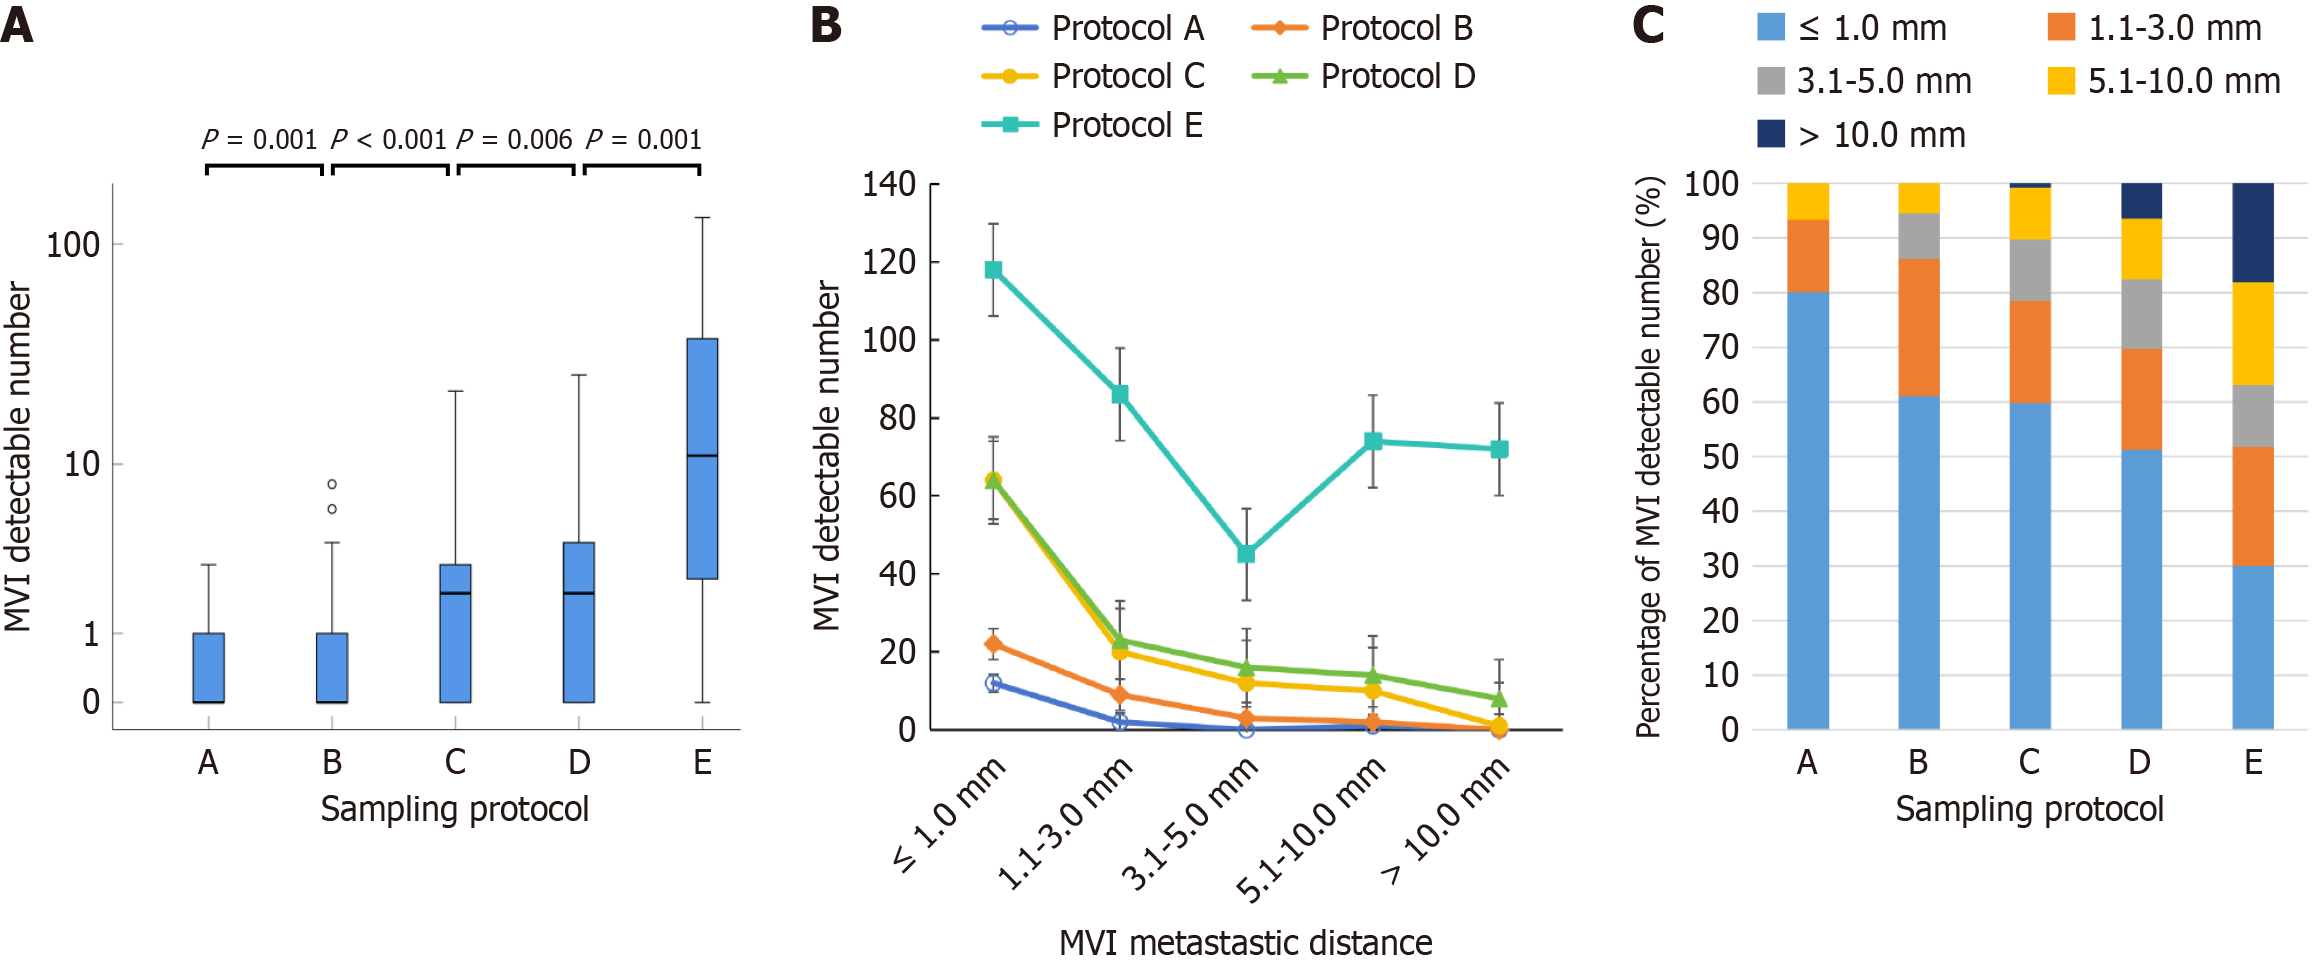
Figure 5 Quantity and distribution of microvascular invasion detected by different sampling protocols.
A: Box plot showing the number of microvascular invasion (MVI) lesions detected by various sampling protocols. The Wilcoxon matched-pairs signed-rank sum test was employed to compare protocol A vs B, B vs C, and C vs D, whereas the Mann-Whitney U test was used to compare protocol D vs E; B: Trend of in the number of MVI lesion detected in different metastatic distance groups for each sampling protocol; C: Percentage distribution of the number of MVI lesions detected in different metastatic distance groups for each sampling protocol. MVI: Microvascular invasion; WSI: Whole-mount slide imaging.
- Citation: Li LJ, Wu CQ, Ye FL, Xuan Z, Zhang XL, Li JP, Zhou J, Su ZZ. Histopathological diagnosis of microvascular invasion in hepatocellular carcinoma: Is it reliable? World J Gastroenterol 2025; 31(5): 98928
- URL: https://www.wjgnet.com/1007-9327/full/v31/i5/98928.htm
- DOI: https://dx.doi.org/10.3748/wjg.v31.i5.98928


