©The Author(s) 2025.
World J Gastroenterol. Nov 14, 2025; 31(42): 112180
Published online Nov 14, 2025. doi: 10.3748/wjg.v31.i42.112180
Published online Nov 14, 2025. doi: 10.3748/wjg.v31.i42.112180
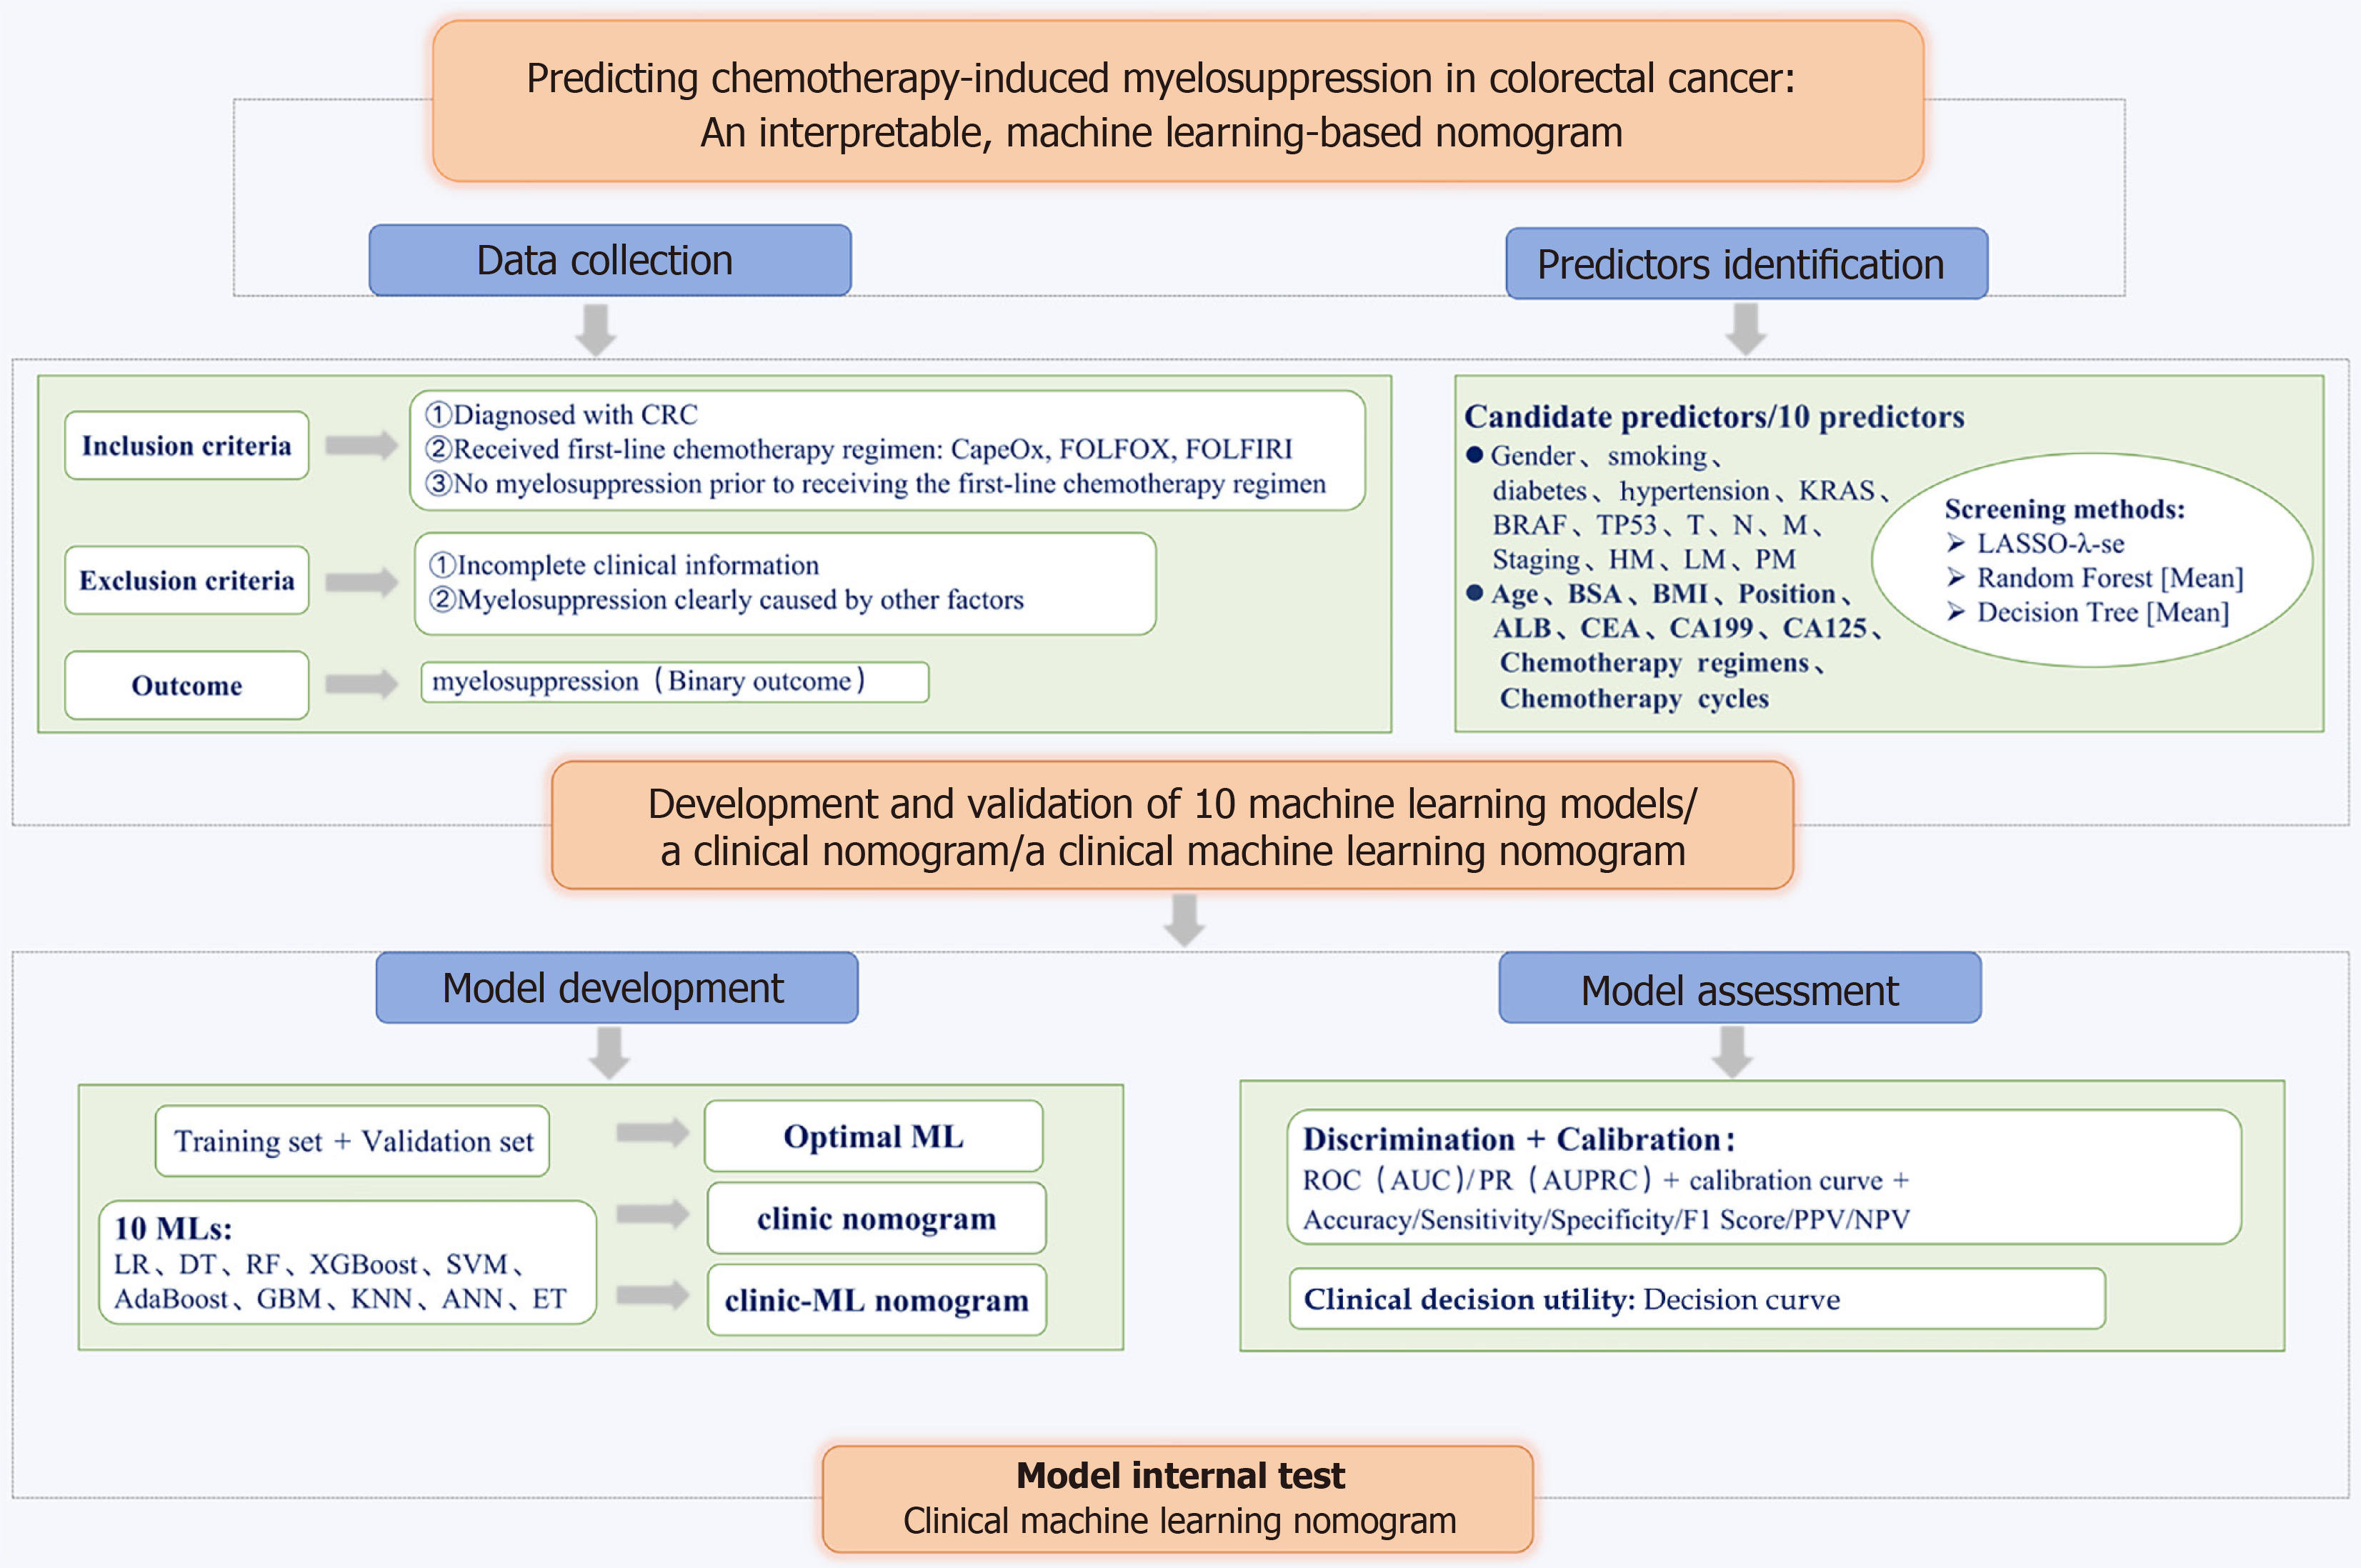
Figure 1 Flowchart of the study protocol.
CRC: Colorectal cancer; T: Tumor; N: Node; M: Metastasis; HM: Hepatic metastasis; LM: Lung metastasis; PM: Peritoneal metastasis; BSA: Body surface area; BMI: Body mass index; ALB: Albumin; CEA: Carcinoembryonic antigen; CA: Carbohydrate antigen; LASSO: Least absolute shrinkage and selection operator; ML: Machine learning; LR: Logistic regression; DT: Decision trees; RF: Random forest; XGBoost: Extreme gradient boosting; SVM: Support vector machines; GBM: Gradient boosting machines; KNN: K-Nearest neighbors; ANN: Artificial neural network; ET: Extreme trees; ROC: Receiver operating characteristic; AUC: Area under the curve; PR: Precision-recall; AUPRC: Area under the precision-recall curve; PPV: Positive predictive value; NPV: Negative predictive value.
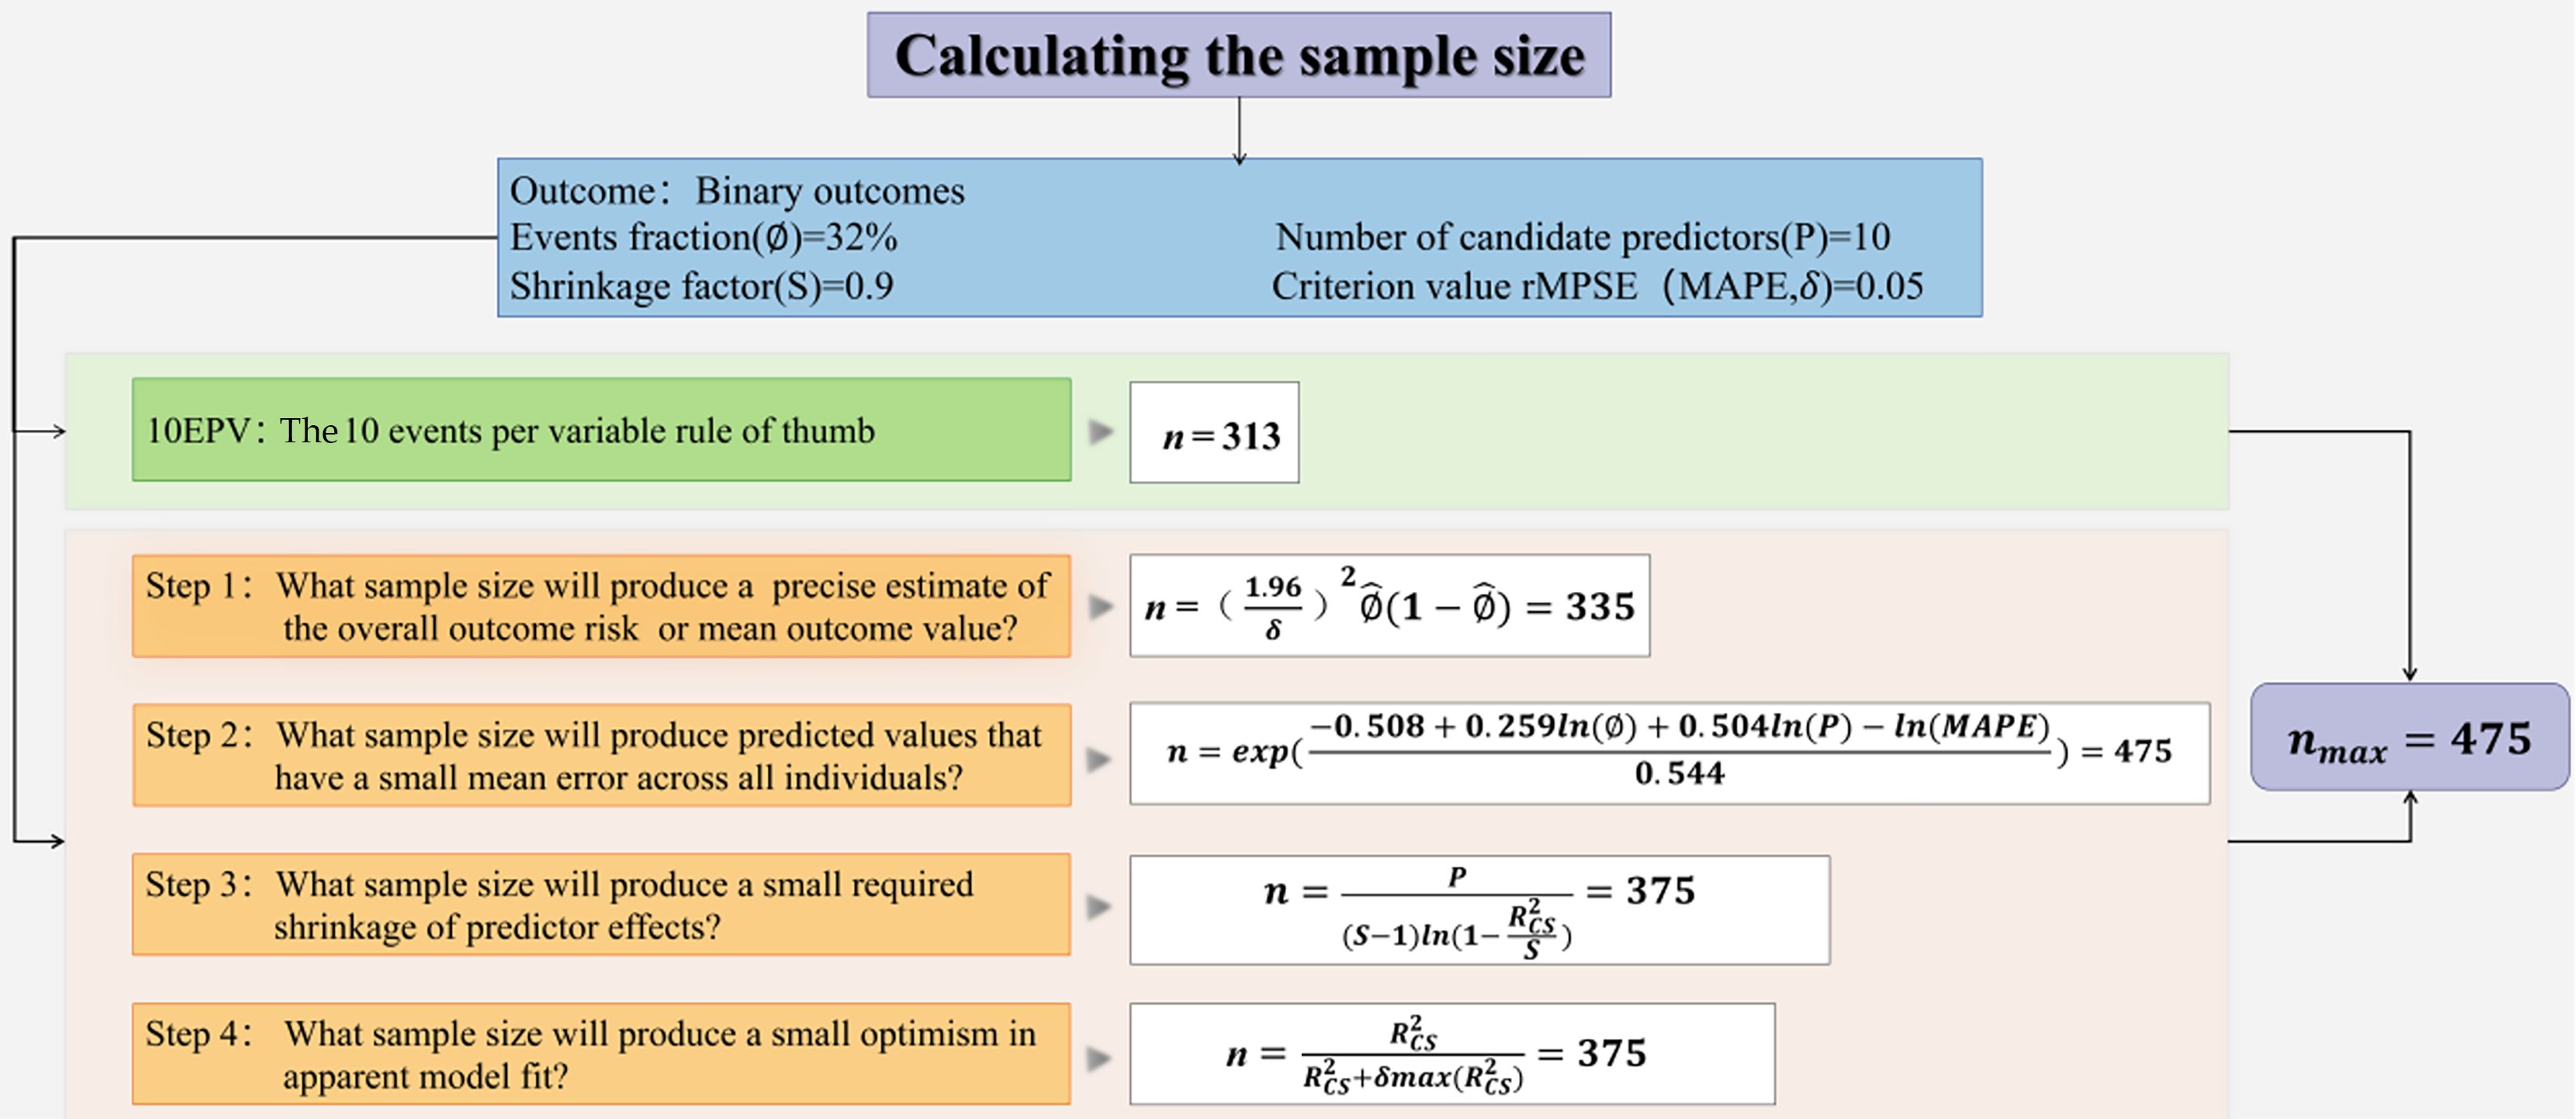
Figure 2 Sample size calculation flowchart.
rMPSE: Root mean squared prediction error; MPSE: Mean squared prediction error; EPV: Events per variable. In formula: Ø: Events fraction; δ: A margin of error, generally recommend < 0.05; P: Number of candidate predictors; S: Shrinkage factor; R2cs: A (conservative) value for the anticipated model performance is required, as defined by the Cox-Snell R squared statistic; MAPE: The mean absolute prediction error; n: The sample size.
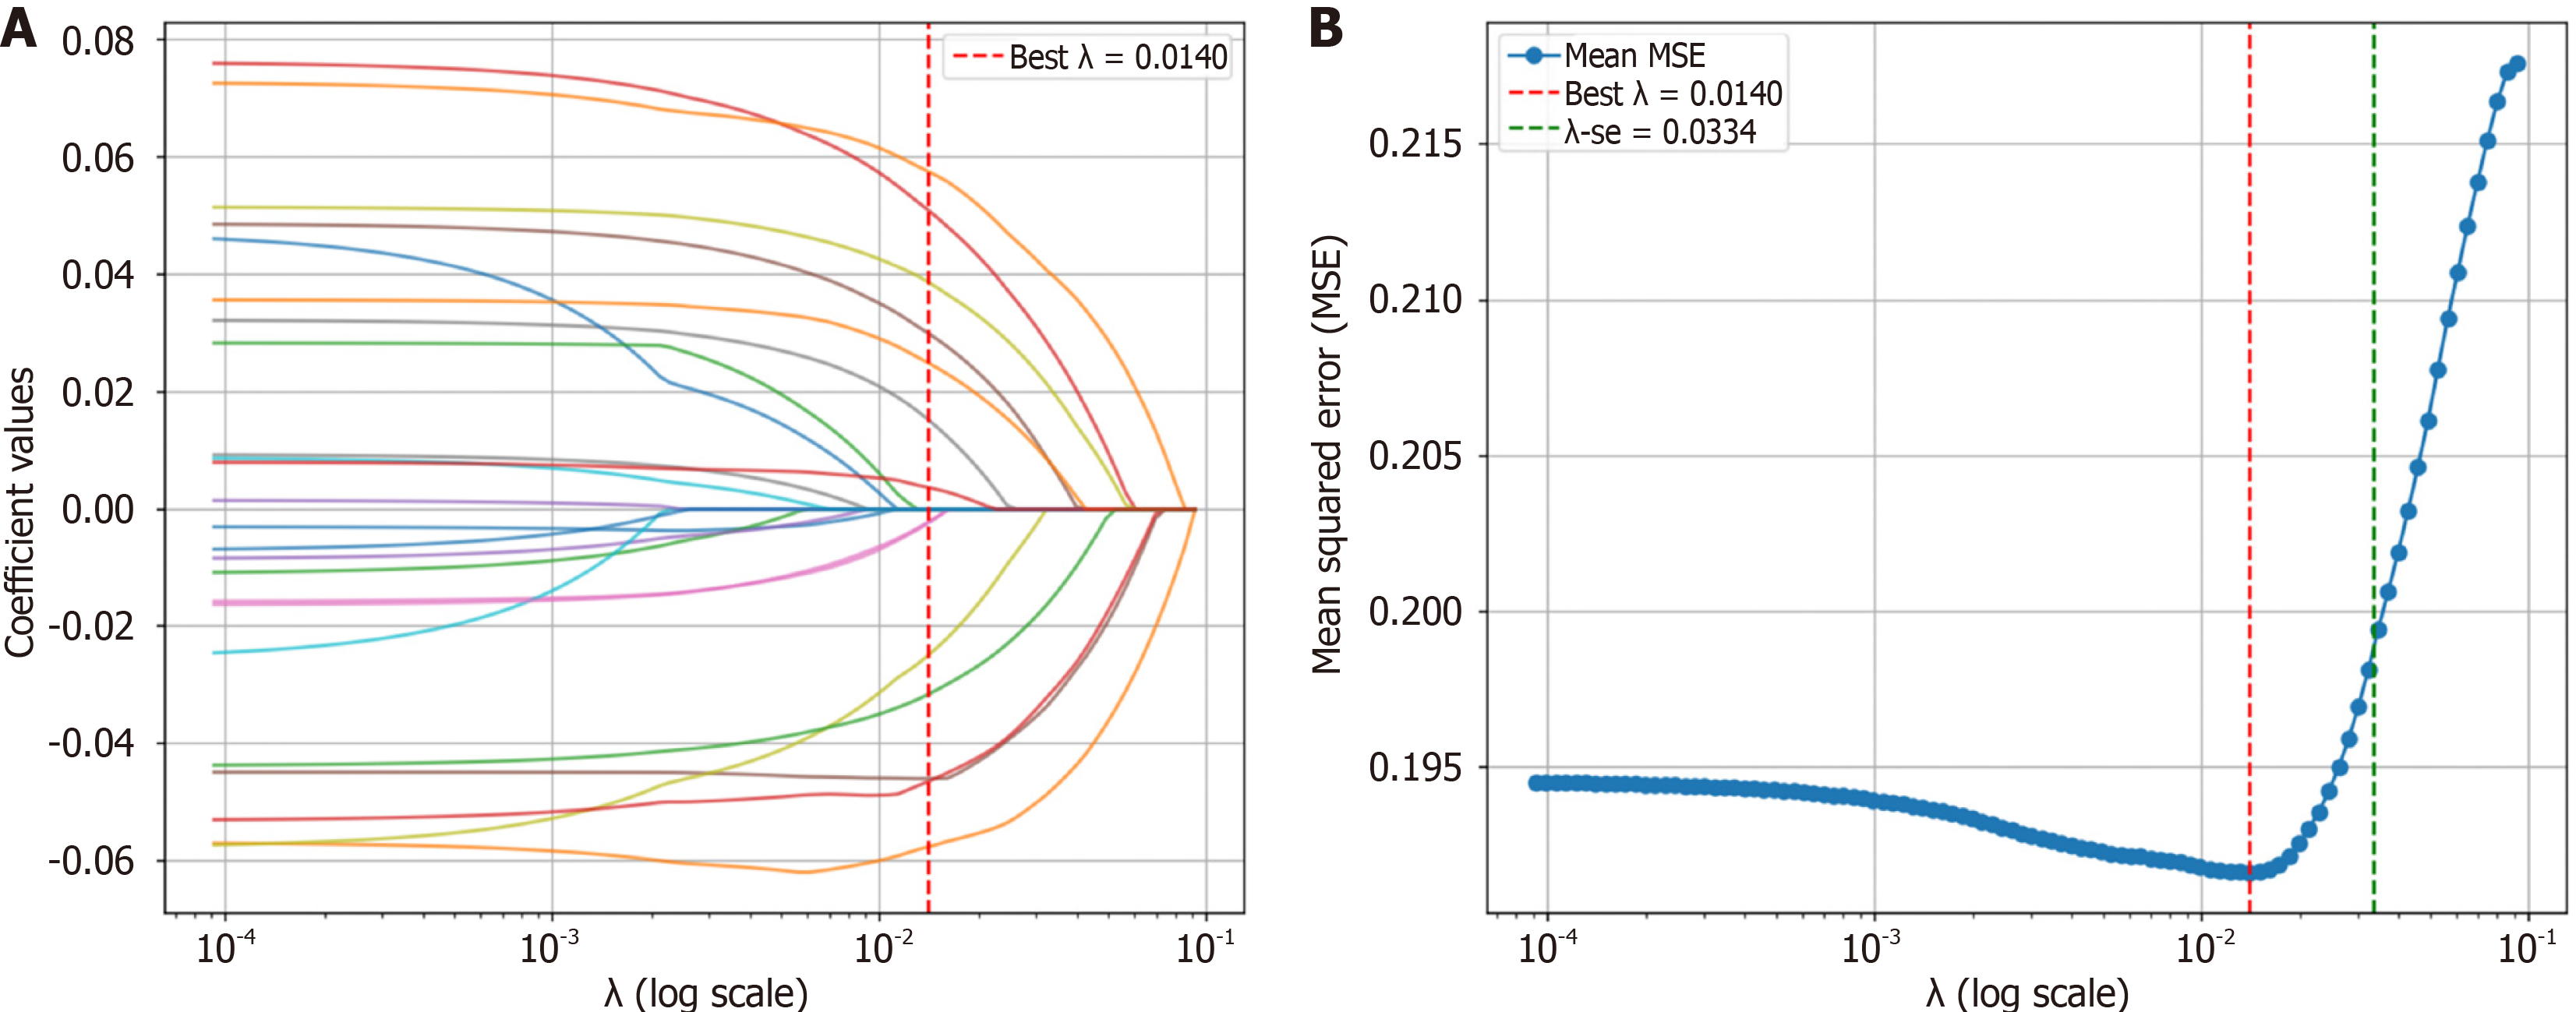
Figure 3 Candidate predictor screening using least absolute shrinkage and selection operator.
A: Path diagram of least absolute shrinkage and selection operator (LASSO) regression coefficients for candidate predictors; B: Cross-validation curves for LASSO. MSE: Mean squared error.
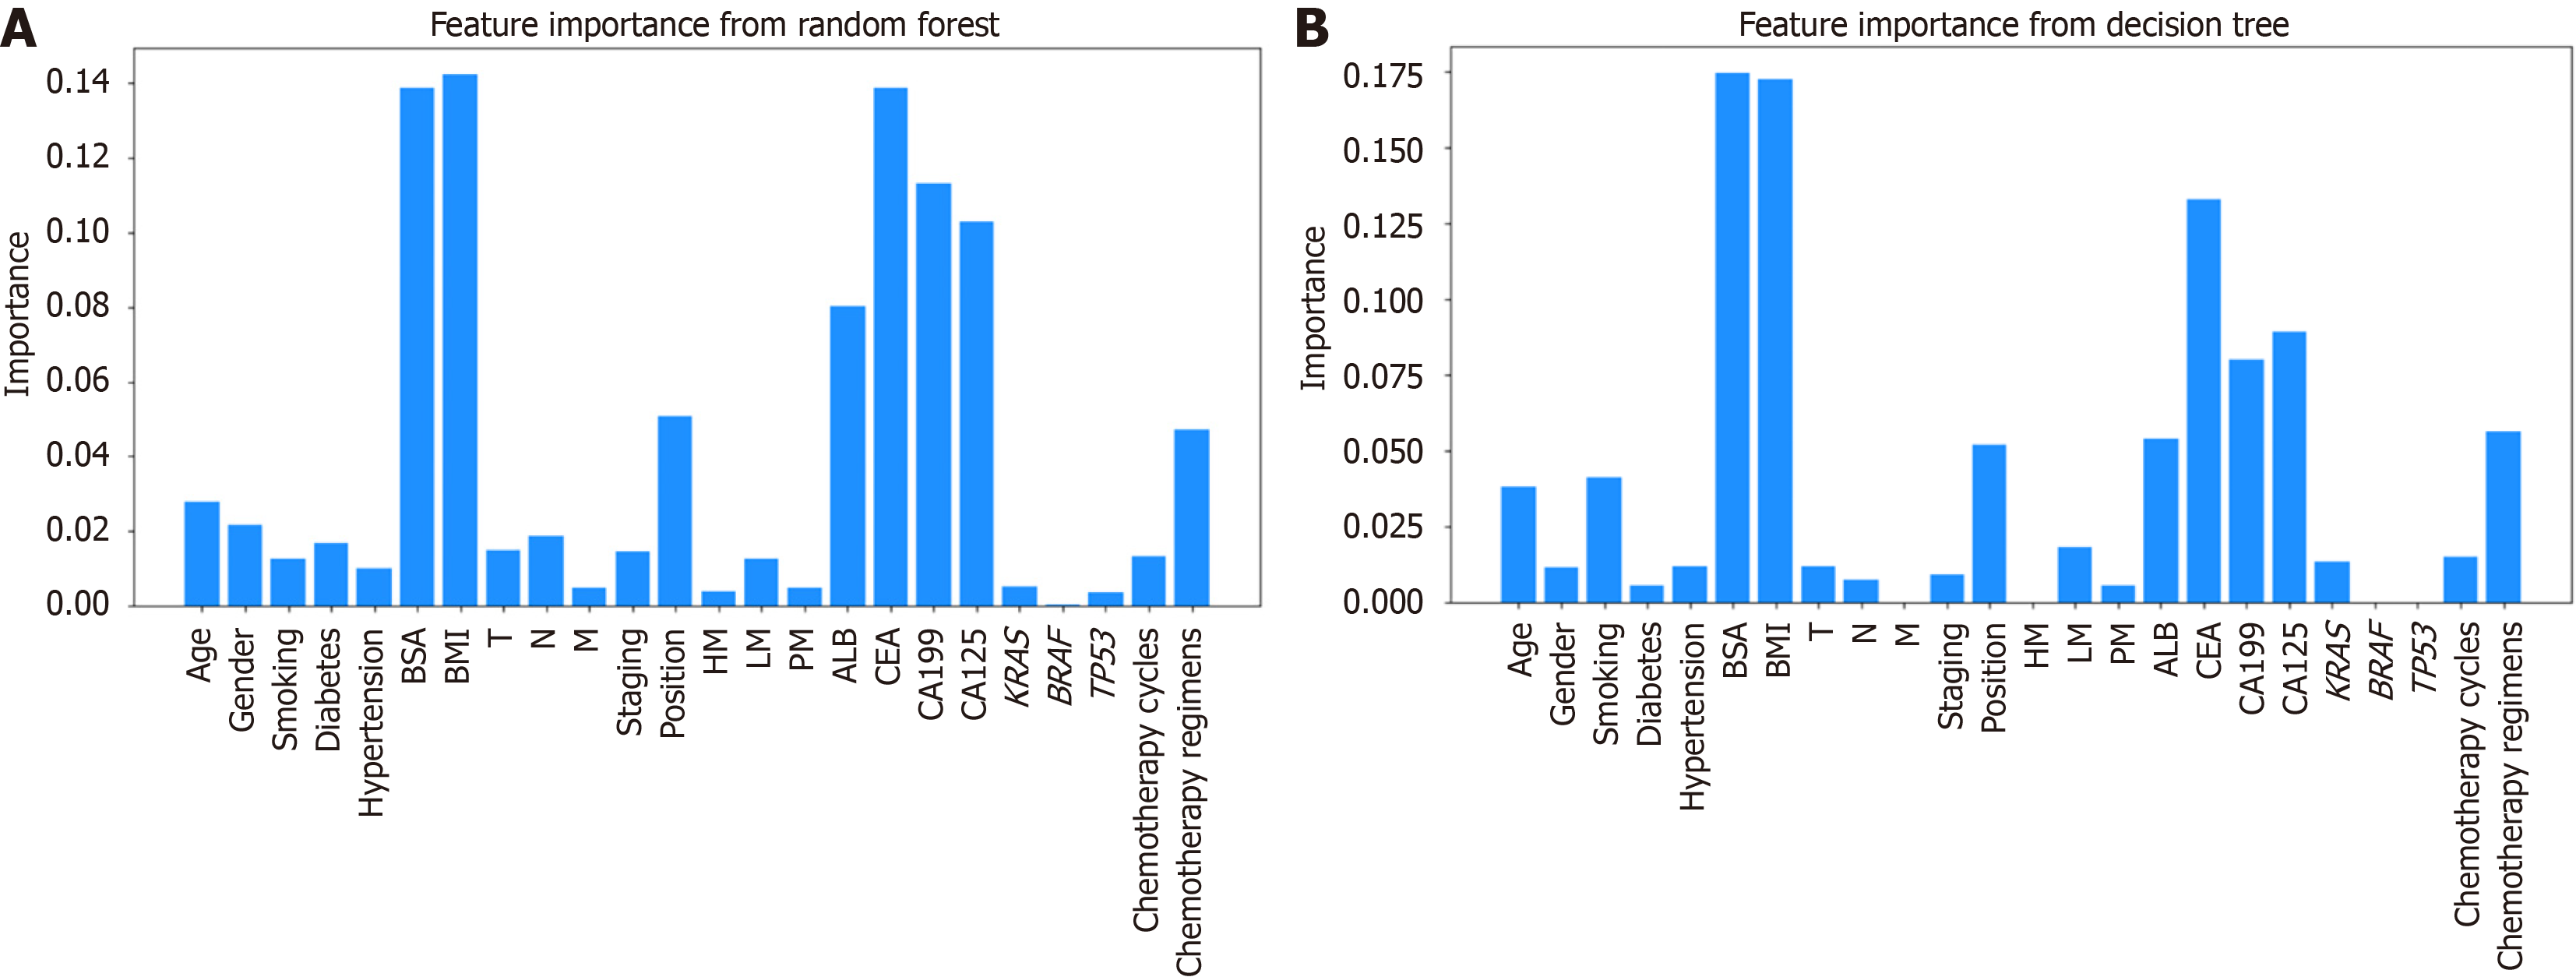
Figure 4 Mean importance of candidate predictors.
A: Random forest algorithm; B: Decision trees algorithm. BSA: Body surface area; BMI: Body mass index; T: Tumor; N: Node; M: Metastasis; HM: Hepatic metastasis; LM: Lung metastasis; PM: Peritoneal metastasis; ALB: Albumin; CEA: Carcinoembryonic antigen; CA: Carbohydrate antigen.
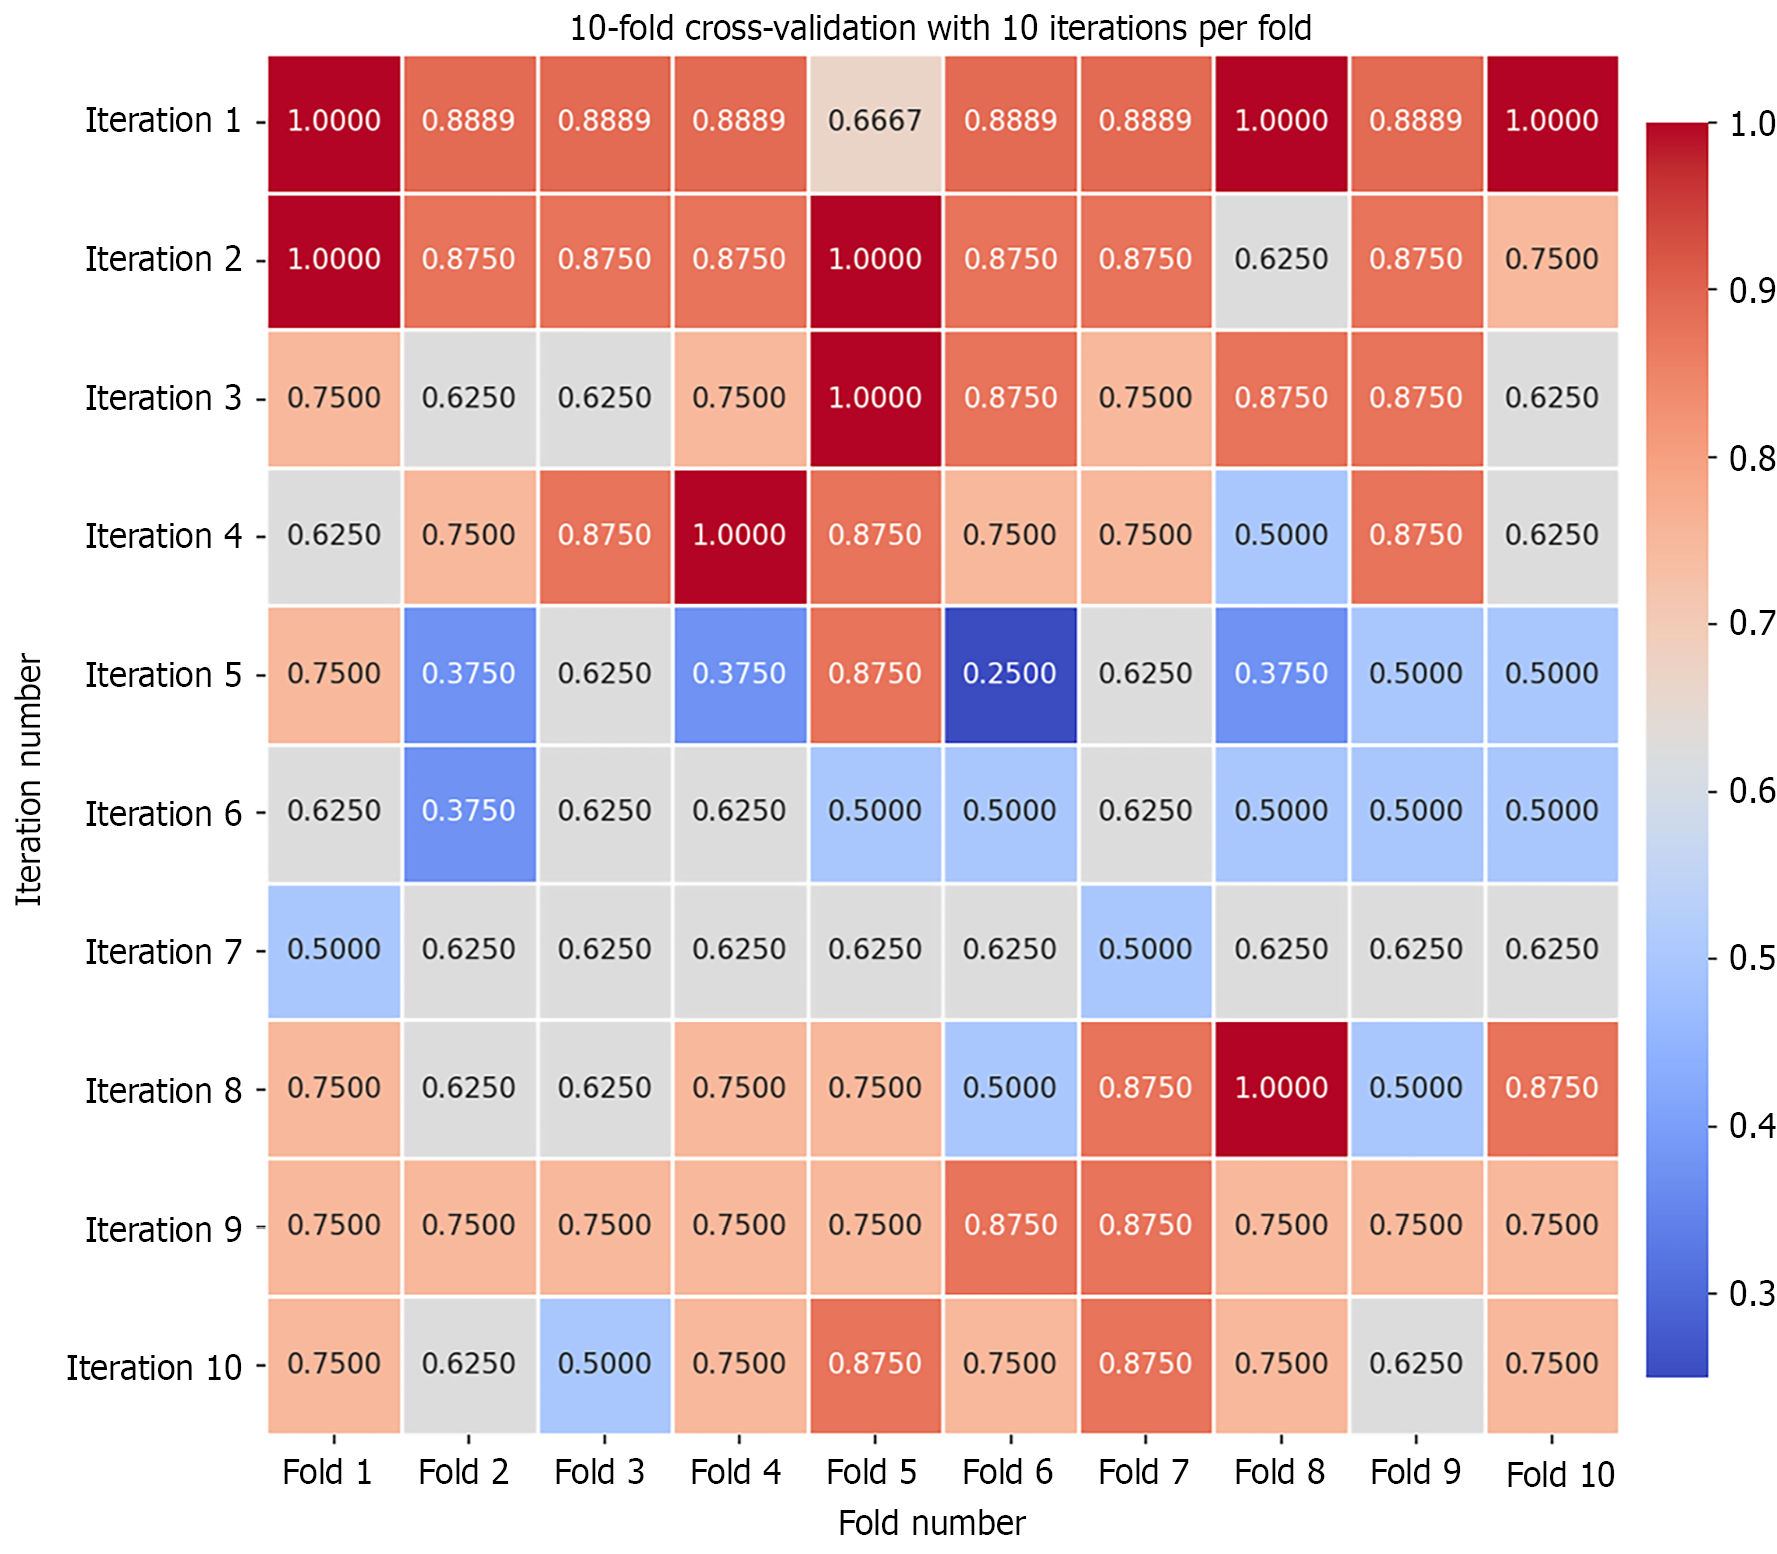
Figure 5 10-fold cross-validation plot.
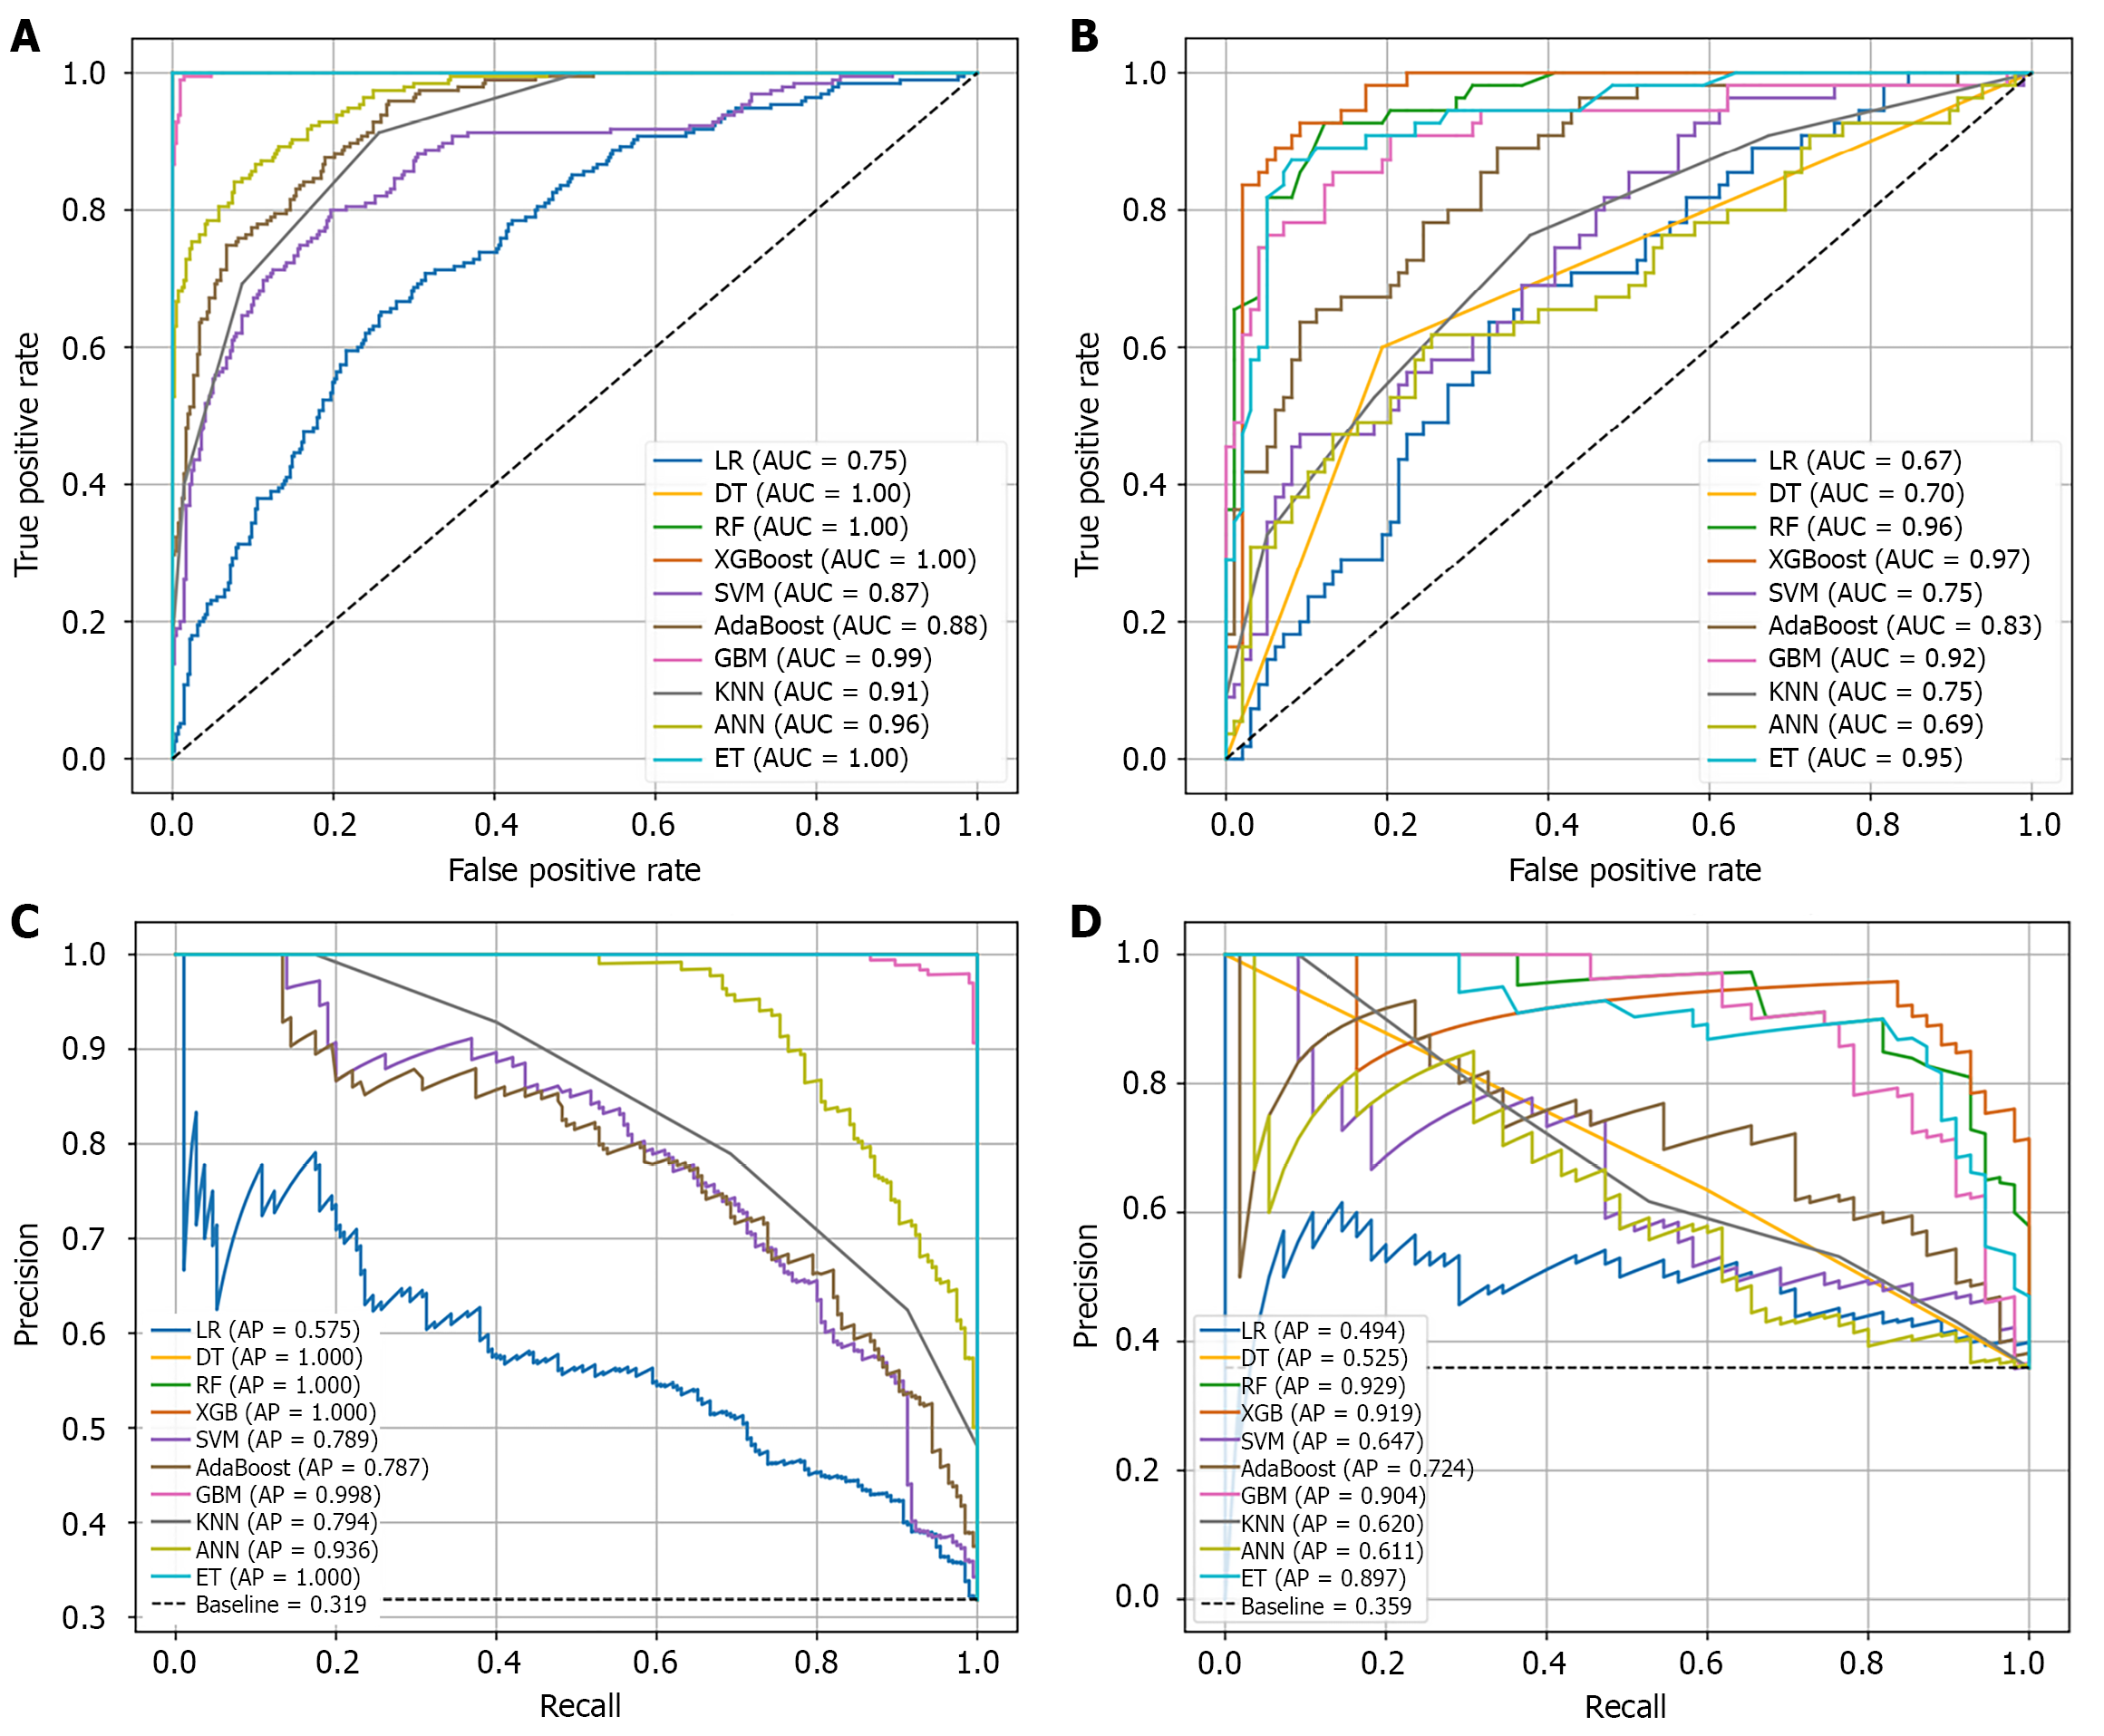
Figure 6 Curves for 10 machine learnings.
A and B: Receiver operating characteristic curves of training set (A) and validation set (B); C and D: Precision-recall curves of training set (C) and validation set (D). LR: Logistic regression; DT: Decision trees; RF: Random forest; XGBoost: Extreme gradient boosting; SVM: Support vector machines; GBM: Gradient boosting machines; KNN: K-Nearest neighbors; ANN: Artificial neural network; ET: Extreme trees; AUC: Area under the curve; AP: Average precision.
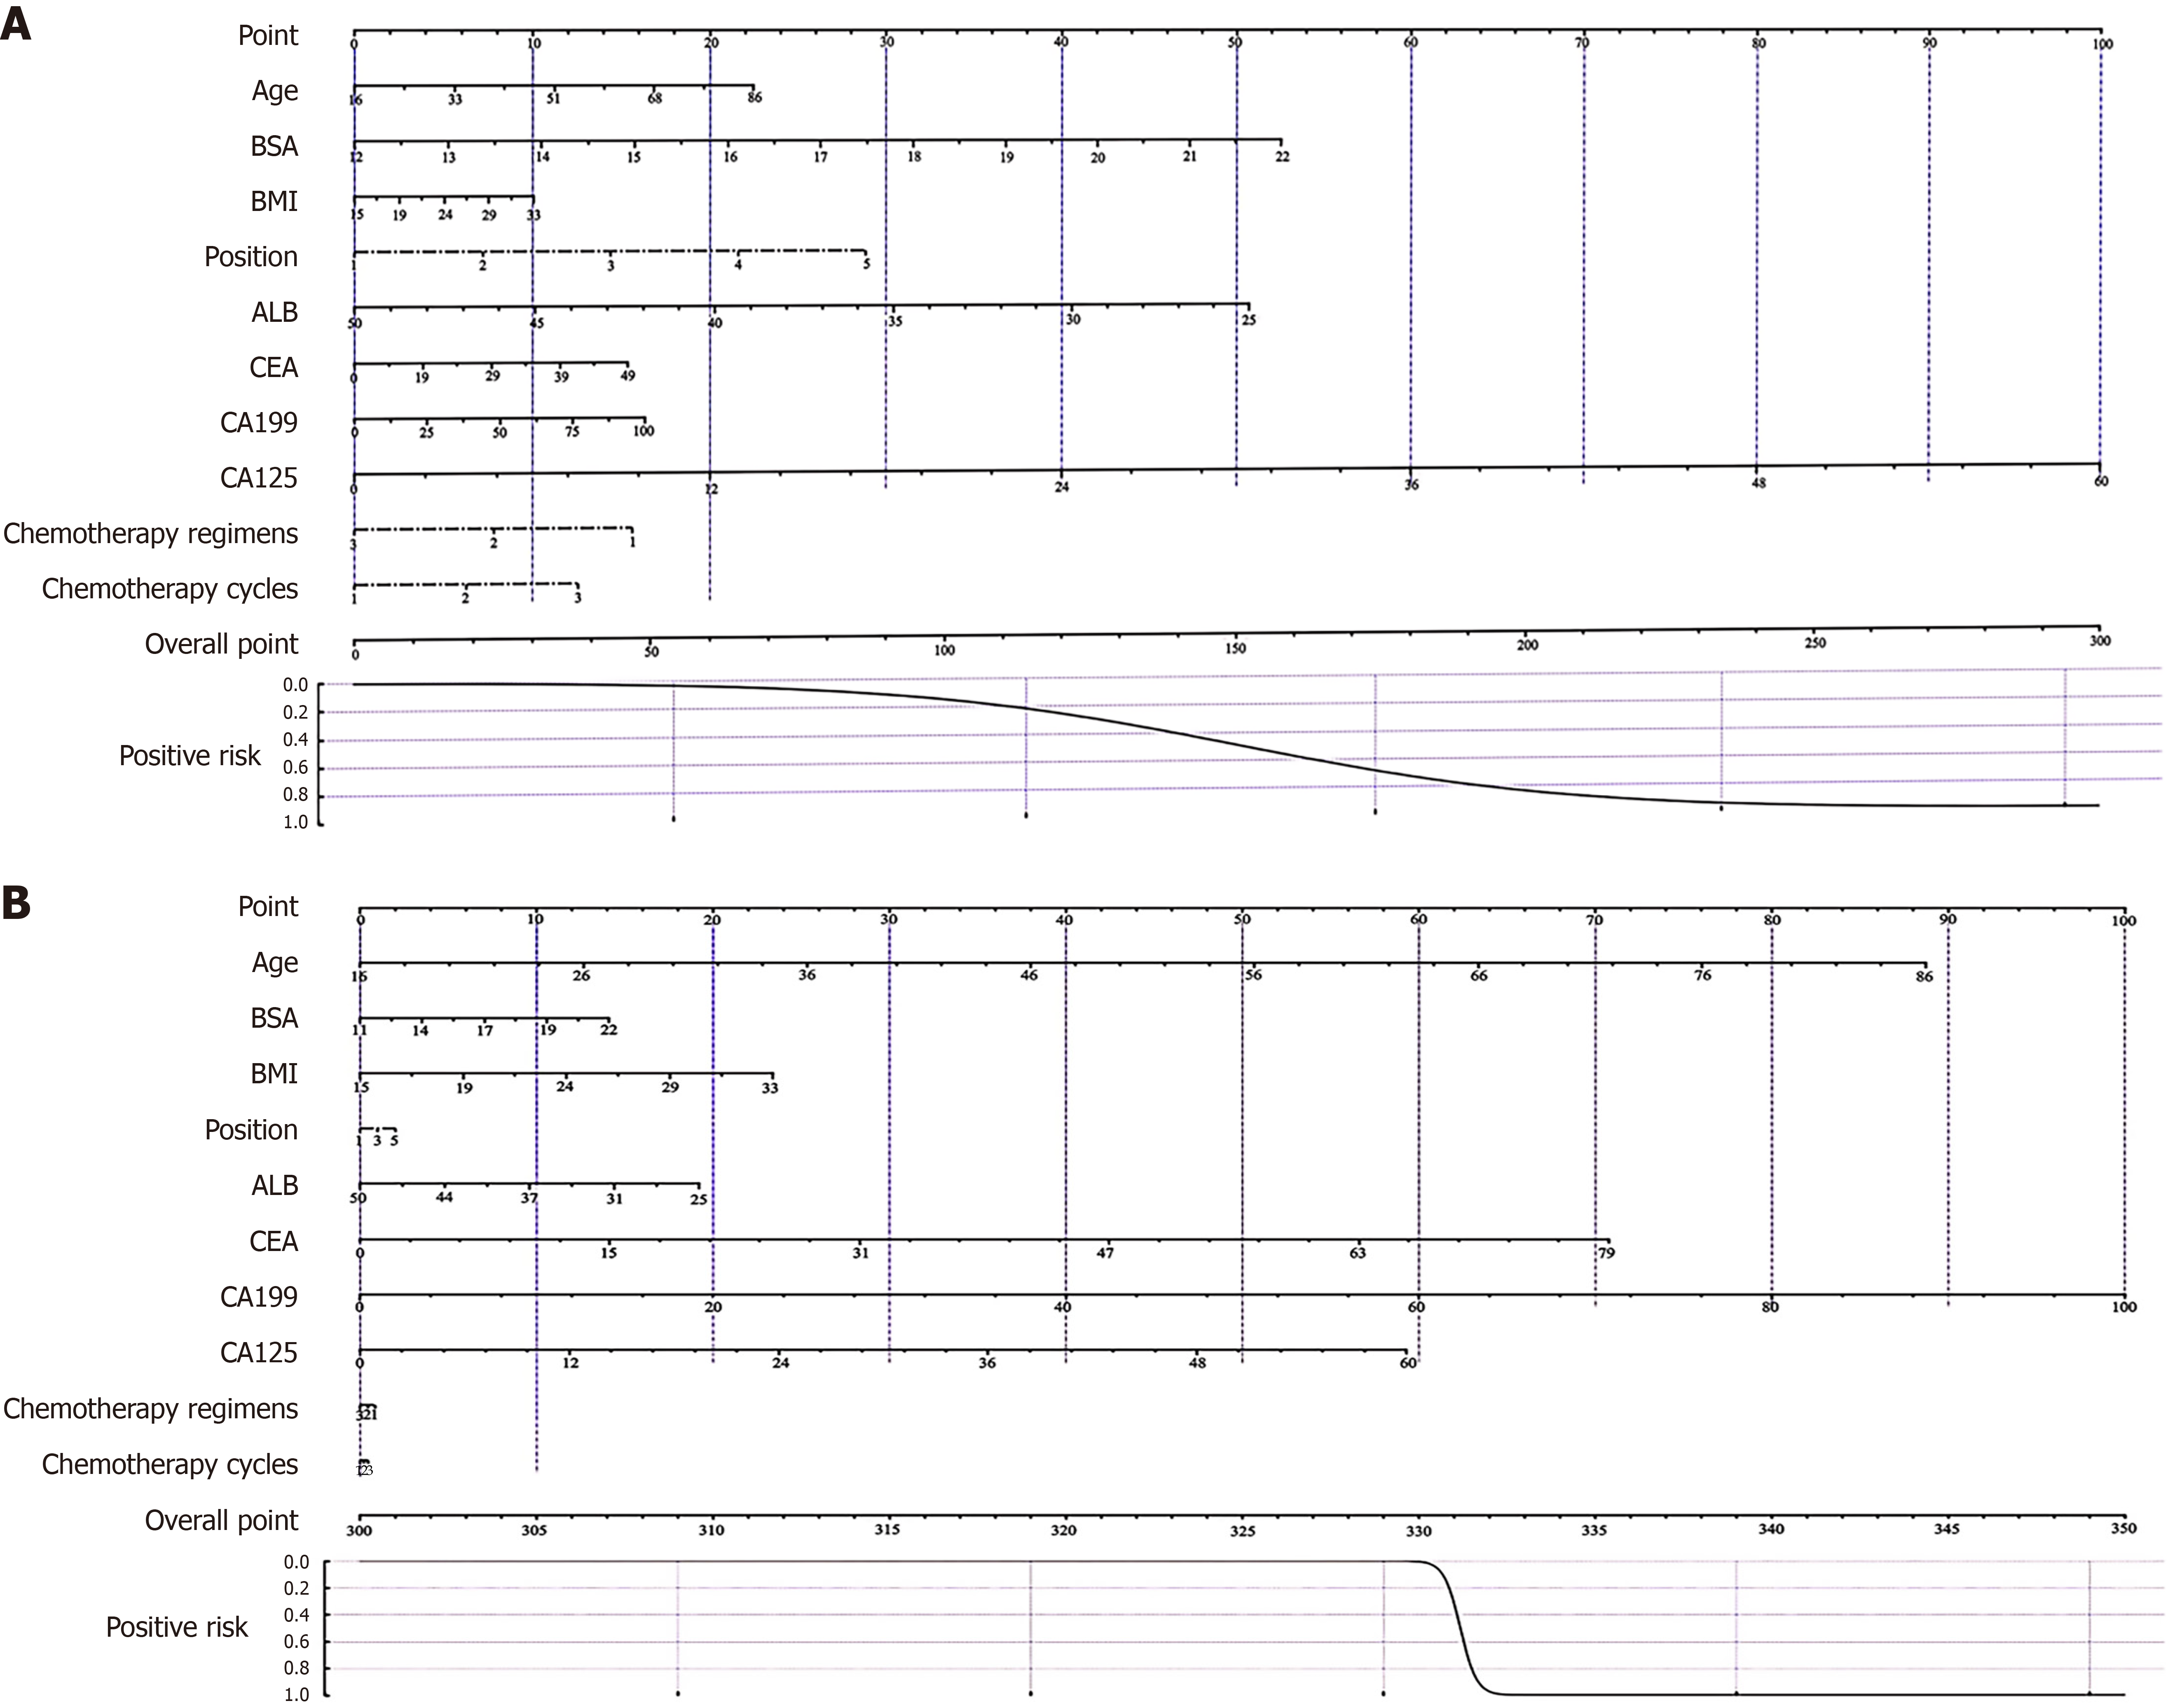
Figure 7 The nomogram for predicting myelosuppression induced by first-line chemotherapy in colorectal cancer.
A: Clinic-machine learning; B: Clinic. BSA: Body surface area; BMI: Body mass index; ALB: Albumin; CEA: Carcinoembryonic antigen; CA: Carbohydrate antigen.
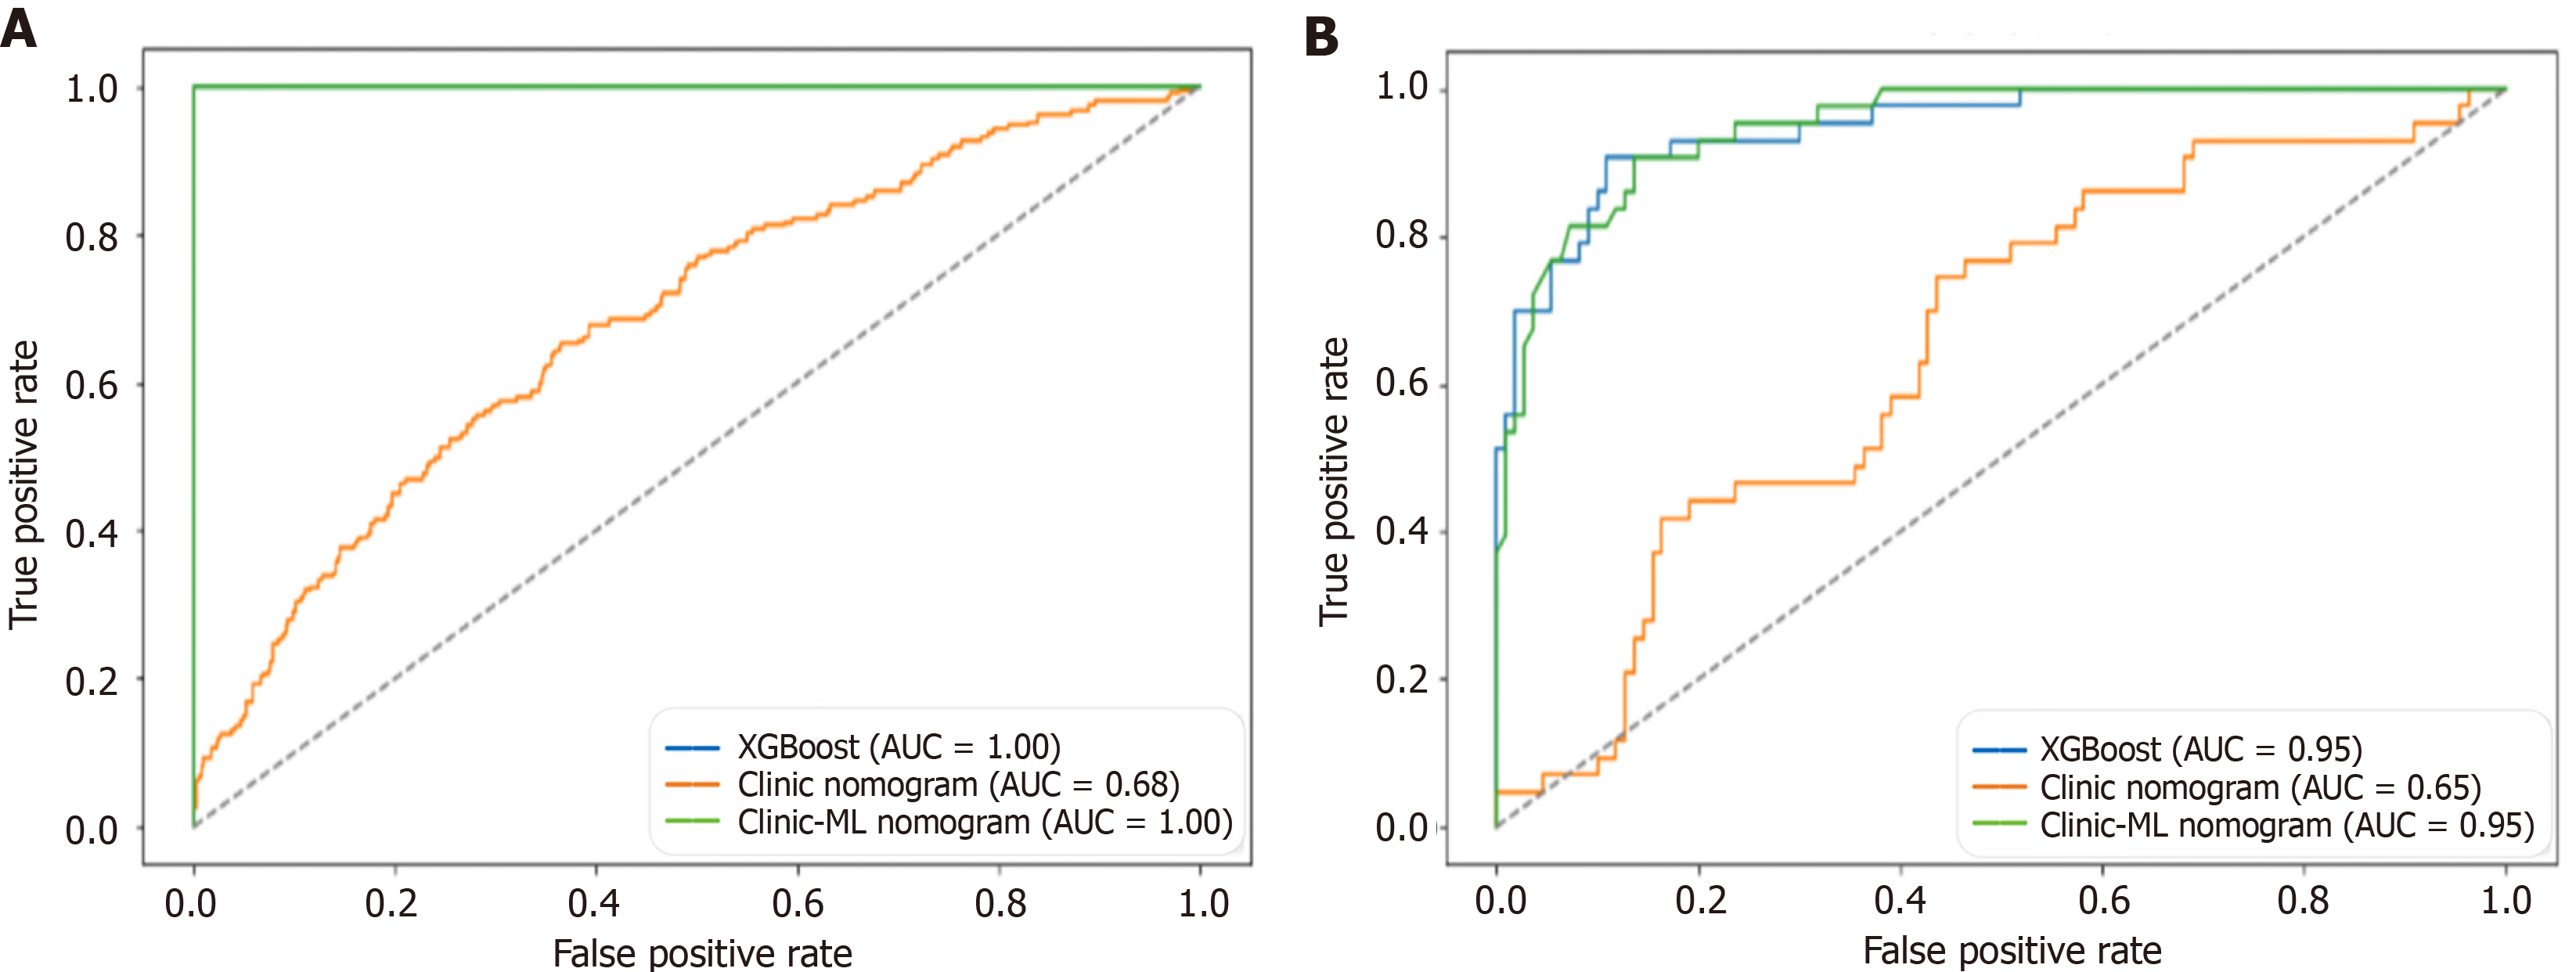
Figure 8 Receiver operating characteristic curves for extreme gradient boosting, clinic nomogram and clinic-machine learning nomo
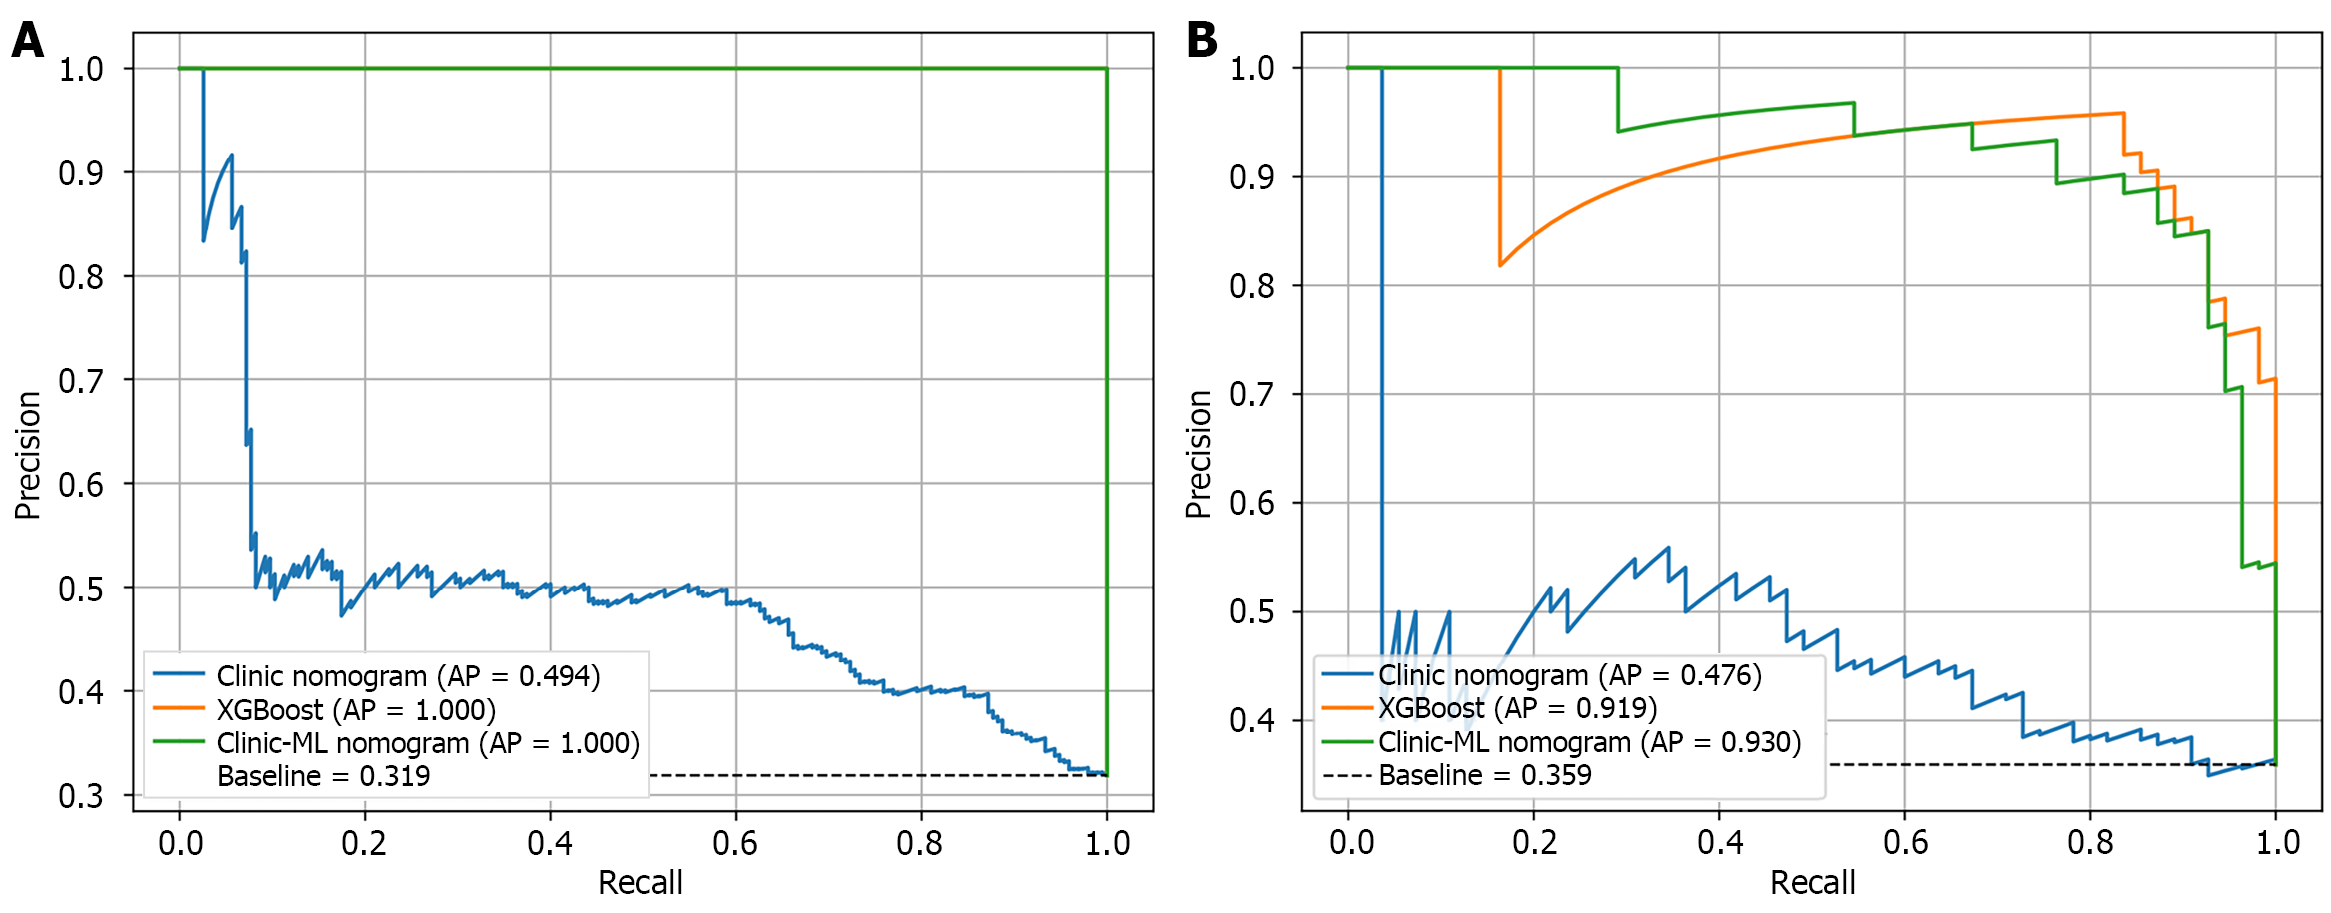
Figure 9 Precision-recall curve for extreme gradient boosting, clinic nomogram and clinic-machine learning nomogram.
A: Training set; B: Validation set. XGBoost: Extreme gradient boosting; AP: Average precision; ML: Machine learning.
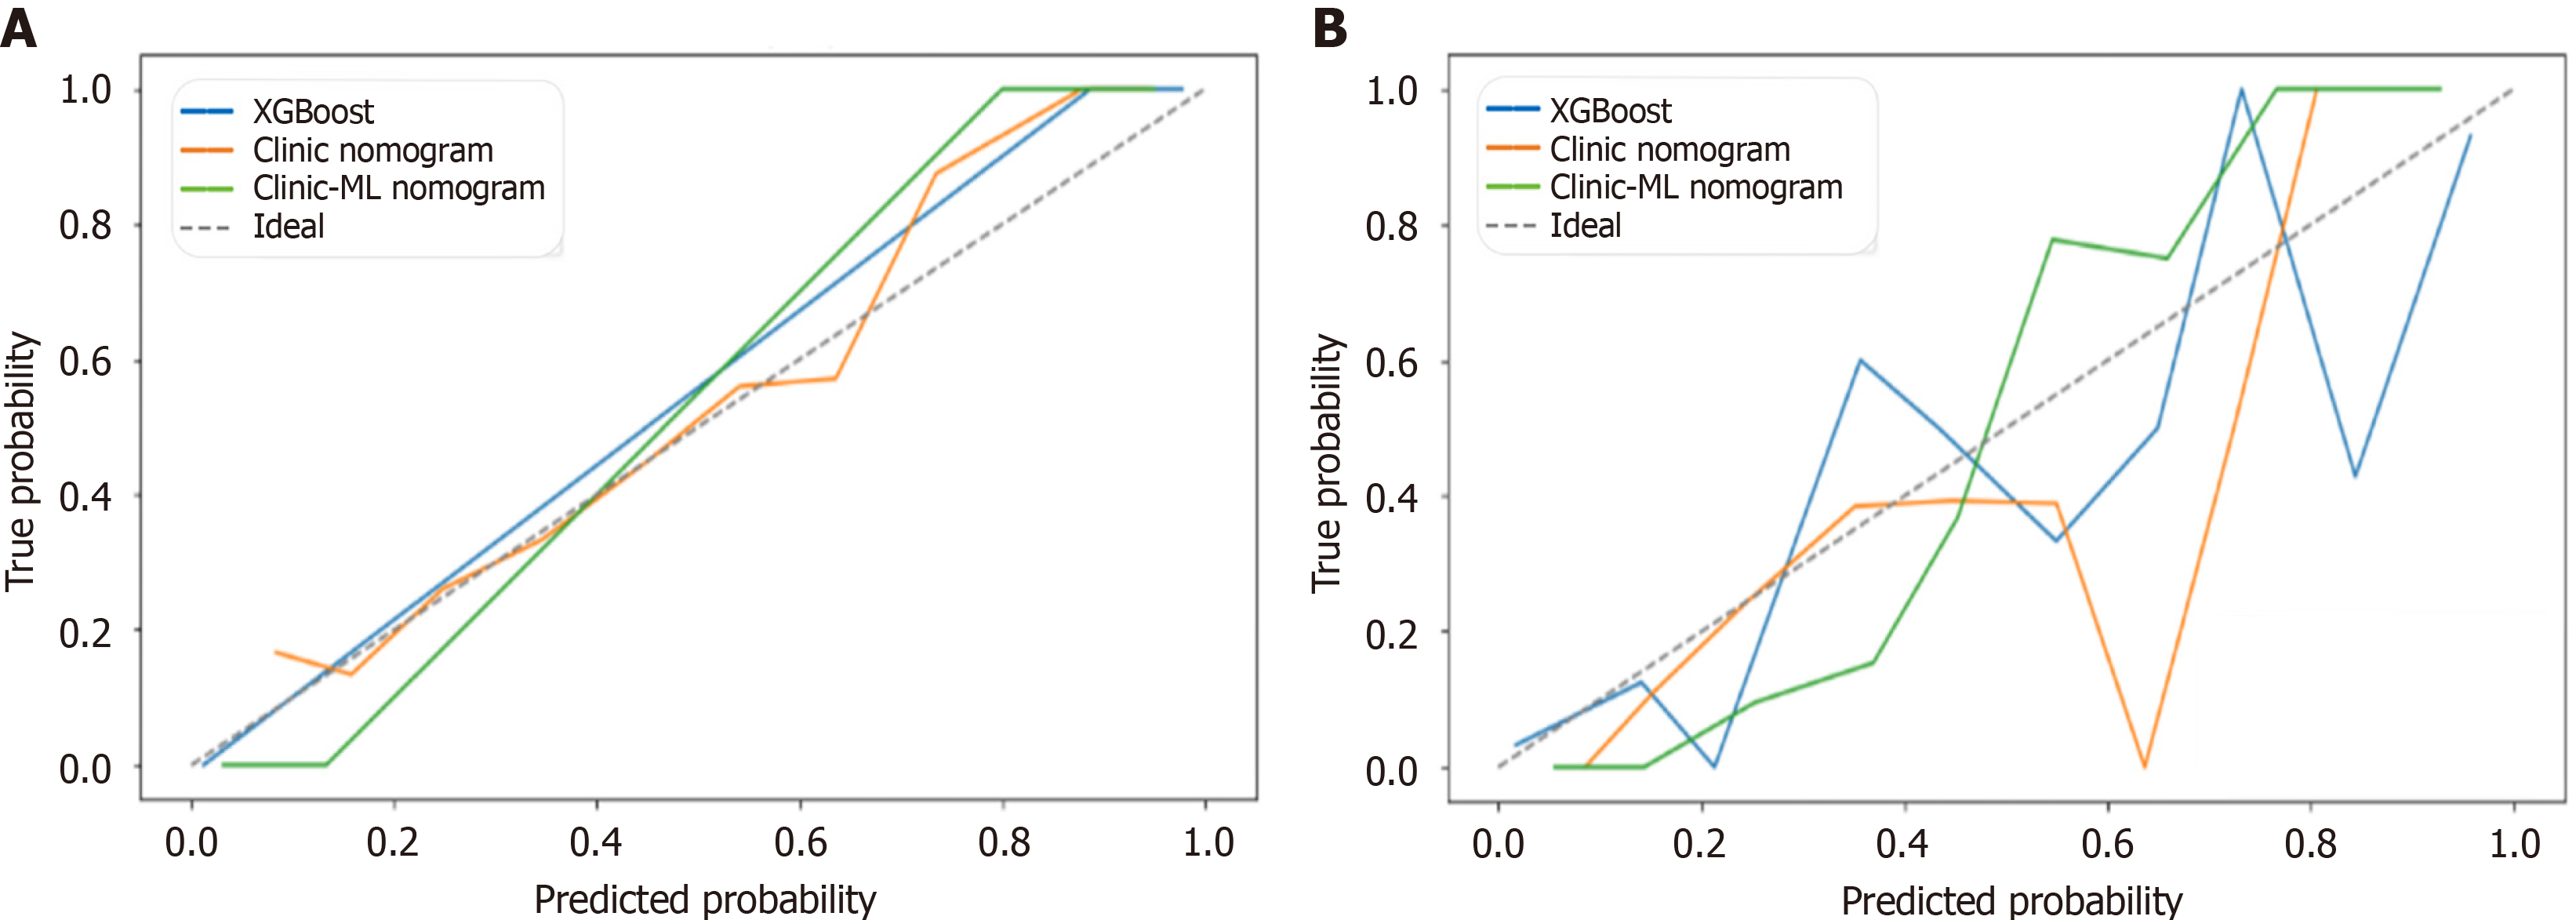
Figure 10 Calibration curves for extreme gradient boosting, clinic nomogram and clinic-machine learning nomogram.
A: Training set; B: Validation set. XGBoost: Extreme gradient boosting; ML: Machine learning.
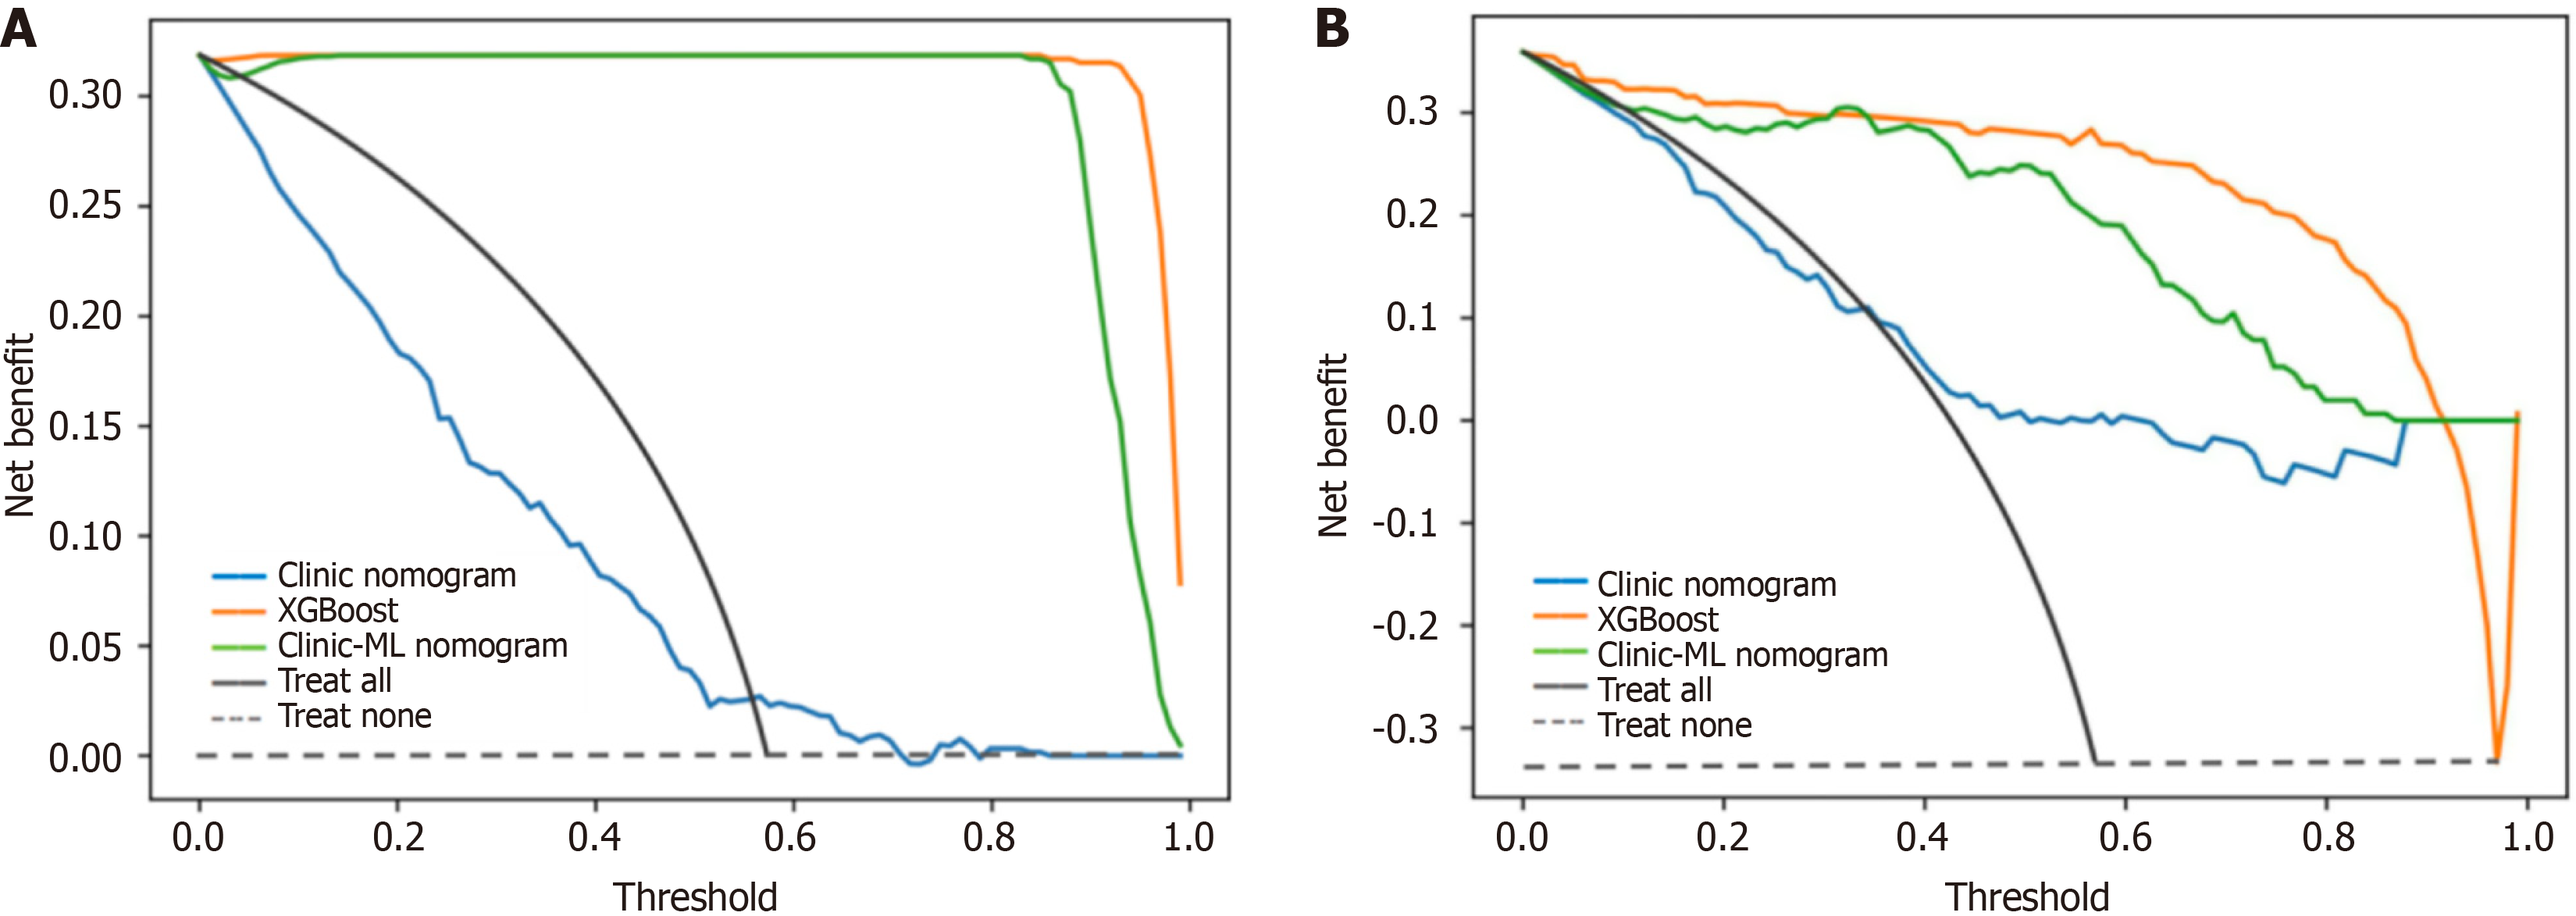
Figure 11 Decision curve analysis for extreme gradient boosting, clinic nomogram and clinic-machine learning nomogram.
A: Training set; B: Validation set. XGBoost: Extreme gradient boosting; ML: Machine learning.
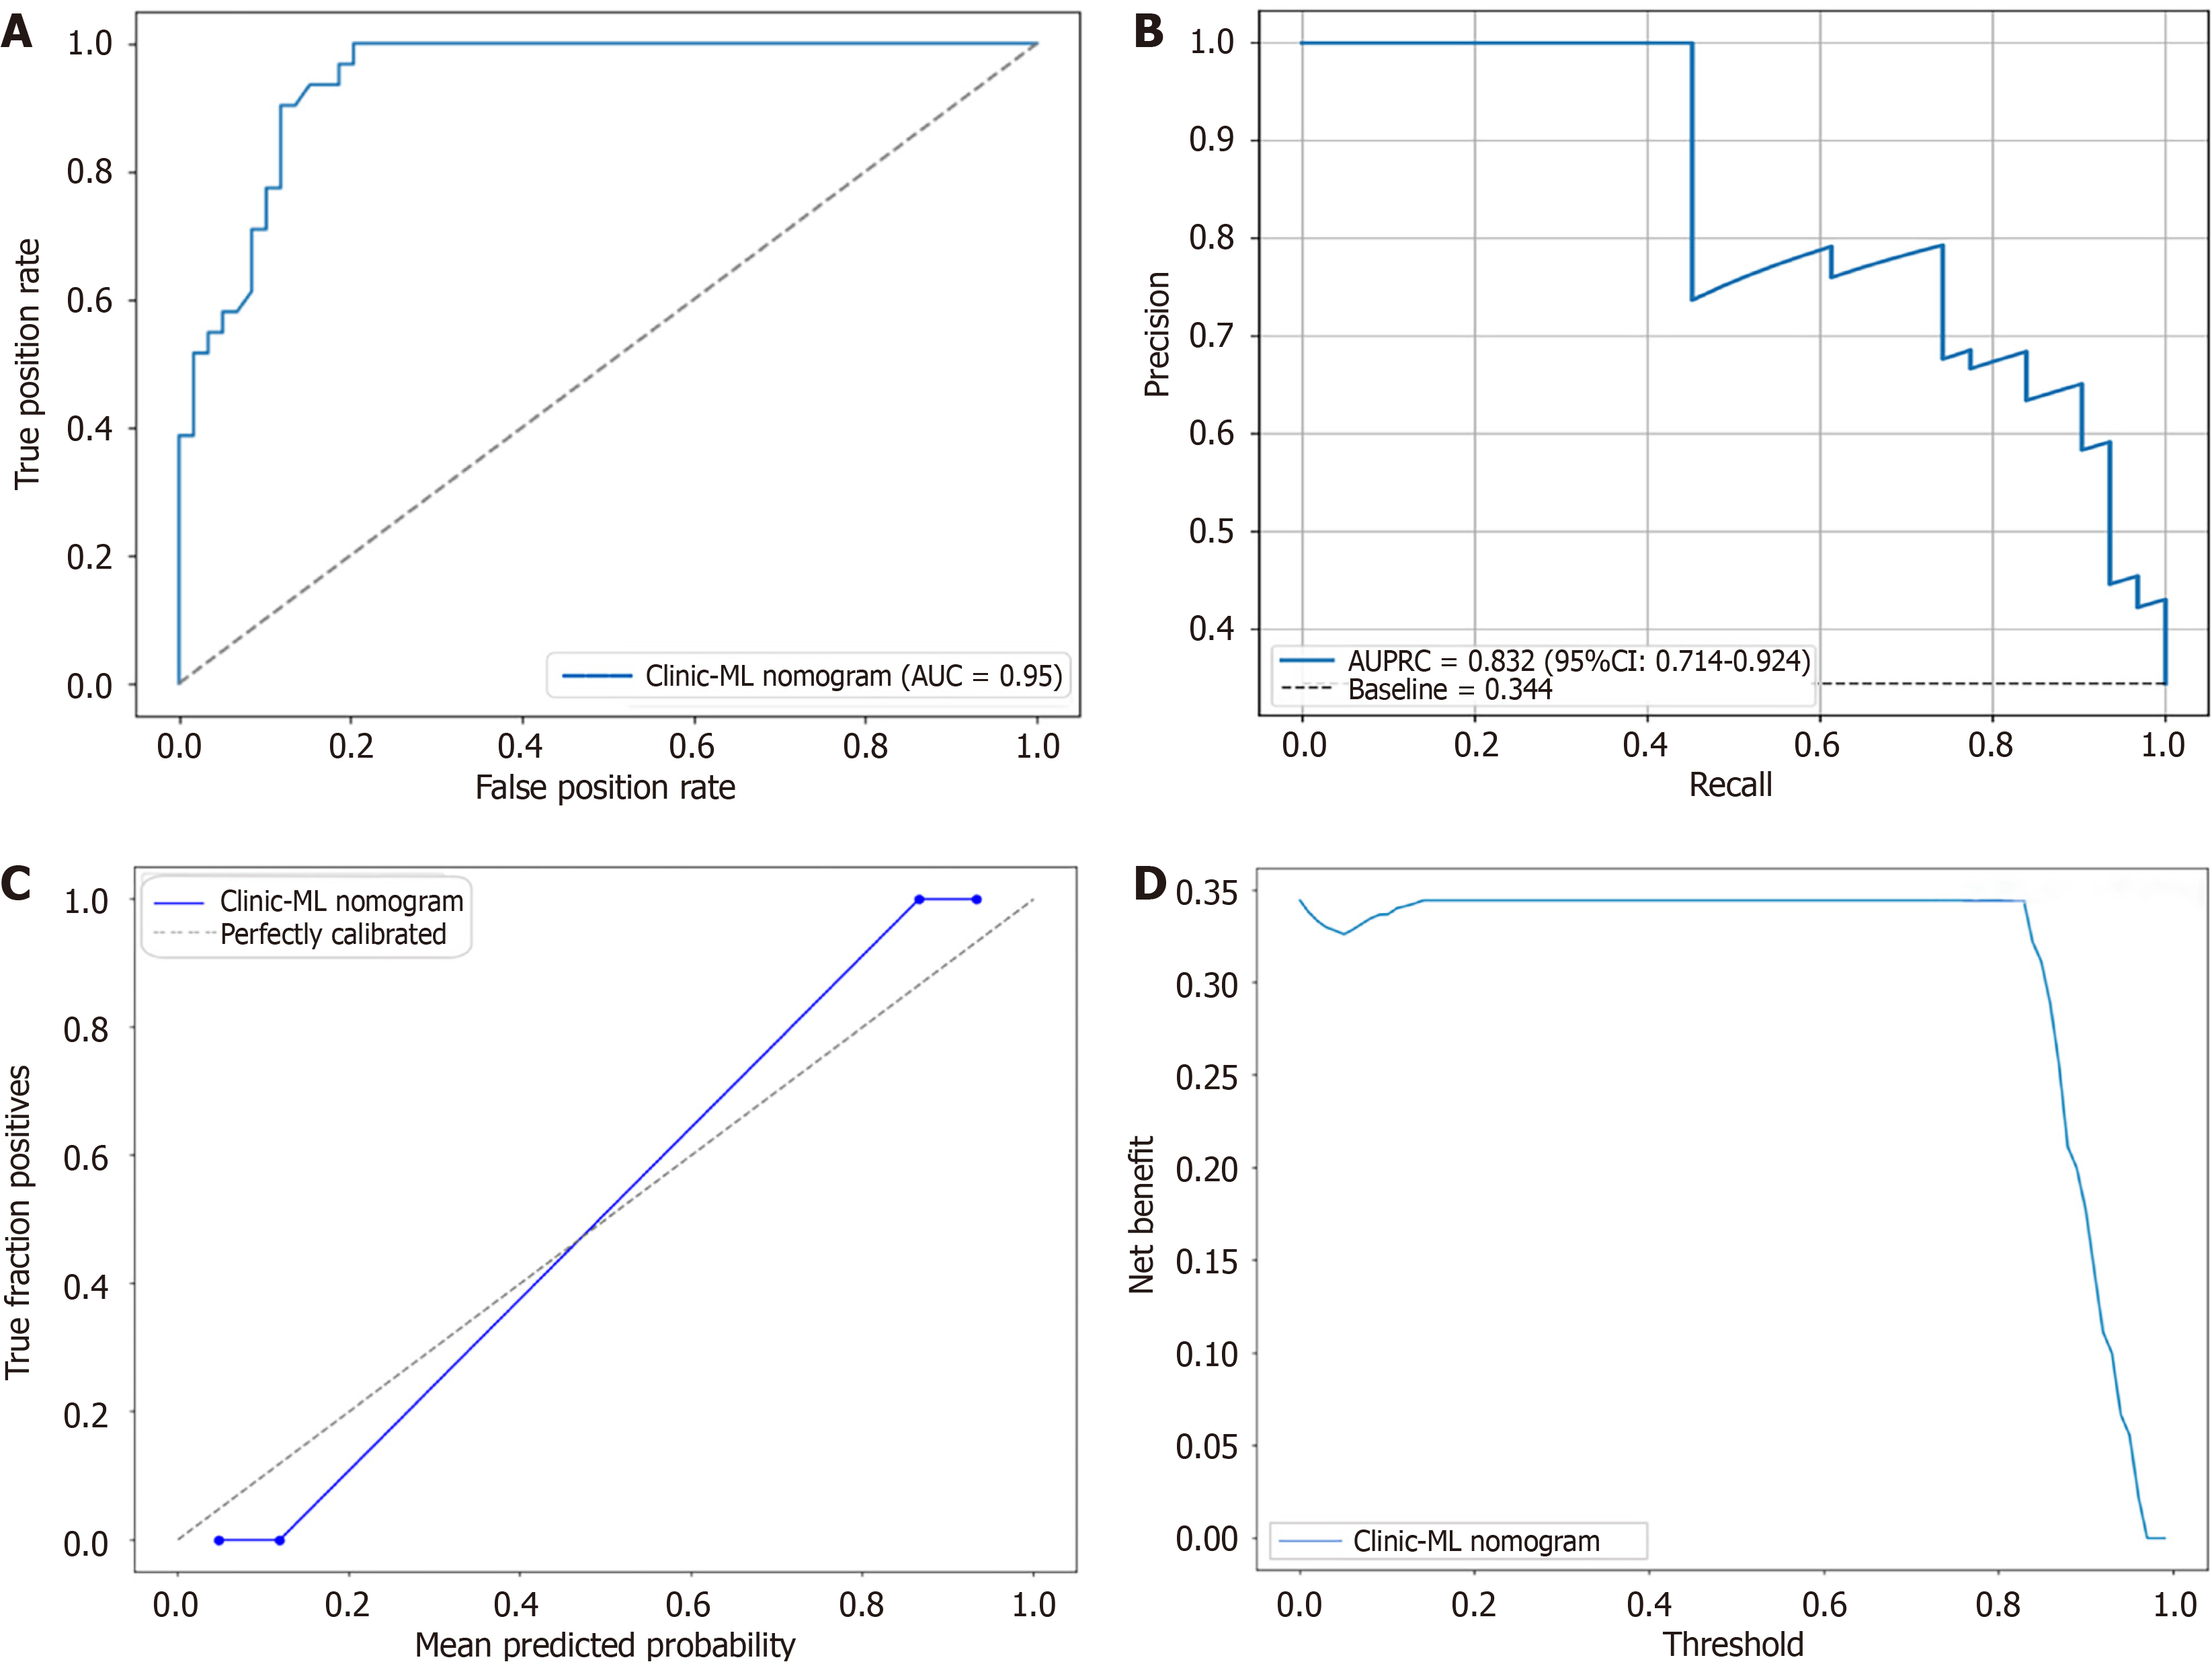
Figure 12 Receiver operating characteristic, precision-recall curve, calibration curves and decision curve analysis for the optimal prediction model clinic-machine learning nomogram (testing set).
A: Receiver operating characteristic curve; B: Precision-recall curve; C: Calibration curve; D: Decision curve analysis. AUC: Area under the curve; ML: Machine learning; AUPRC: Area under the precision-recall curve; CI: Confidence interval.
- Citation: Liu YM, Du YY, Song Y, Xiong HT, Yu HB, Li BH, Cai L, Ma SS, Gao J, Zhang HY, Fang RY, Cai R, Zheng HG. Predicting chemotherapy-induced myelosuppression in colorectal cancer: An interpretable, machine learning-based nomogram. World J Gastroenterol 2025; 31(42): 112180
- URL: https://www.wjgnet.com/1007-9327/full/v31/i42/112180.htm
- DOI: https://dx.doi.org/10.3748/wjg.v31.i42.112180


