Copyright
©The Author(s) 2025.
World J Gastroenterol. Nov 14, 2025; 31(42): 111706
Published online Nov 14, 2025. doi: 10.3748/wjg.v31.i42.111706
Published online Nov 14, 2025. doi: 10.3748/wjg.v31.i42.111706
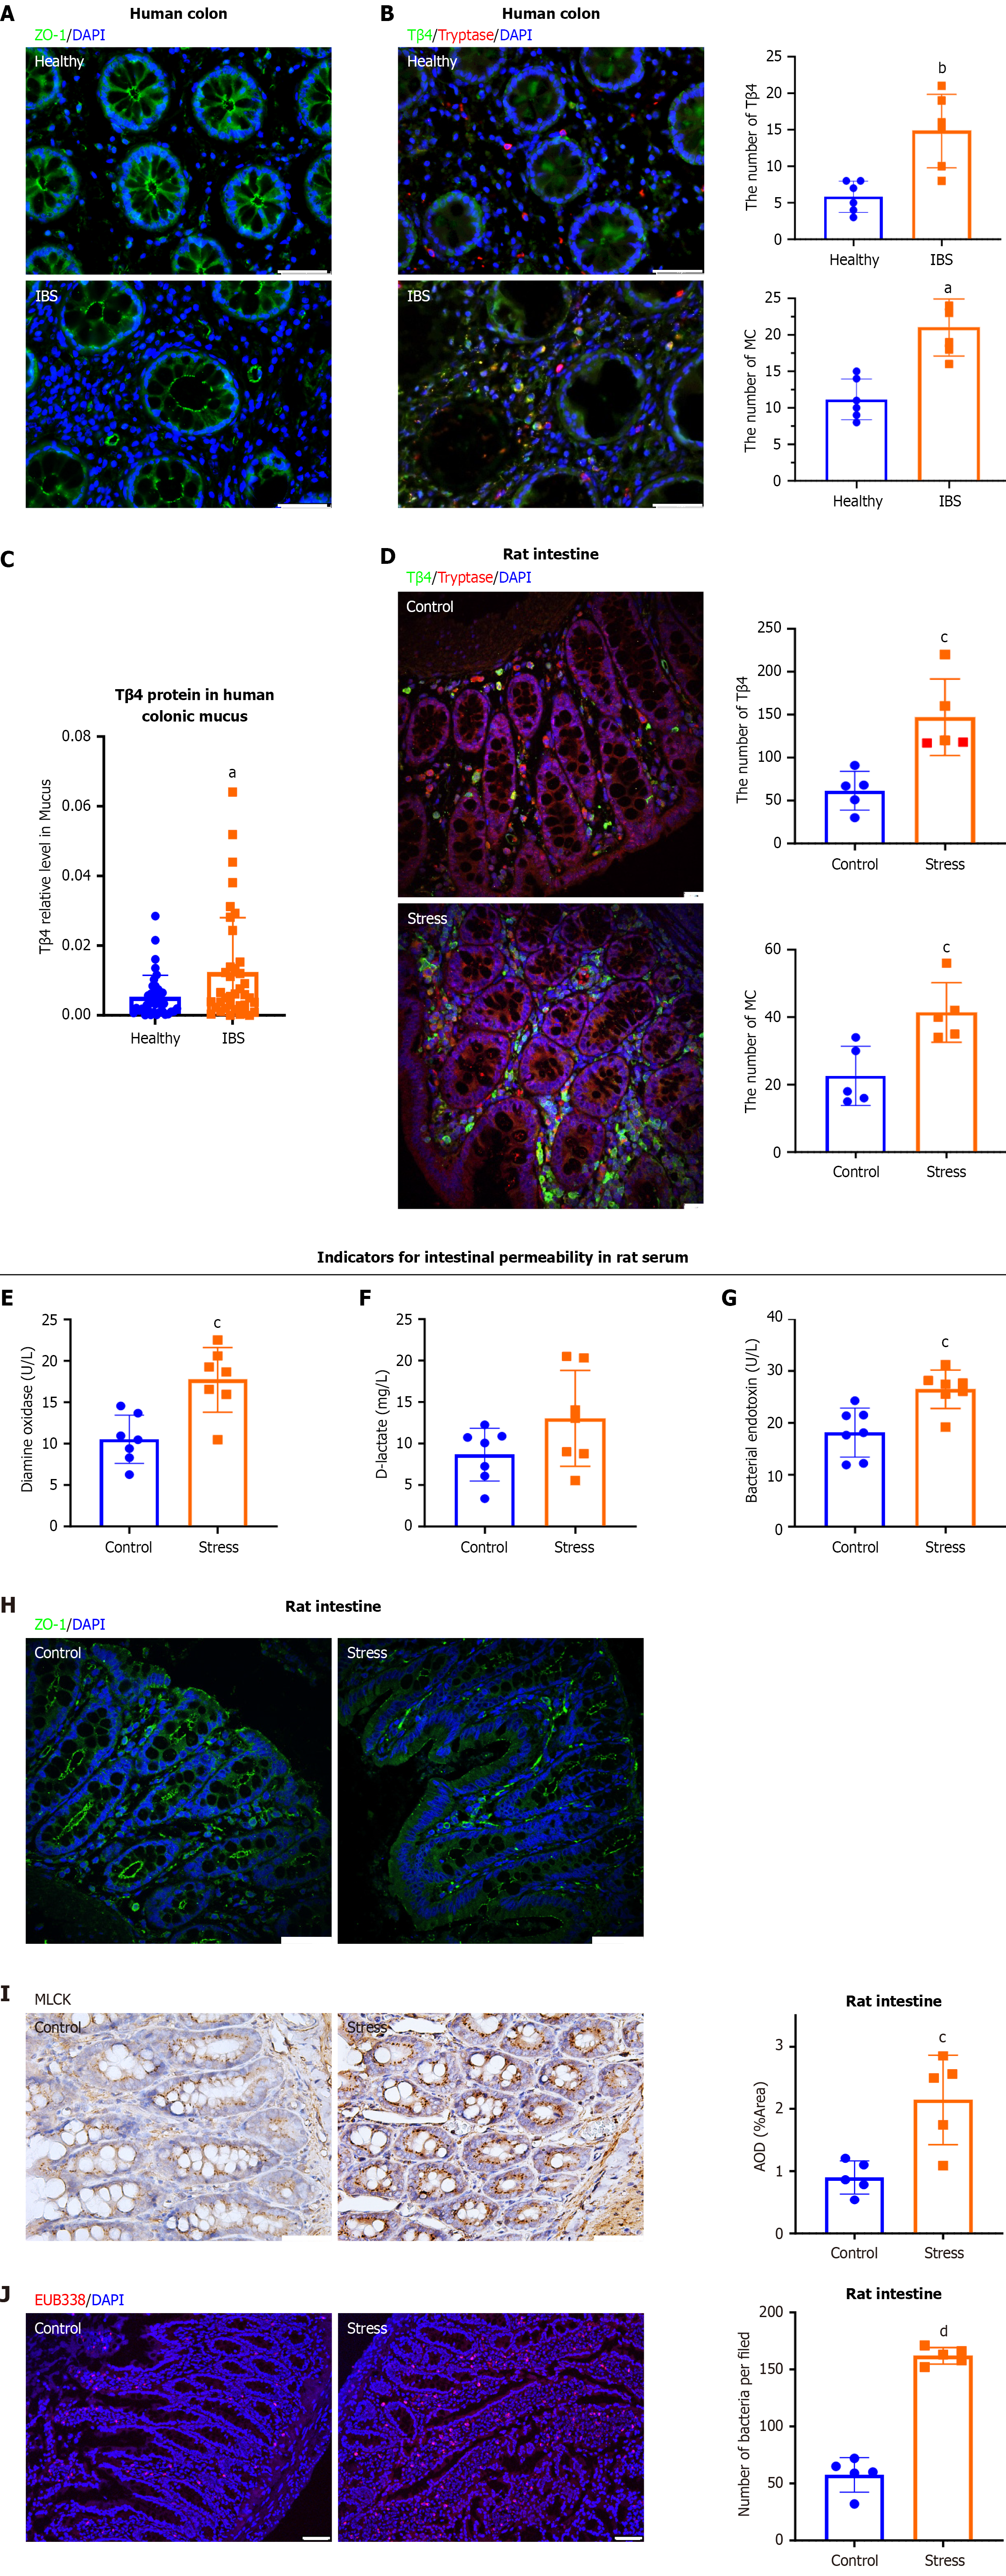
Figure 1 Enhanced thymosin β4 in irritable bowel syndrome is accompanied by intestinal epithelial barrier injury.
A: Immunofluorescence staining of zonulin 1 (ZO-1) in colons from healthy controls and irritable bowel syndrome (IBS) patients. Magnification: 400 ×, Scale bar, 50 μm. Results are representative of ZO-1 in control and IBS samples; B: Representative double immunofluorescence images of thymosin β4 (Tβ4) and Tryptase in healthy controls and IBS patients (left) and the quantification of the number of mast cells (MCs) or Tβ4 (right). Magnification: 400 ×, Scale bar, 50 μm. Bar, SD, aP < 0.001, bP < 0.01 vs the Healthy group; C: The levels of Tβ4 were quantified by ELISA in the colonic mucus. n = 38/group. aP < 0.001 vs the Healthy subjects group; D: Rats were exposed to psychological stress for 10 days to induce IBS. Representative intestinal immunofluorescence images of Tβ4 (green) and Tryptase (red) (left), and quantification of the number of MCs or Tβ4 (right). Scale bar, 50 μm. Bar, SD, cP < 0.01 vs the Control group; E-G: The level of (E) diamine oxidase, (F) D-lactate and (G) bacterial endotoxin in serum. Bar, SD, cP < 0.01 vs the Control group; H: Representative immunofluorescence images of ZO-1 (green) and DAPI (blue). Scale bar, 50 μm; I: Immunohistochemical images of myosin light chain kinase in colon. Scale bar, 100 μm. Bar, SD, cP < 0.01 vs the Control group; J: Representative FISH staining for bacterial infiltration using EUB338 probe (red) and DAPI (blue). Scale bar, 50 μm. dP < 0.001 vs Control group. ZO-1: Zonulin 1; Tβ4: Thymosin β4; IBS: Irritable bowel syndrome; MC: Mast cell; MLCK: Myosin light chain kinase.
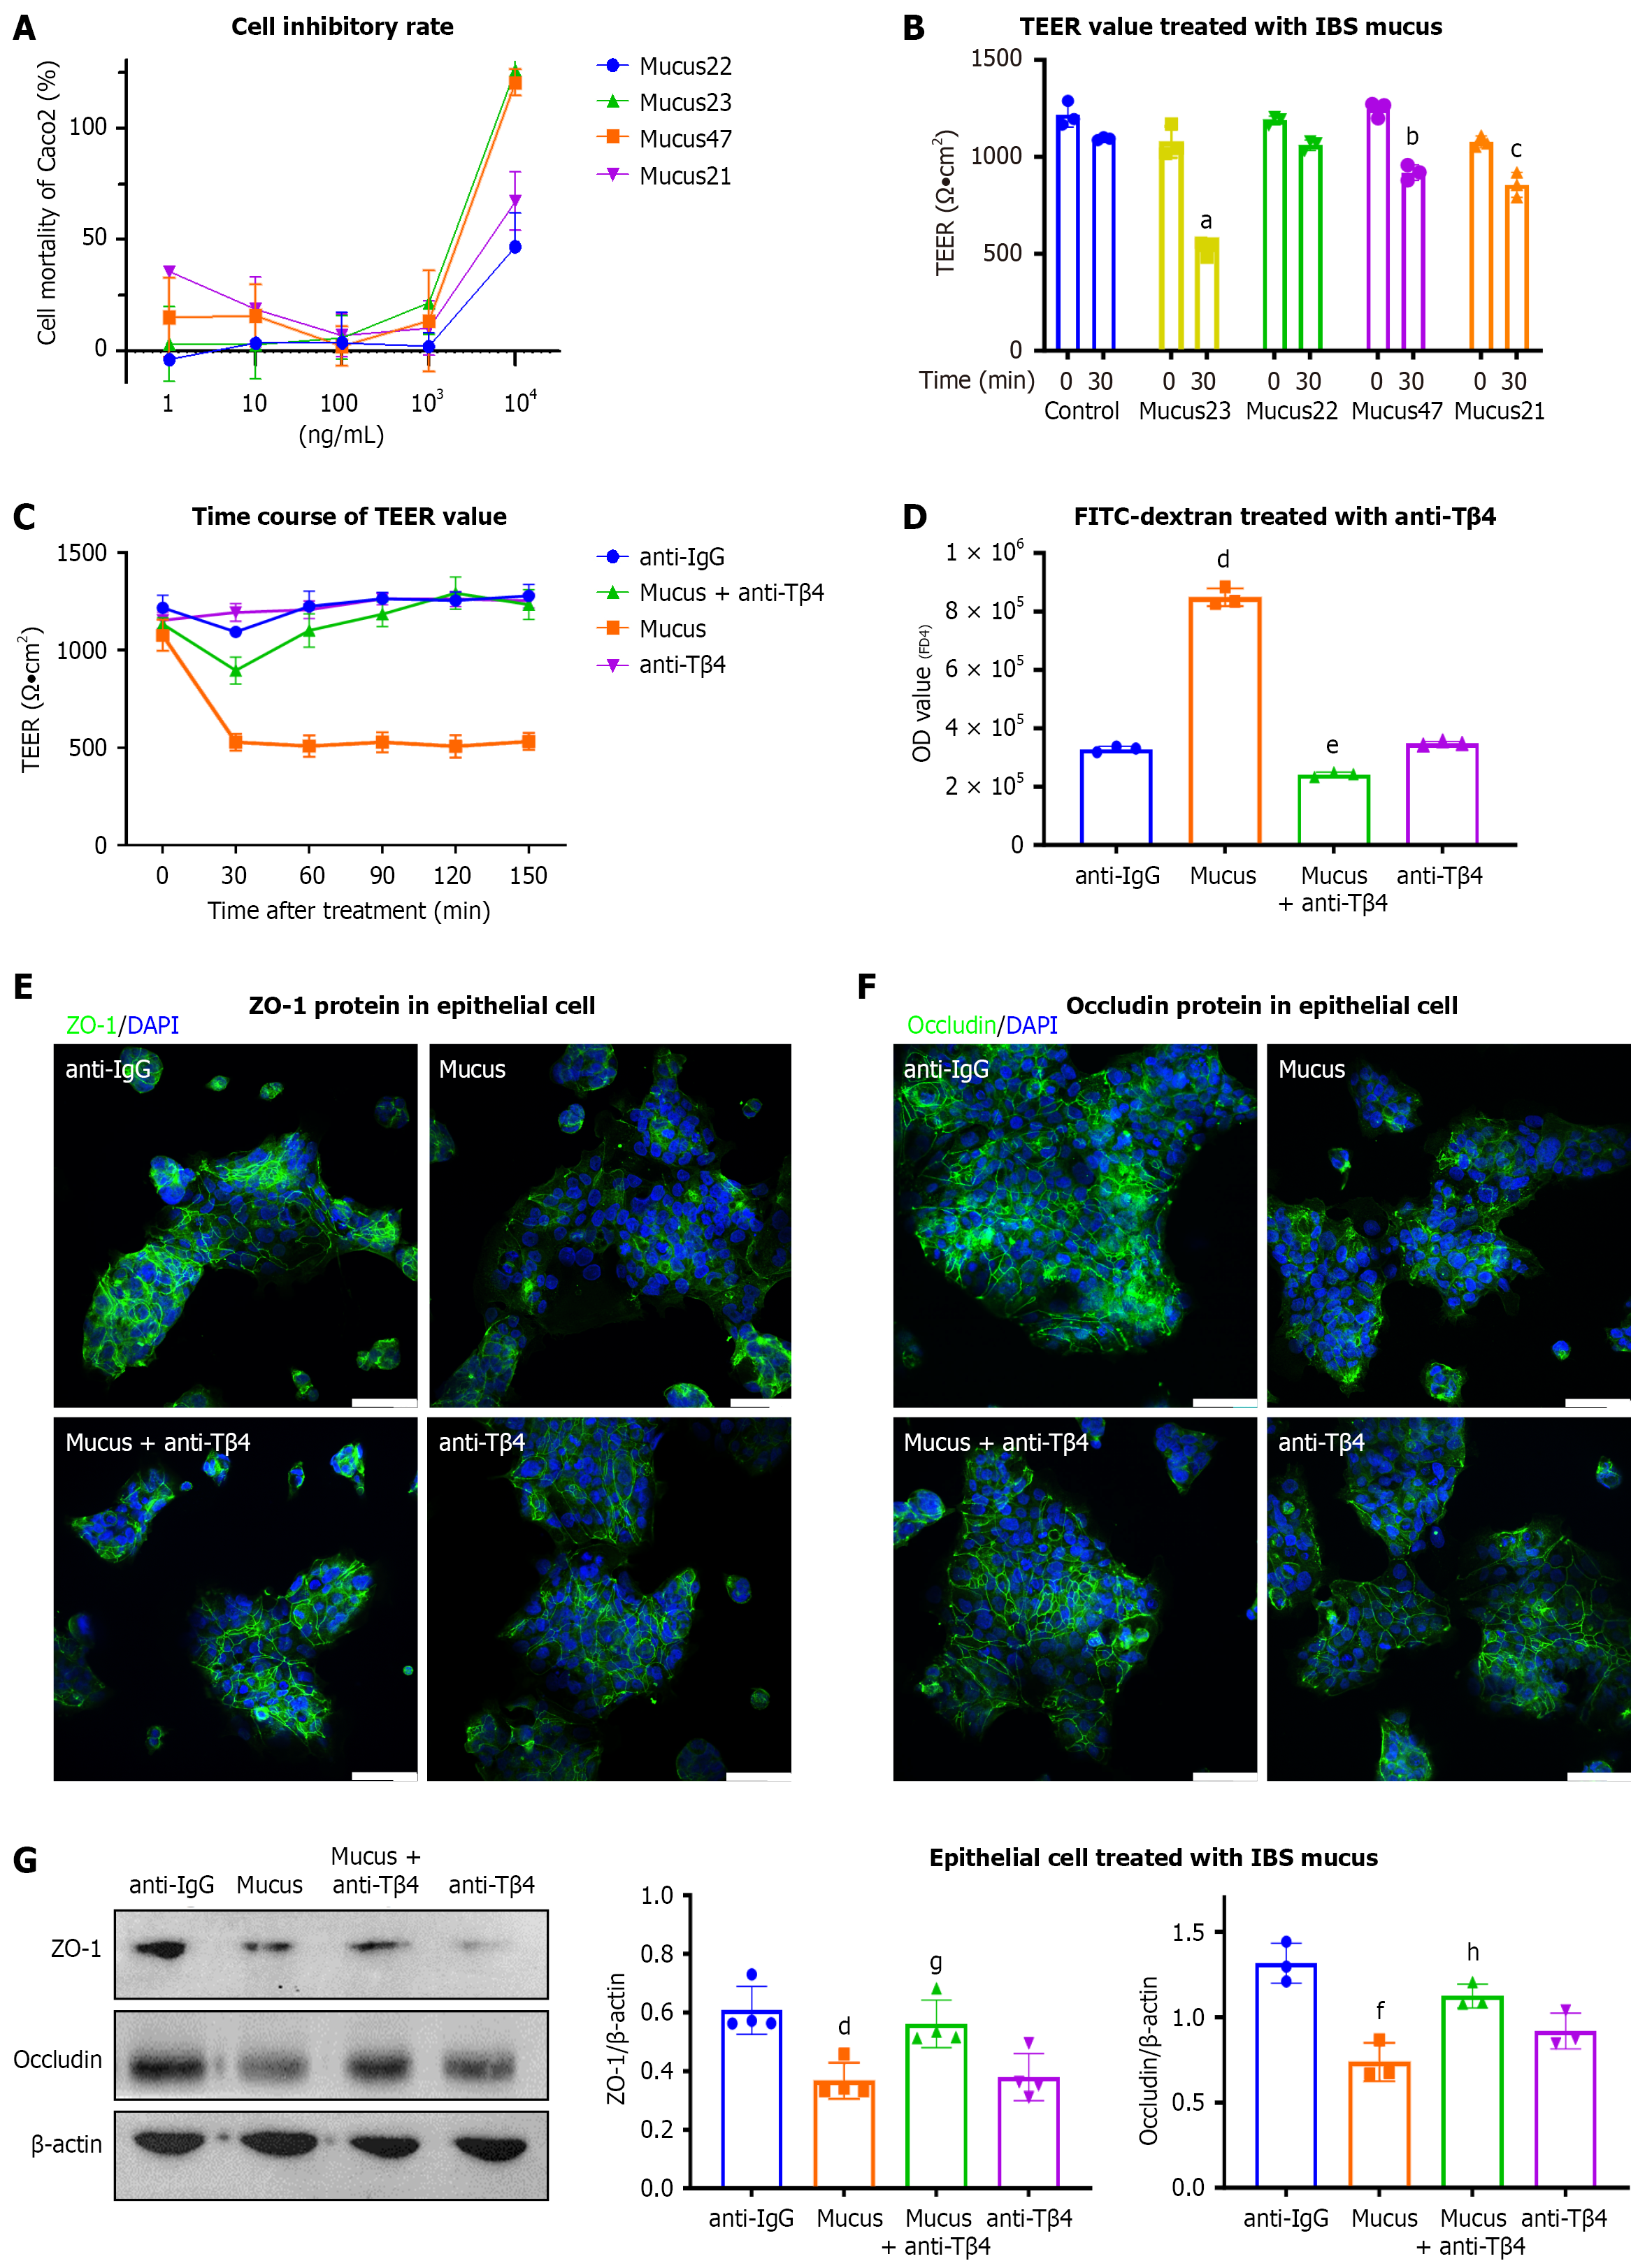
Figure 2 Thymosin β4 is a key factor in the disruption of the intestinal barrier by mucus in irritable bowel syndrome.
A and B: Caco2 cells were treated with irritable bowel syndrome mucus, the cell viability was detected by cell counting kit-8 assay (A), and the TEER value was analyzed after mucus treatment for 30 minutes at 1 μg/mL (B). Bar, SD, aP < 0.001 vs the Mucus23 group at 0 minute, bP < 0.001 vs the Mucus23 group at 0 minute, cP < 0.01 vs the Mucus21 group at 0 minute; C and D: Intestinal barrier permeability was assessed by (C) TEER and (D) FD4 assays between mucus and thymosin β4 antibody (anti-Tβ4) groups. Anti-IgG was applied as a control. (n = 3) Bar, SD, dP < 0.001 vs the anti-IgG group, eP < 0.001 vs the Mucus group; E-G: Respective immunofluorescence images of (E) zonulin 1 and (F) Occludin, and (G) western blots in Caco2 cells treated with mucus, mucus + anti-Tβ4, anti-Tβ4 or anti-IgG. Scale bar, 50 μm. The data are presented from at least three independent experiments run in triplicate. Bar, SD, dP < 0.001 vs the anti-IgG group, fP < 0.01 vs the anti-IgG group, gP < 0.01 vs the Mucus group, hP < 0.05 vs the Mucus group. ZO-1: Zonulin 1; Tβ4: Thymosin β4; IBS: Irritable bowel syndrome.
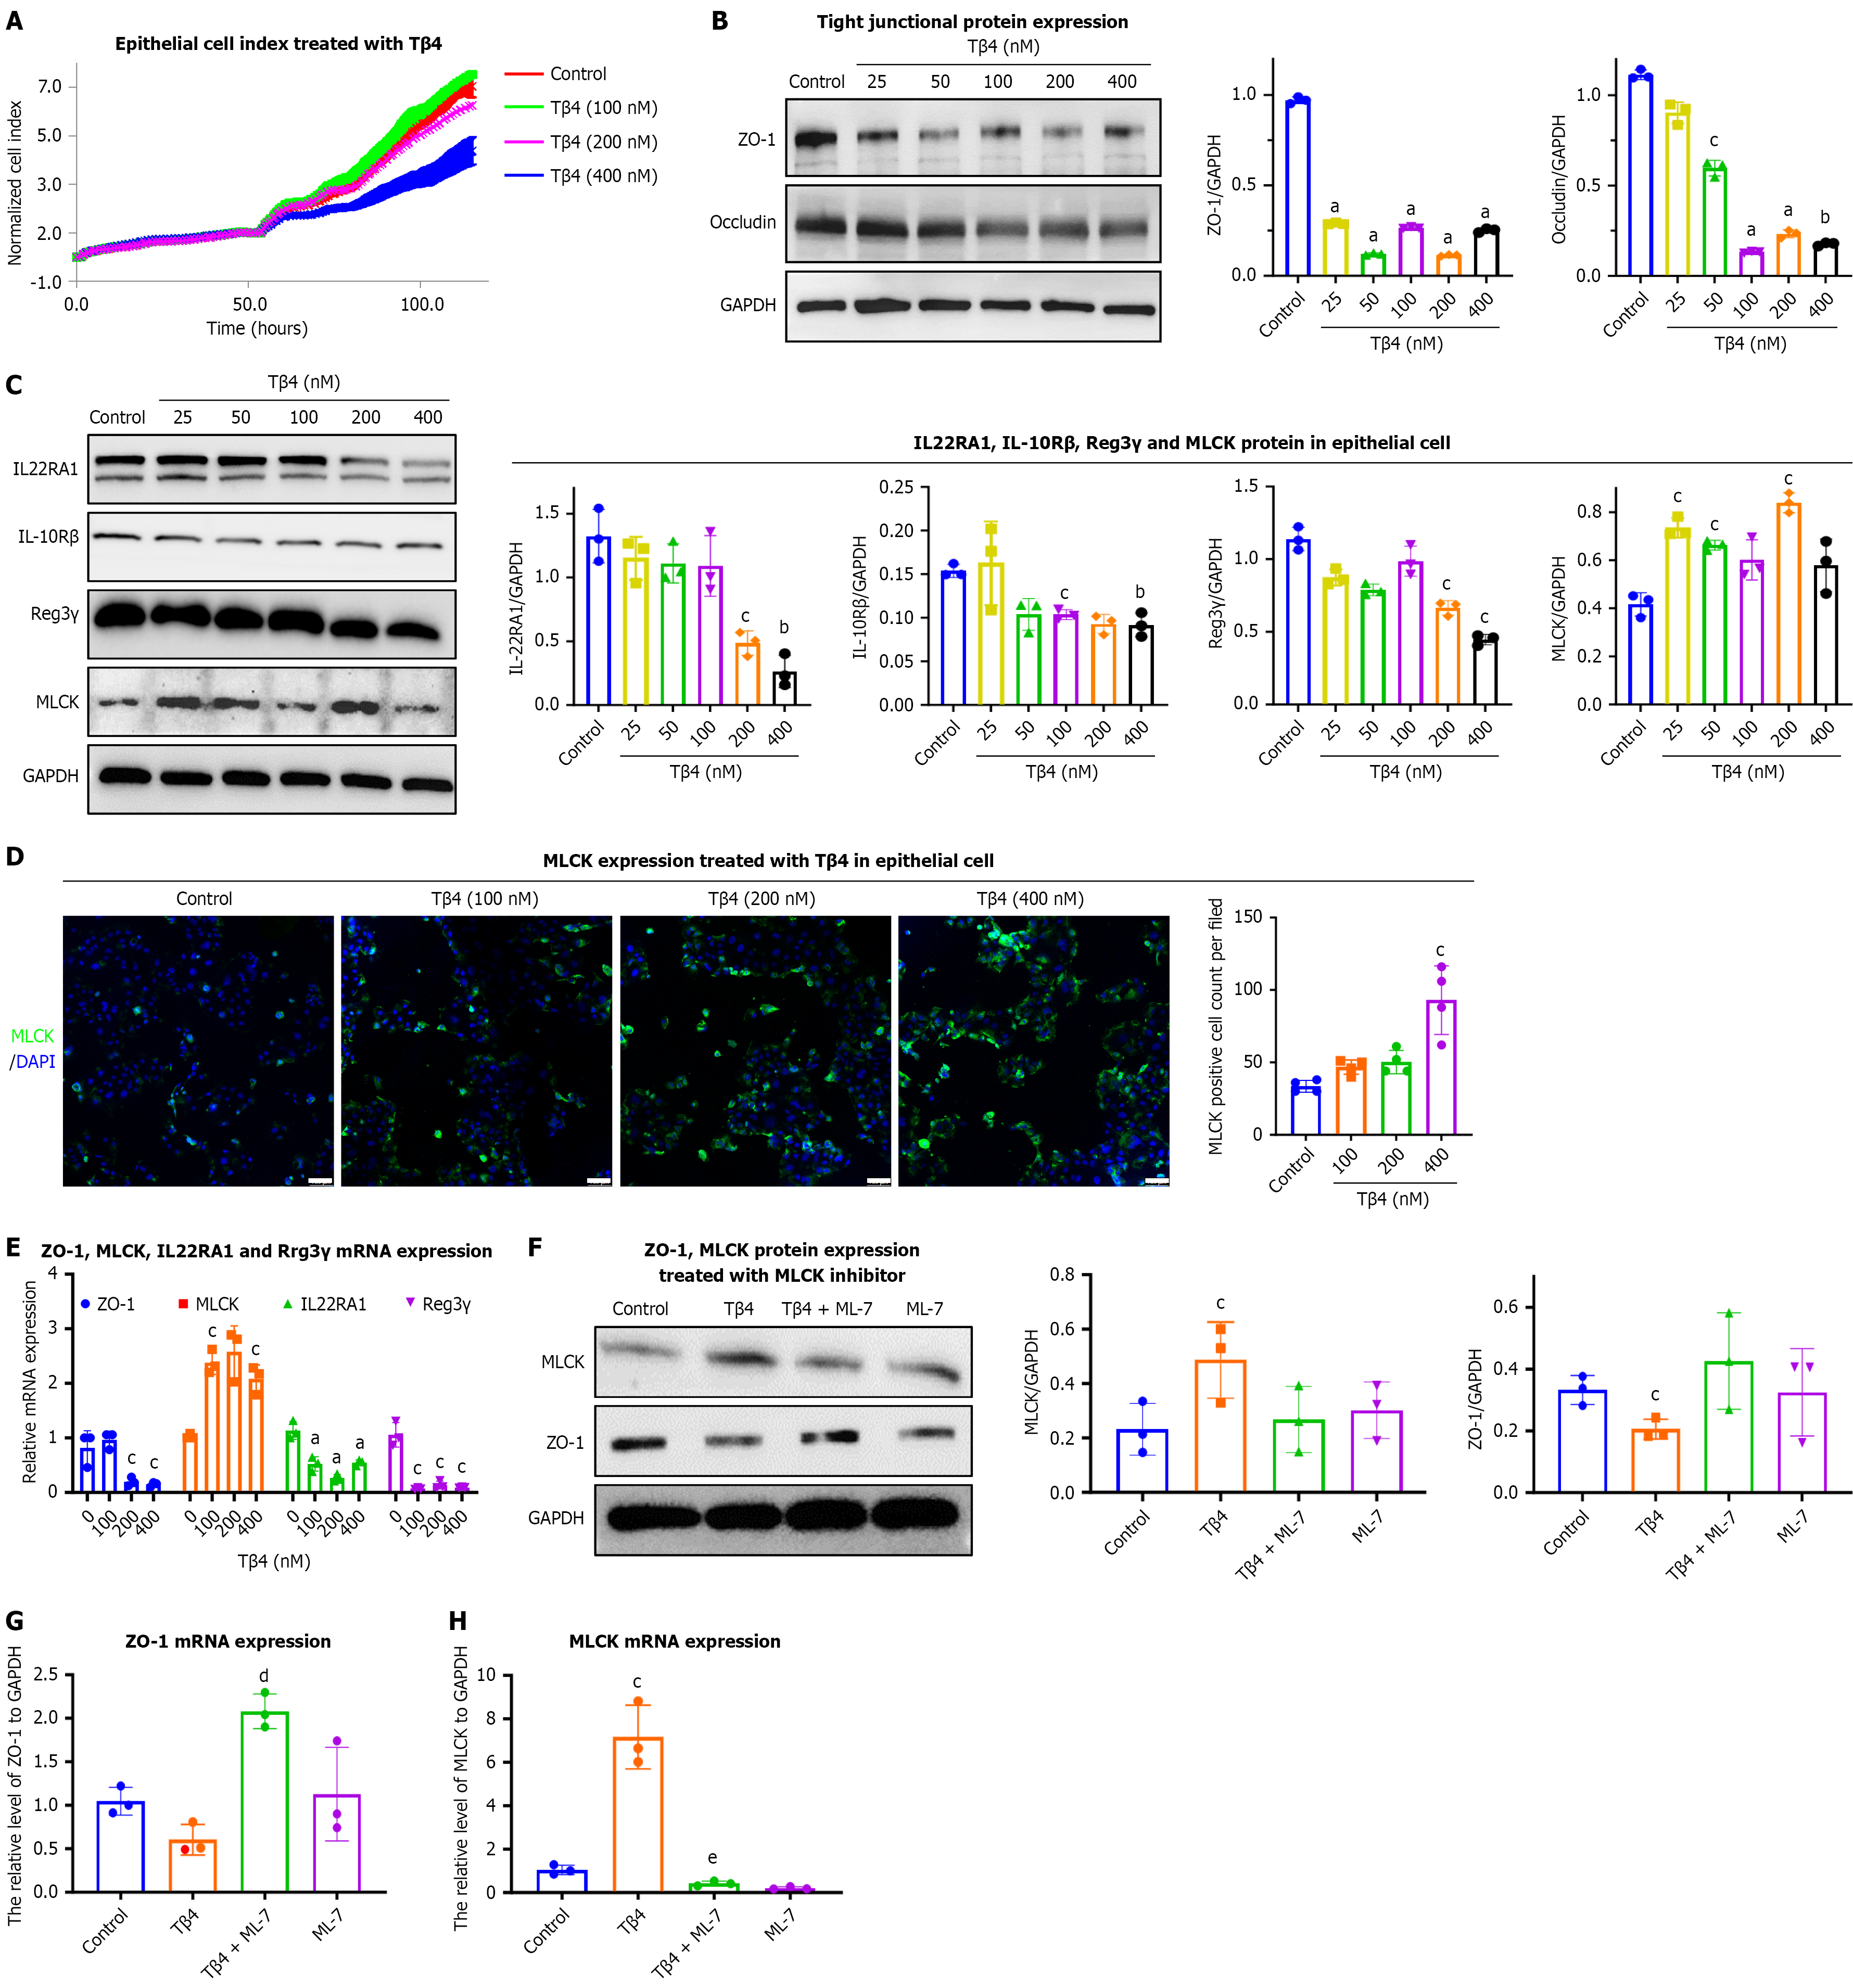
Figure 3 Thymosin β4 is sufficient to drive intestinal permeability and dysbiosis in vitro.
A: The epithelial barrier function of Caco2 was measured after treatment with thymosin β4 (Tβ4) (100 nmol/L, 200 nmol/L, 400 nmol/L). Each line represents the mean of 3 wells per condition. The cell index serves as a real-time value reflecting changes in barrier properties; B and C: Caco2 cells were treated with Tβ4 (25 nmol/L, 50 nmol/L, 100 nmol/L, 200 nmol/L, 400 nmol/L) for 24 hours, and the protein levels of (B) zonulin 1 (ZO-1), Occludin, (C) interleukin 22 receptor A1 (IL22RA1), IL-10Rβ, Reg3γ, and myosin light chain kinase (MLCK) were detected by western blot assay. Bar, SD, aP < 0.001, bP < 0.01, cP < 0.05 vs the Control group; D: Representative immunofluorescence images of MLCK (green) and DAPI (blue). Scale bar, 100 μm. Bar, SD, cP < 0.05 vs the Control group; E: After treatment with Tβ4 (100 nmol/L, 200 nmol/L, 400 nmol/L) for 24 hours, the mRNA levels of ZO-1, IL22RA1, MLCK, and Reg3γ were evaluated by qPCR. Bar, SD, aP < 0.001, cP < 0.05 vs the Control group (0 nmol/L); F: Cells were treated with Tβ4 (200 nmol/L) for 24 h in MLCK inhibitor (ML-7)-induced Caco2 (prepared 30 minutes in advance), and then the protein levels of MLCK and ZO-1 were evaluated by western blotting; G and H: After treatment with ML-7 in Tβ4-treated Caco2, the mRNA level of (G) ZO-1 and (H) MLCK were evaluated by qPCR. Bar, SD, cP < 0.05 vs the Control group, dP < 0.001 vs the Tβ4 group, eP < 0.05 vs the Tβ4 group. MLCK: Myosin light chain kinase; ZO-1: Zonulin 1; Tβ4: Thymosin β4; IL: Interleukin; IL-10R: Interleukin-10 receptor.
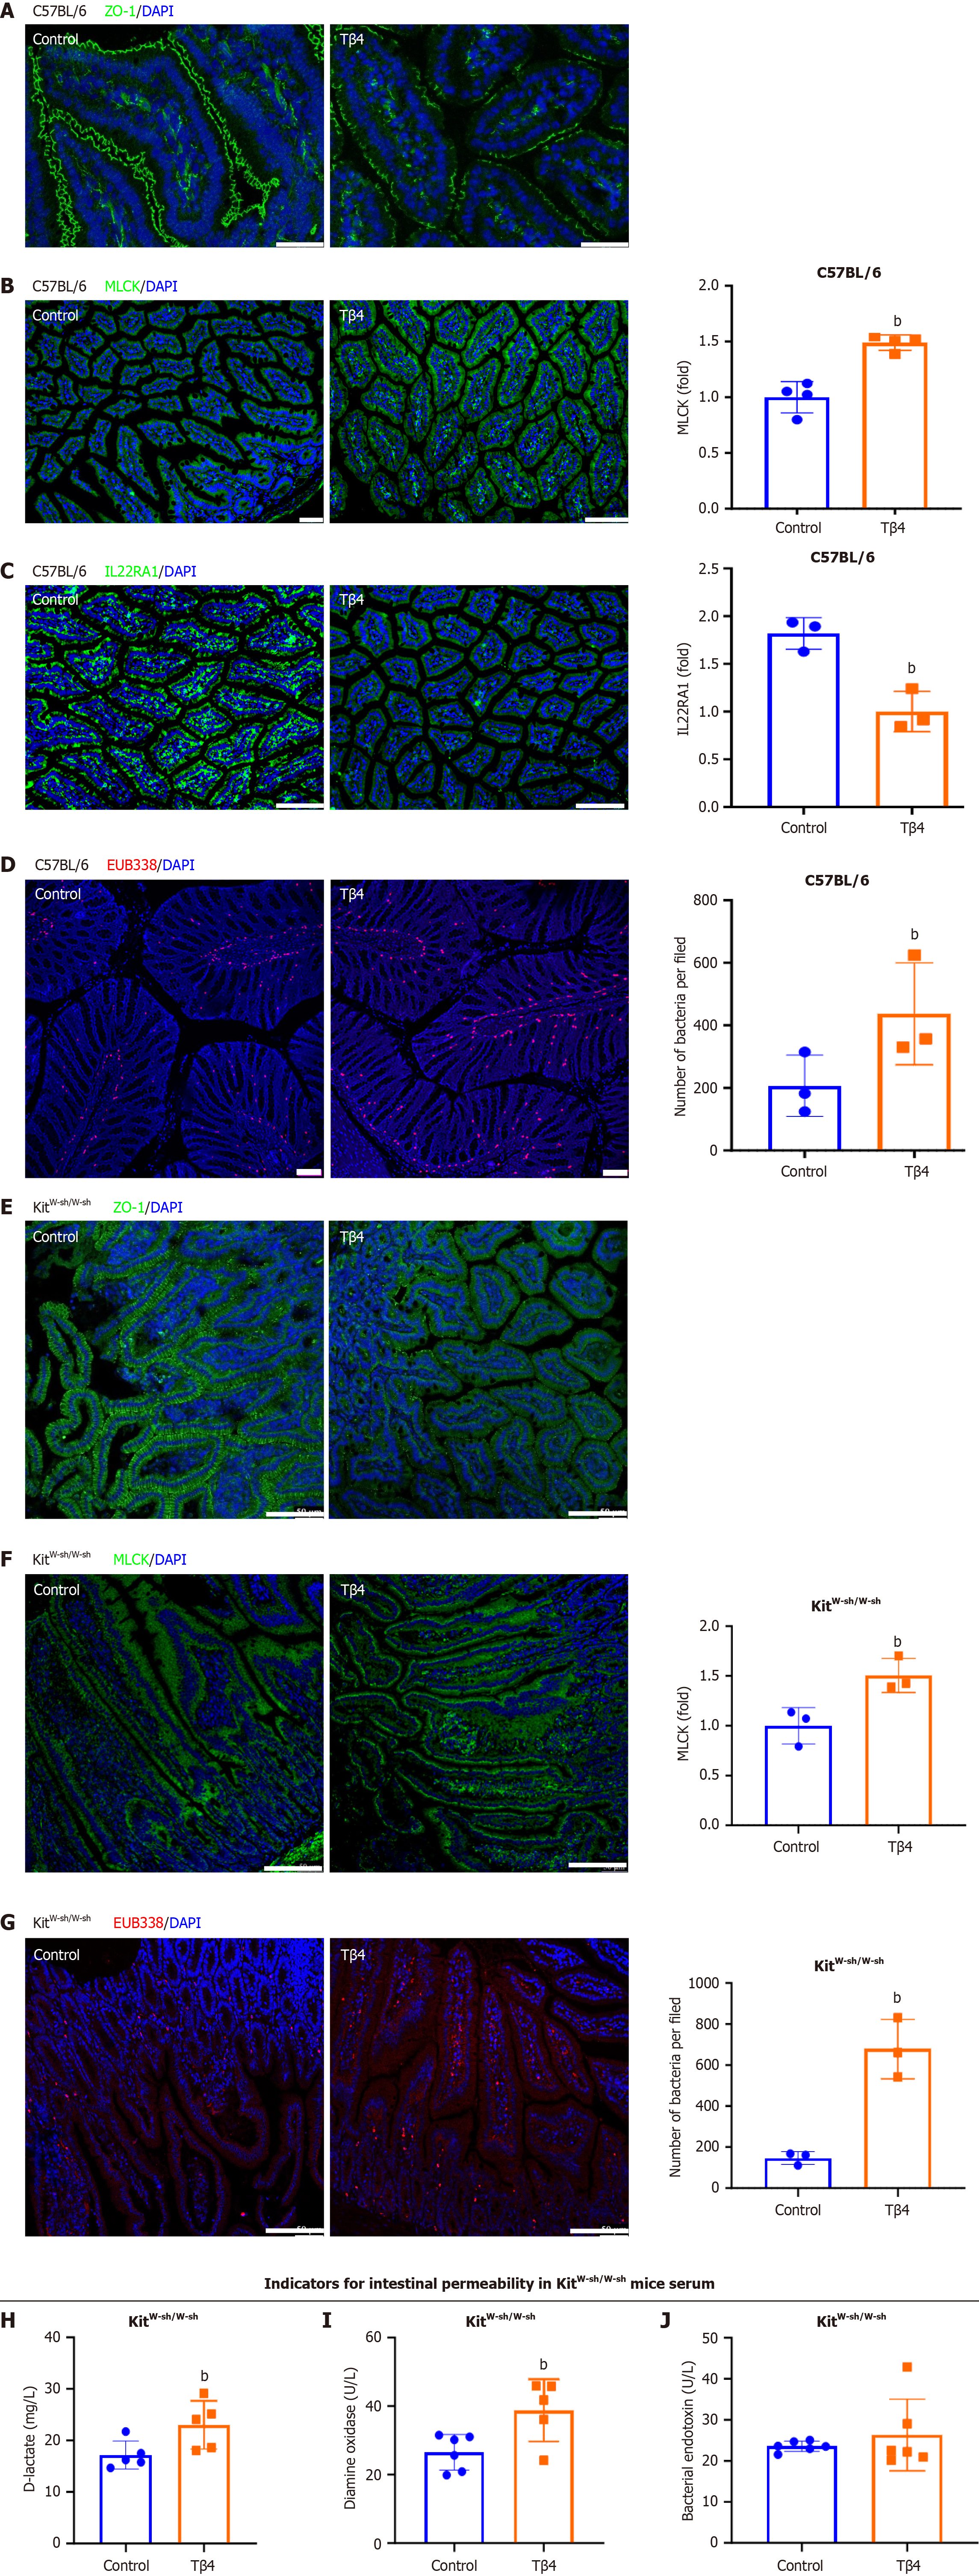
Figure 4 Thymosin β4 drives intestinal permeability increase in vivo.
Thymosin β4 (Tβ4) (3 mg/kg) was intraperitoneally injected into C57BL/6 mice every day for a week. A-C: Representative intestinal immunofluorescence images of (A) zonulin 1 (ZO-1) (Scale bar, 50 μm), (B) myosin light chain kinase (MLCK) and (C) IL22RA1. Scale bar, 100 μm; D: Representative FISH staining for bacterial infiltration using EUB338 probe (red) and DAPI (blue). Scale bar, 100 μm. Tβ4 (3 mg/kg) was intraperitoneally injected into KitW-sh/W-sh mice every day for a week; E and F: Representative intestinal immunofluorescence images of (E) ZO-1, Scale bar, 100 μm, and (F) MLCK, Scale bar, 100 μm; G: Representative FISH staining for bacterial infiltration using EUB338 probe (red) and DAPI (blue). Scale bar, 100 μm; H-J: The level of (H) diamine oxidase, (I) D-lactate and (J) bacterial endotoxin in serum. Bar, SD, bP < 0.01 vs the Control group. MLCK: Myosin light chain kinase; ZO-1: Zonulin 1; Tβ4: Thymosin β4.
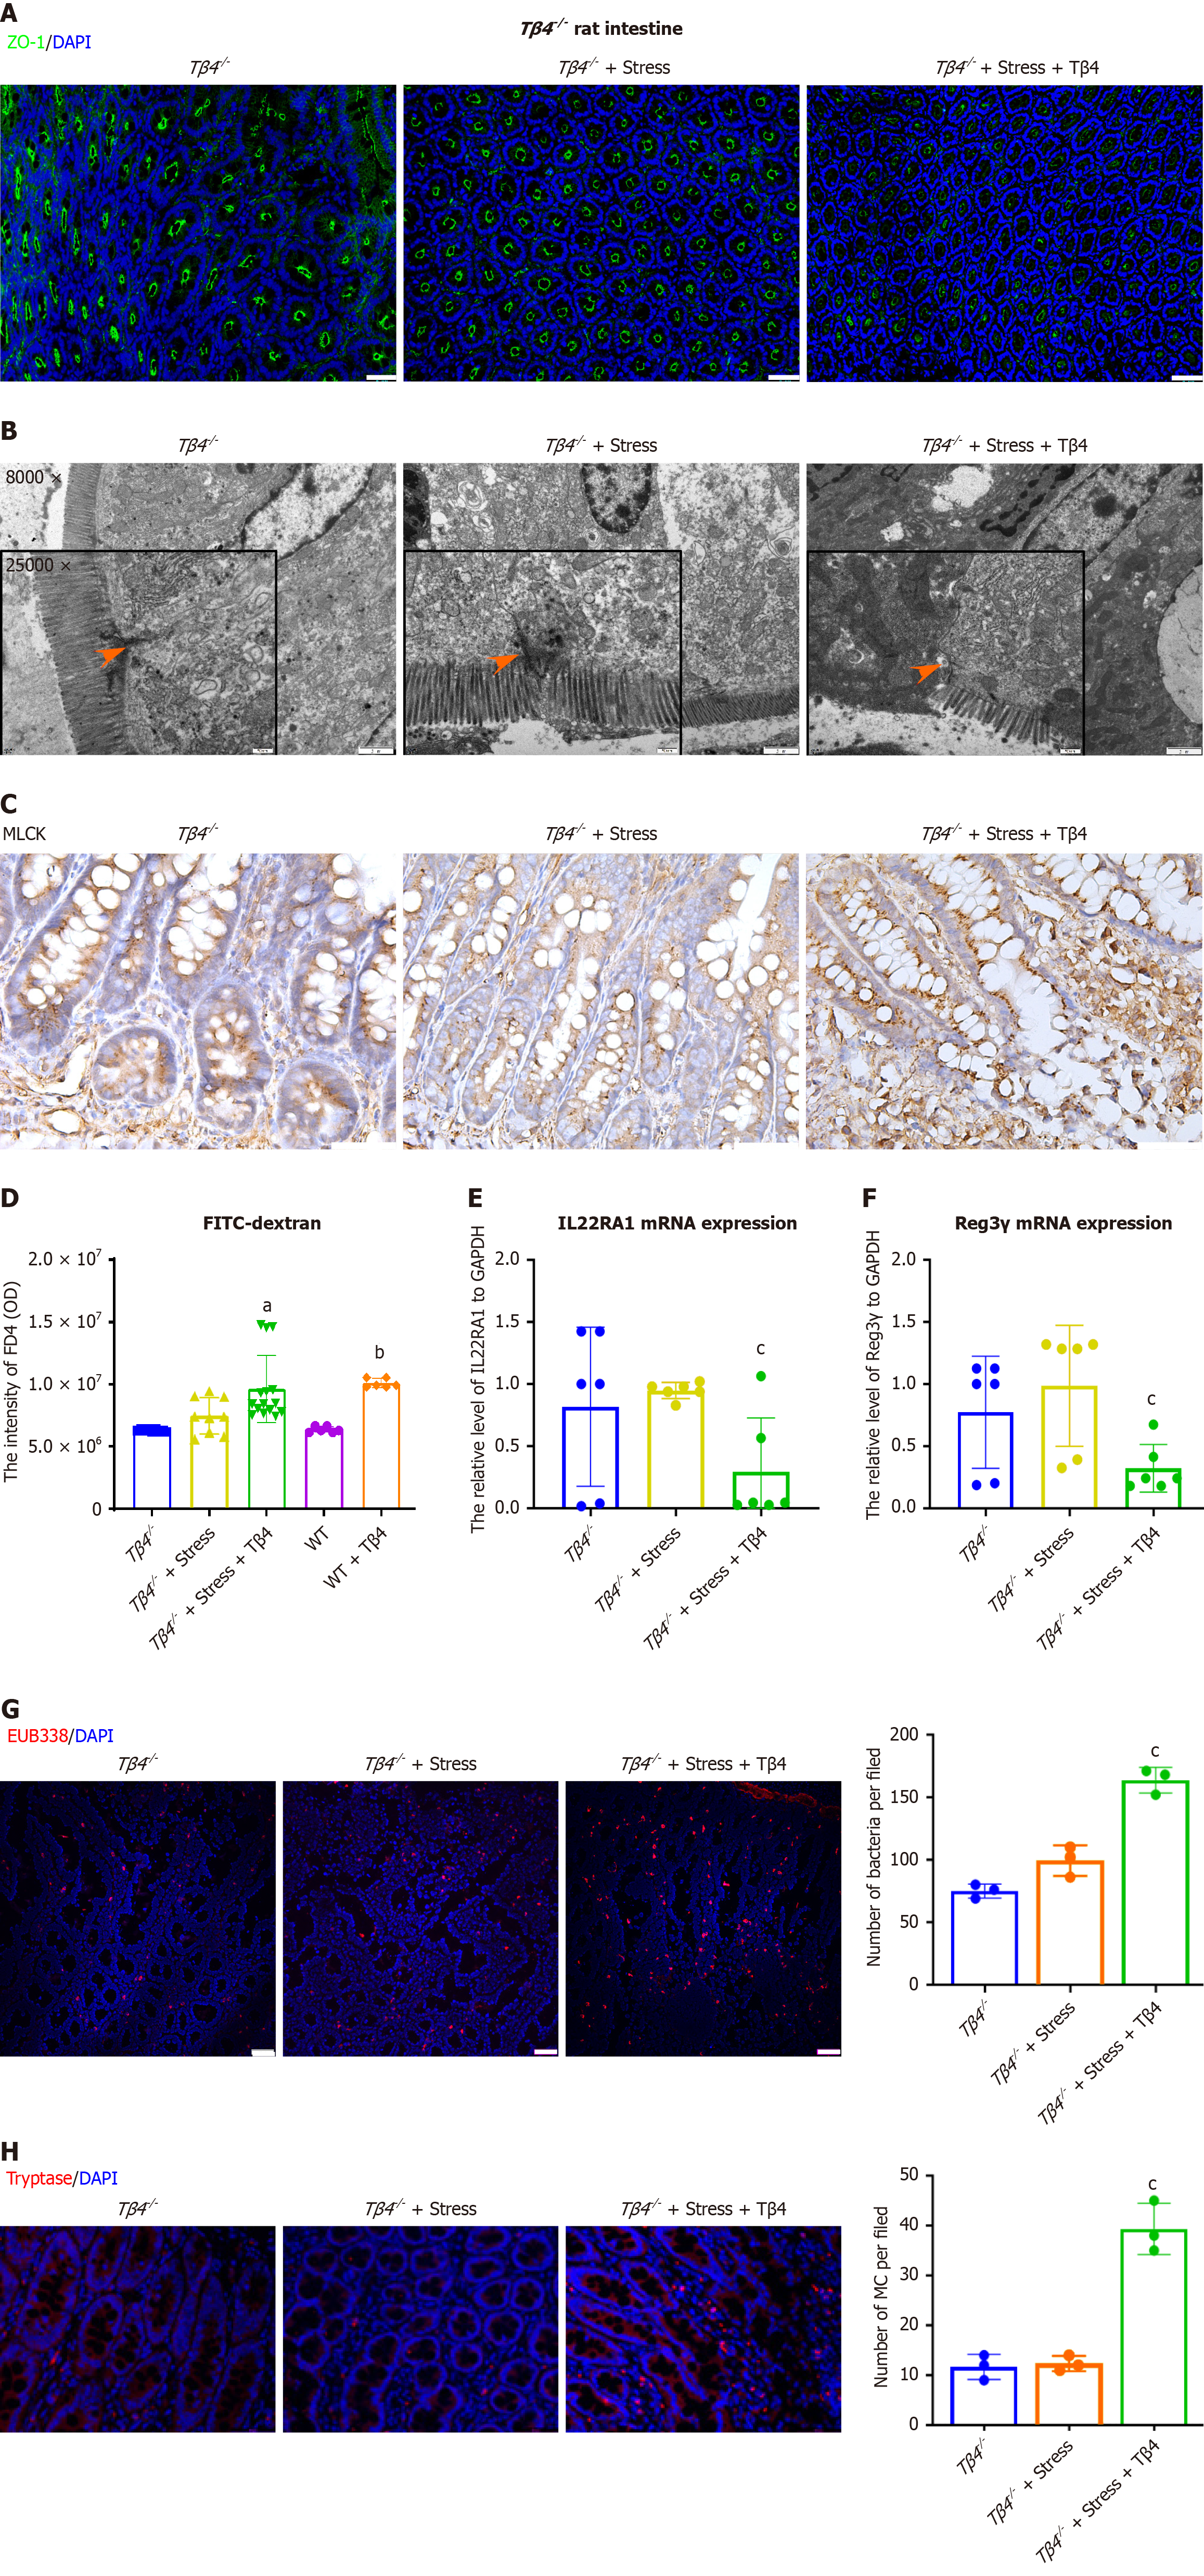
Figure 5 Thymosin β4 deficiency protects rats from stress-induced injury in the intestine.
Thymosin β4 (Tβ4) (3 mg/kg) was injected into stress-induced Tβ4 deficiency (Tβ4−/−) rats. A: Representative intestinal immunofluorescence images of zonulin 1. Scale bar, 50 μm; B: Representative TEM images of the colon. Magnification: 8000 ×, Scale bar, 2 μm. Magnification: 25000 ×, Scale bar, 500 nm; C: Immunohistochemistry staining of myosin light chain kinase. Scale bar, 100 μm; D: FITC-dextran 4000 (FD4, 4 kDa, 5 mg/kg) was orally administered, and the flux of FITC-dextran in rat serum was observed 3 hours later. aP < 0.05 vs the Tβ4−/− group, bP < 0.001 vs the WT group; E and F: The colonic tissue mRNA levels of (E) IL22RA1 and (F) Reg3γ. Bar, SD, cP < 0.05 vs the Tβ4−/− under stress group; G: Representative FISH staining for bacterial infiltration using EUB338 probe (red) and DAPI (blue). Scale bar, 50 μm. Bar, SD, cP < 0.05 vs the Tβ4−/− under stress group; H: Representative intestinal immunofluorescence images of mast cell (Tryptase, red) and DAPI (blue), Scale bar, 50 μm. Bar, SD, cP < 0.05 vs the Tβ4−/− under stress group. MLCK: Myosin light chain kinase; Tβ4: Thymosin β4; IL22RA1: Interleukin 22 receptor A1; WT: Wild-type.
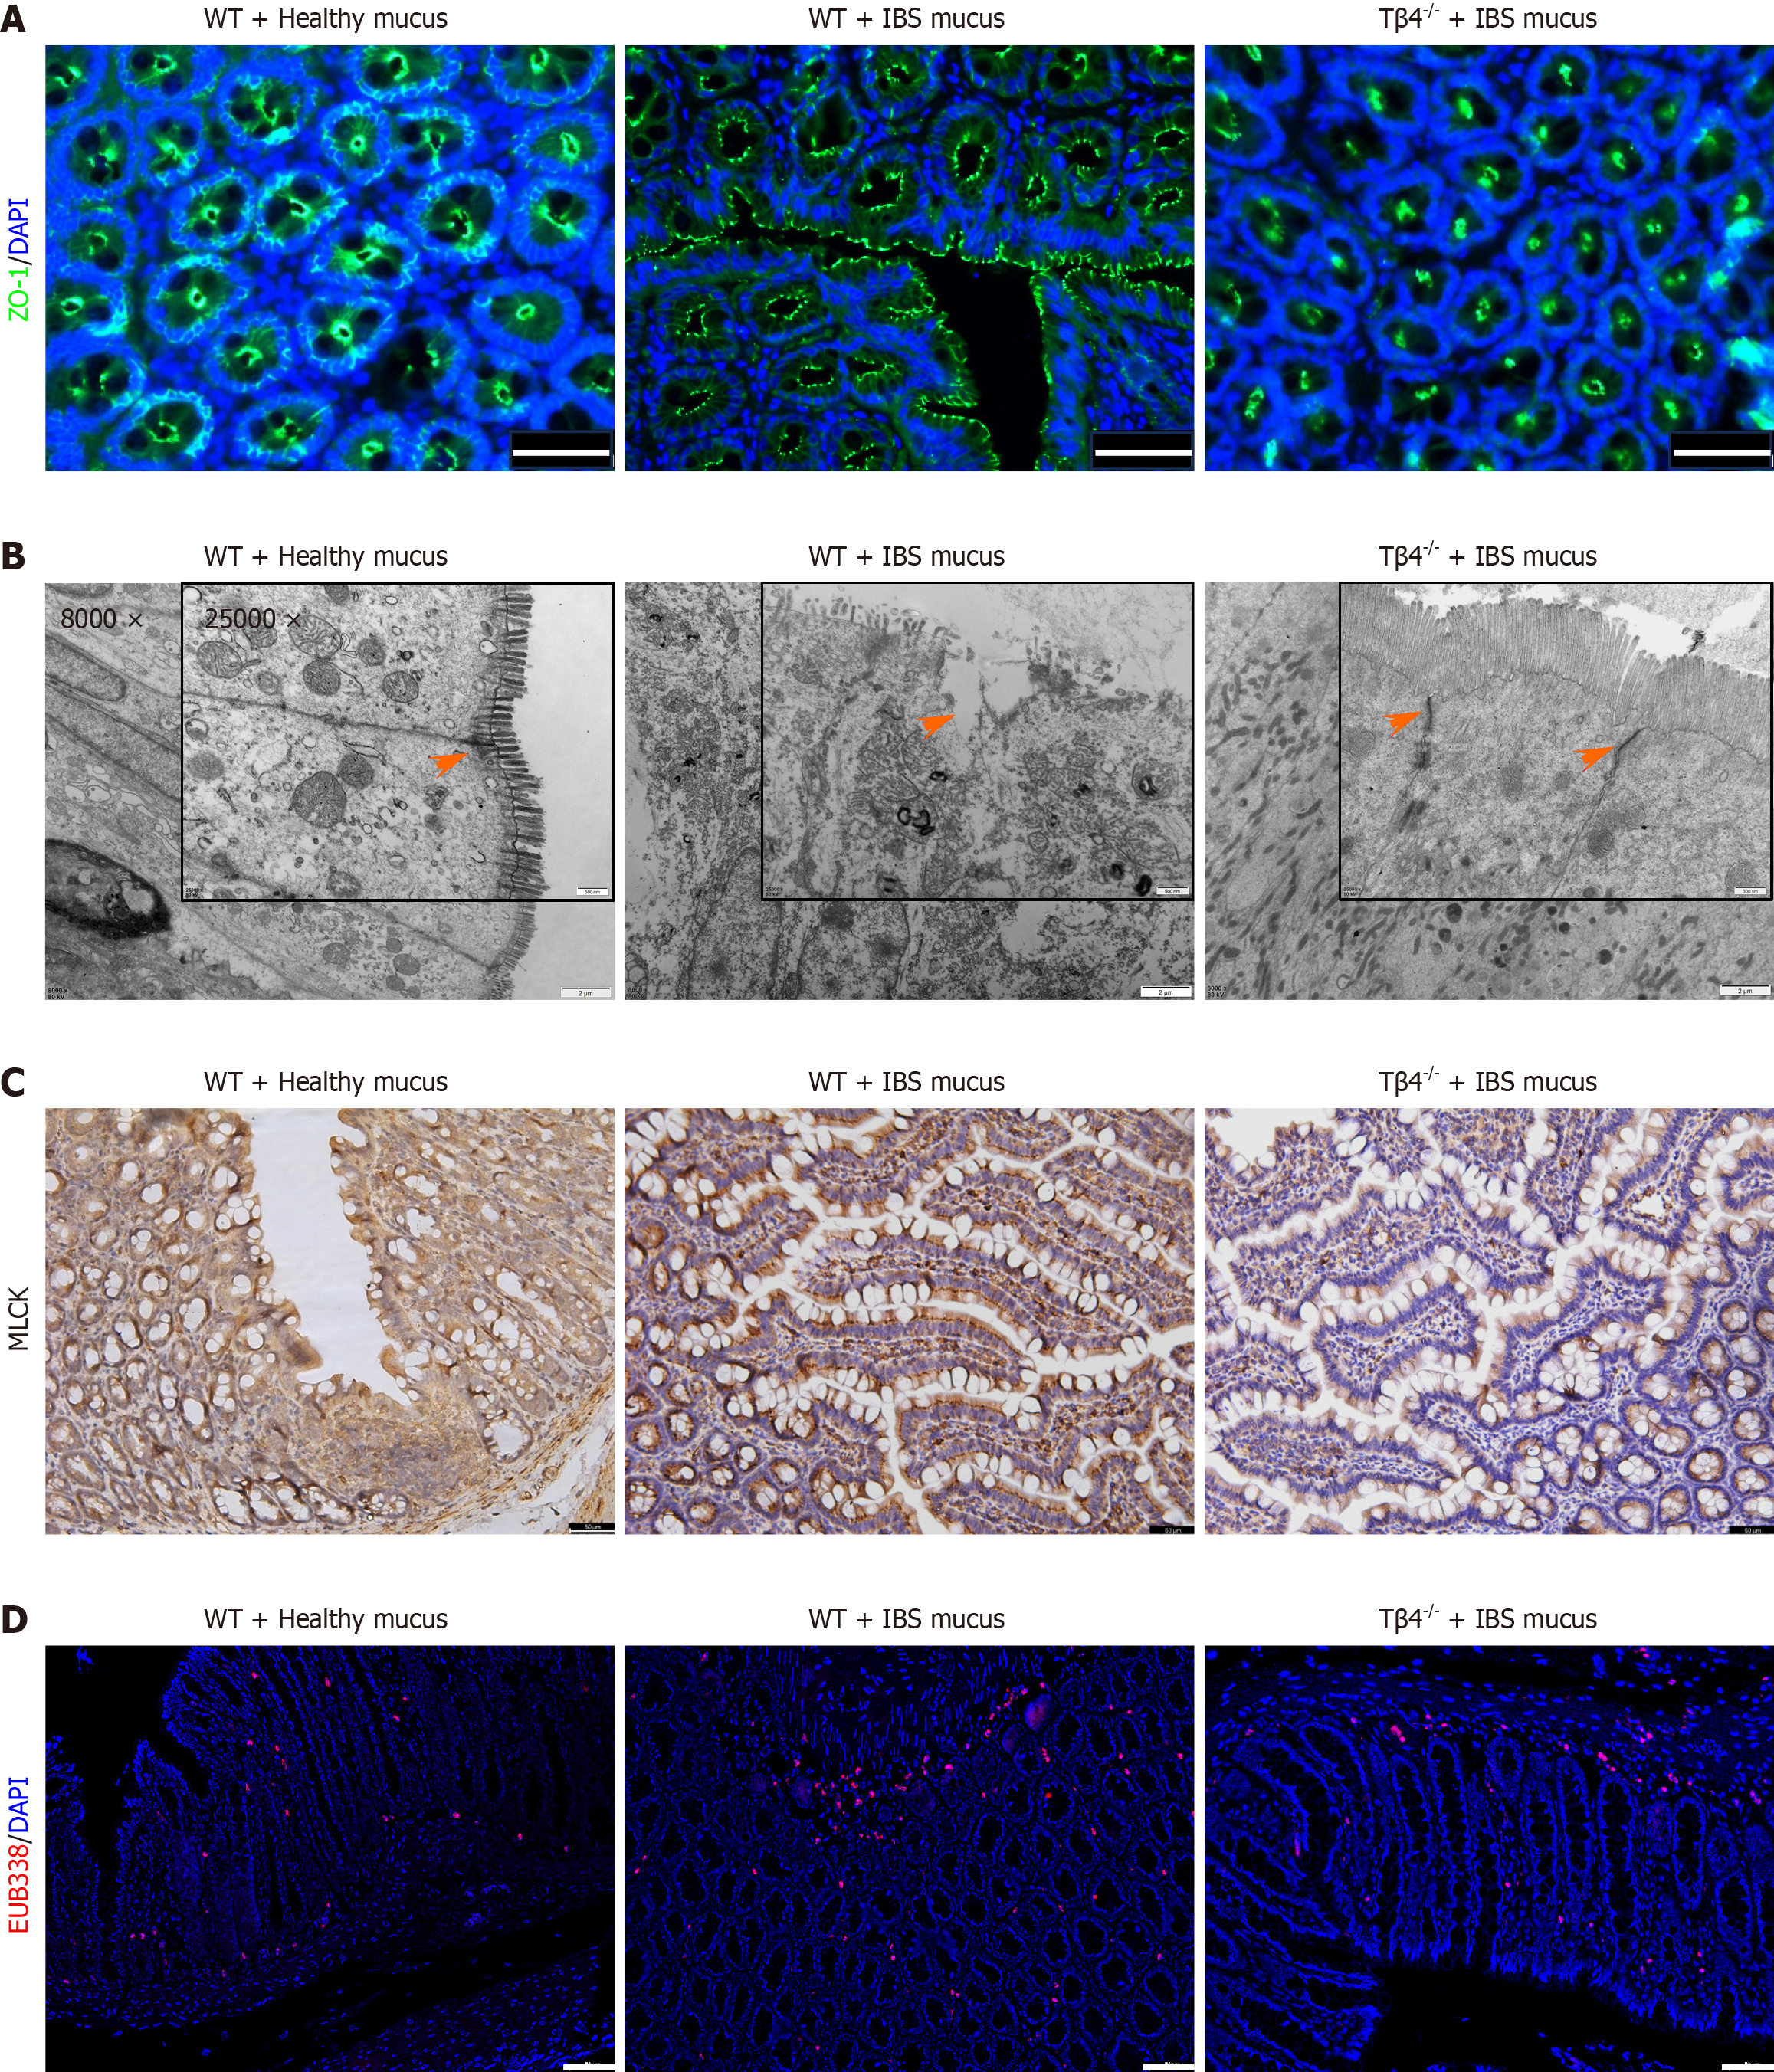
Figure 6 Colonic mucus of irritable bowel syndrome patients impairs intestinal barrier integrity via Thymosin β4.
Colonic mucus from healthy and irritable bowel syndrome individuals was transplanted into rats’ colon. A: Immunohistochemical images of zonulin 1 in wild-type (WT) and Tβ4−/− rats; B: TEM images of colon. Magnification: 8000 ×, Scale bar, 2 μm. Magnification: 25000 ×, Scale bar, 500 nm; C: The immunohistochemistry staining of myosin light chain kinase. Scale bar, 50 μm; D: Representative FISH staining for bacterial infiltration using EUB338 probe (red) and DAPI (blue). Scale bar, 50 μm. Tβ4: Thymosin β4; WT: Wild-type; IBS: Irritable bowel syndrome.
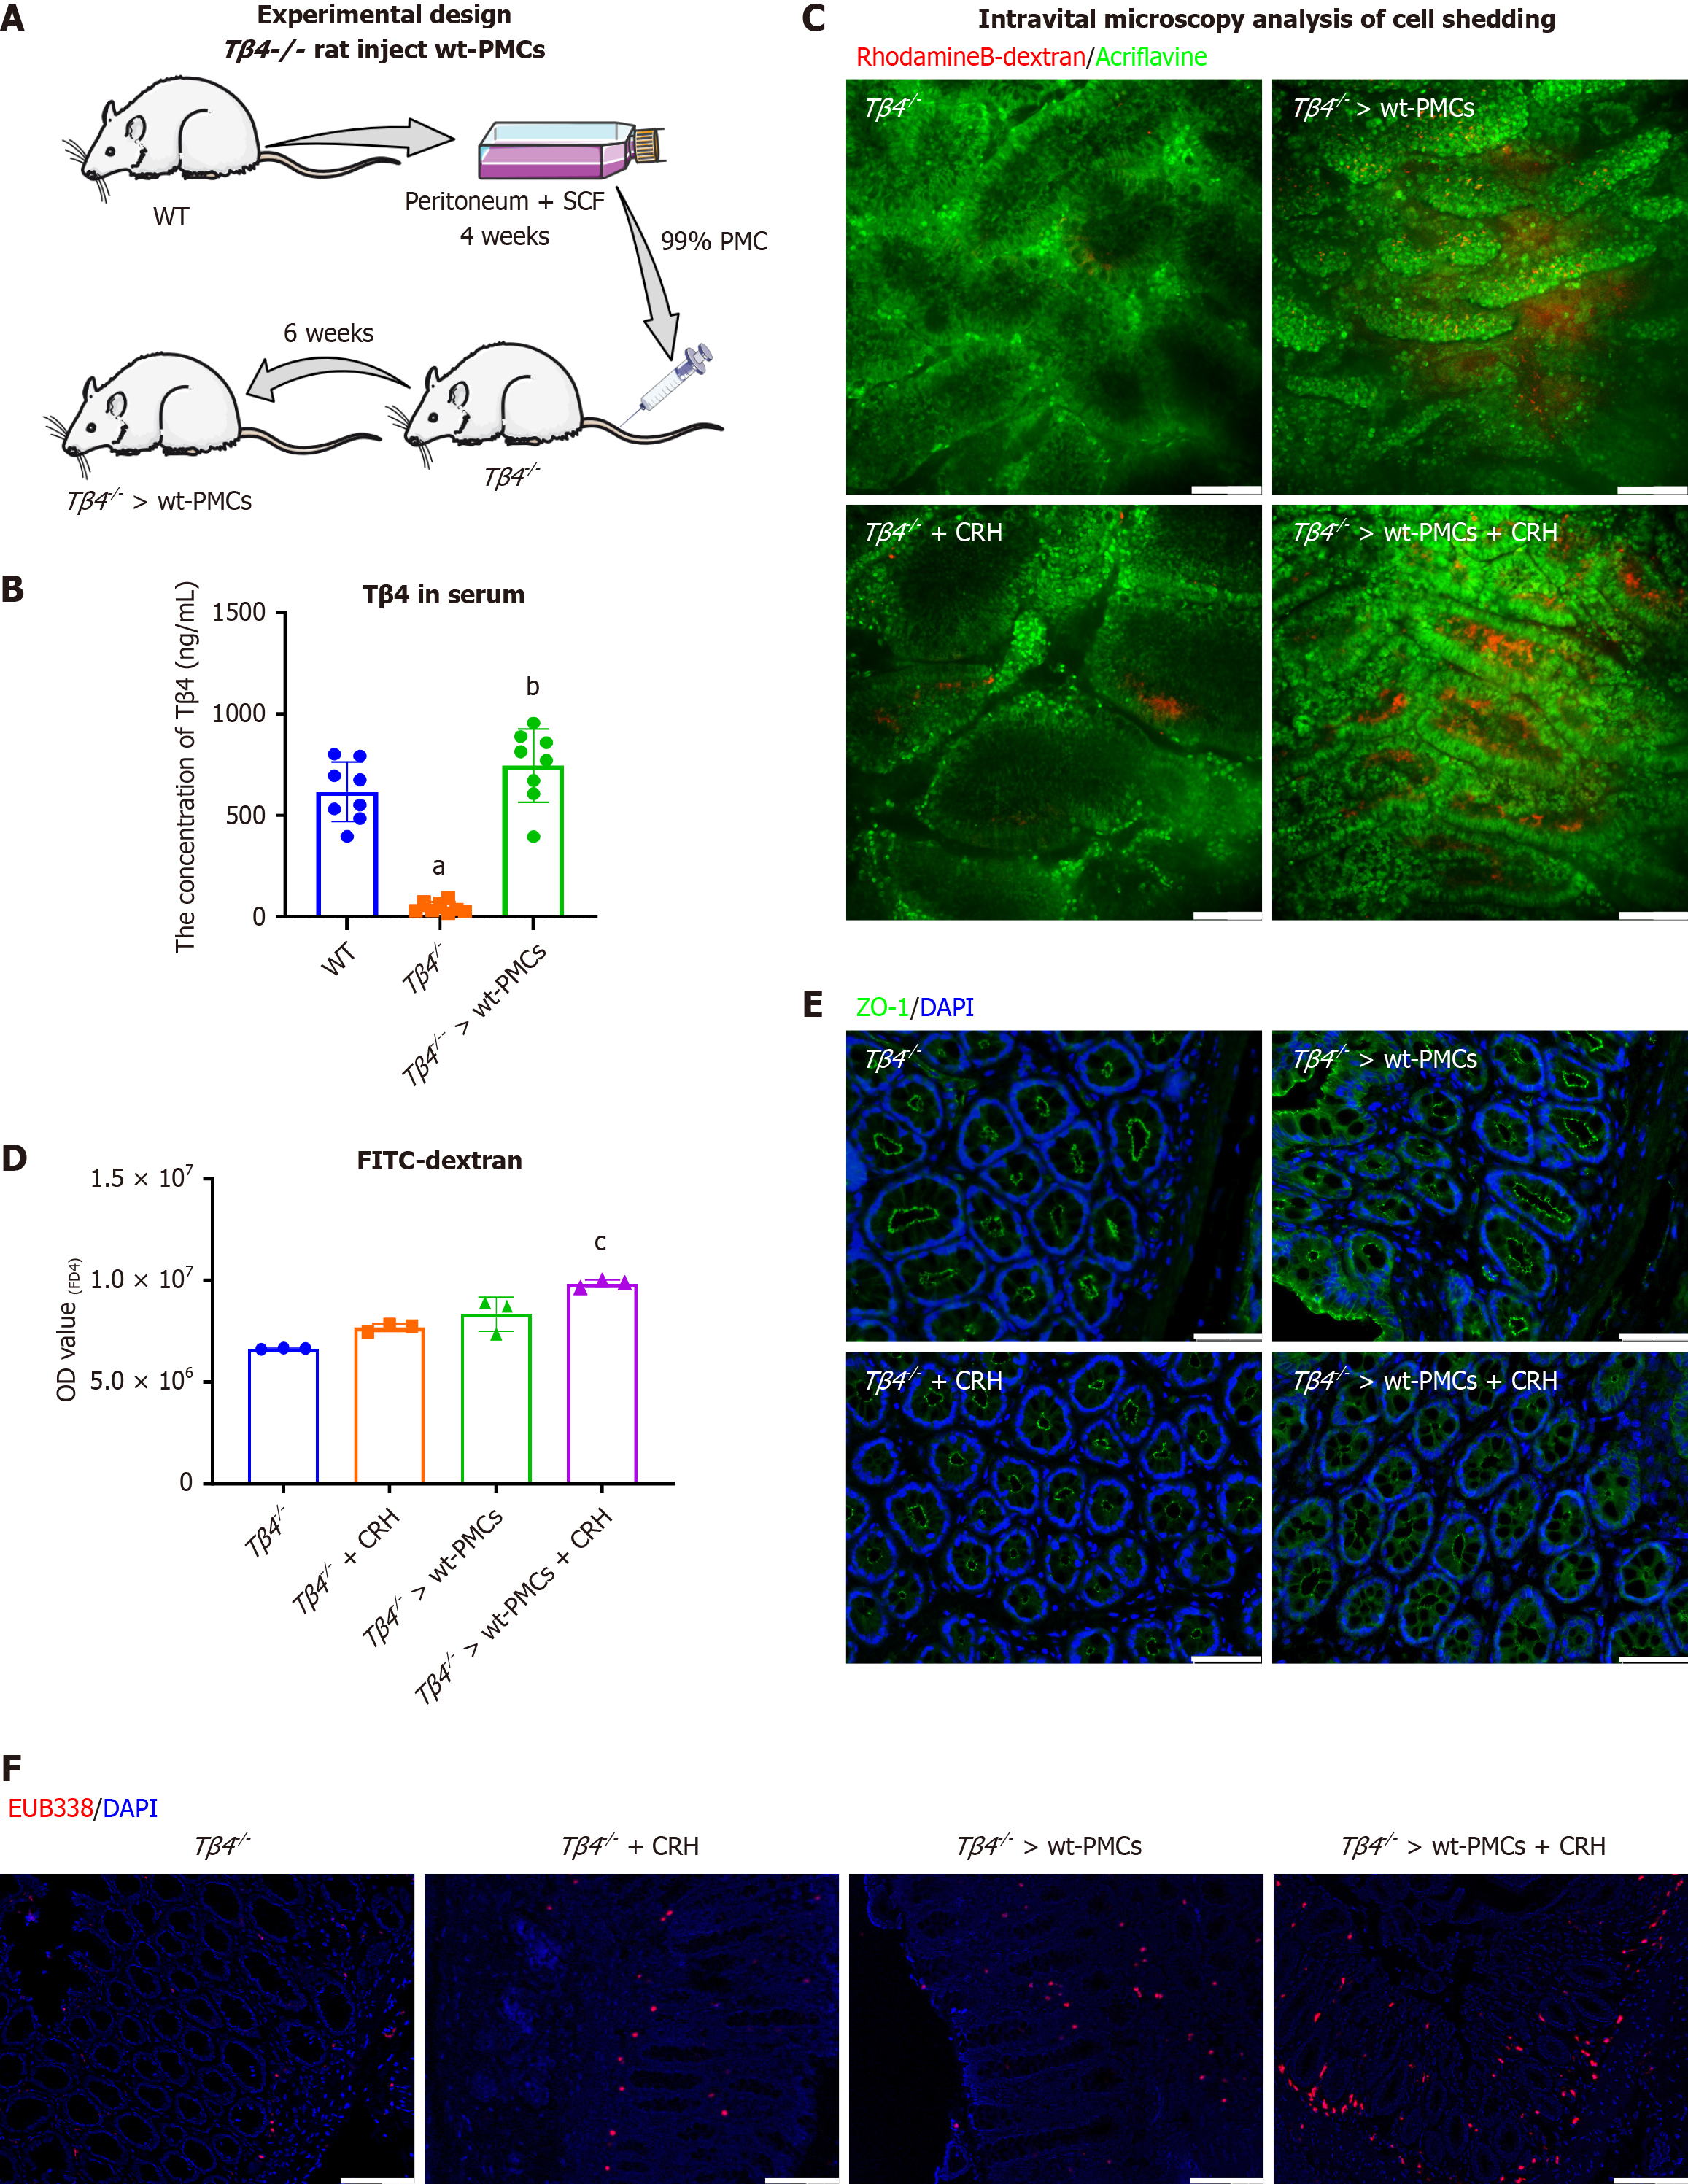
Figure 7 Thymosin β4 released from mast cells mediates intestinal barrier permeability.
A: Schematic illustration of peritoneal mast cell (PMC) reconstitution; B: The concentration of thymosin β4 (Tβ4) in rat serum after six weeks. Tβ4−/− rats and Tβ4−/− > wild-type (wt)-PMCs were treated with corticotropin-releasing hormone. Bar, SD, aP < 0.001 vs the WT group, bP < 0.001 vs the Tβ4−/− group; C: Representative images of cell shedding using luminal acriflavine (green) and rhodamine B-dextran (red). Scale bar, 100 μm; D: FITC-dextran 4000 (FD4, 4 kDa, 5 mg/kg) was orally administered, and the flux of FITC-dextran in rat serum was observed 3 hours later. Bar, SD, cP < 0.05 vs the “Tβ4−/− > wt-PMCs” group; E: Representative intestinal immunofluorescence images of zonulin 1. Scale bar, 50 μm; F: Representative FISH staining for bacterial infiltration using EUB338 probe (red) and DAPI (blue). Scale bar, 100 μm. Tβ4: Thymosin β4; WT: Wild-type; PMC: Peritoneal mast cells.
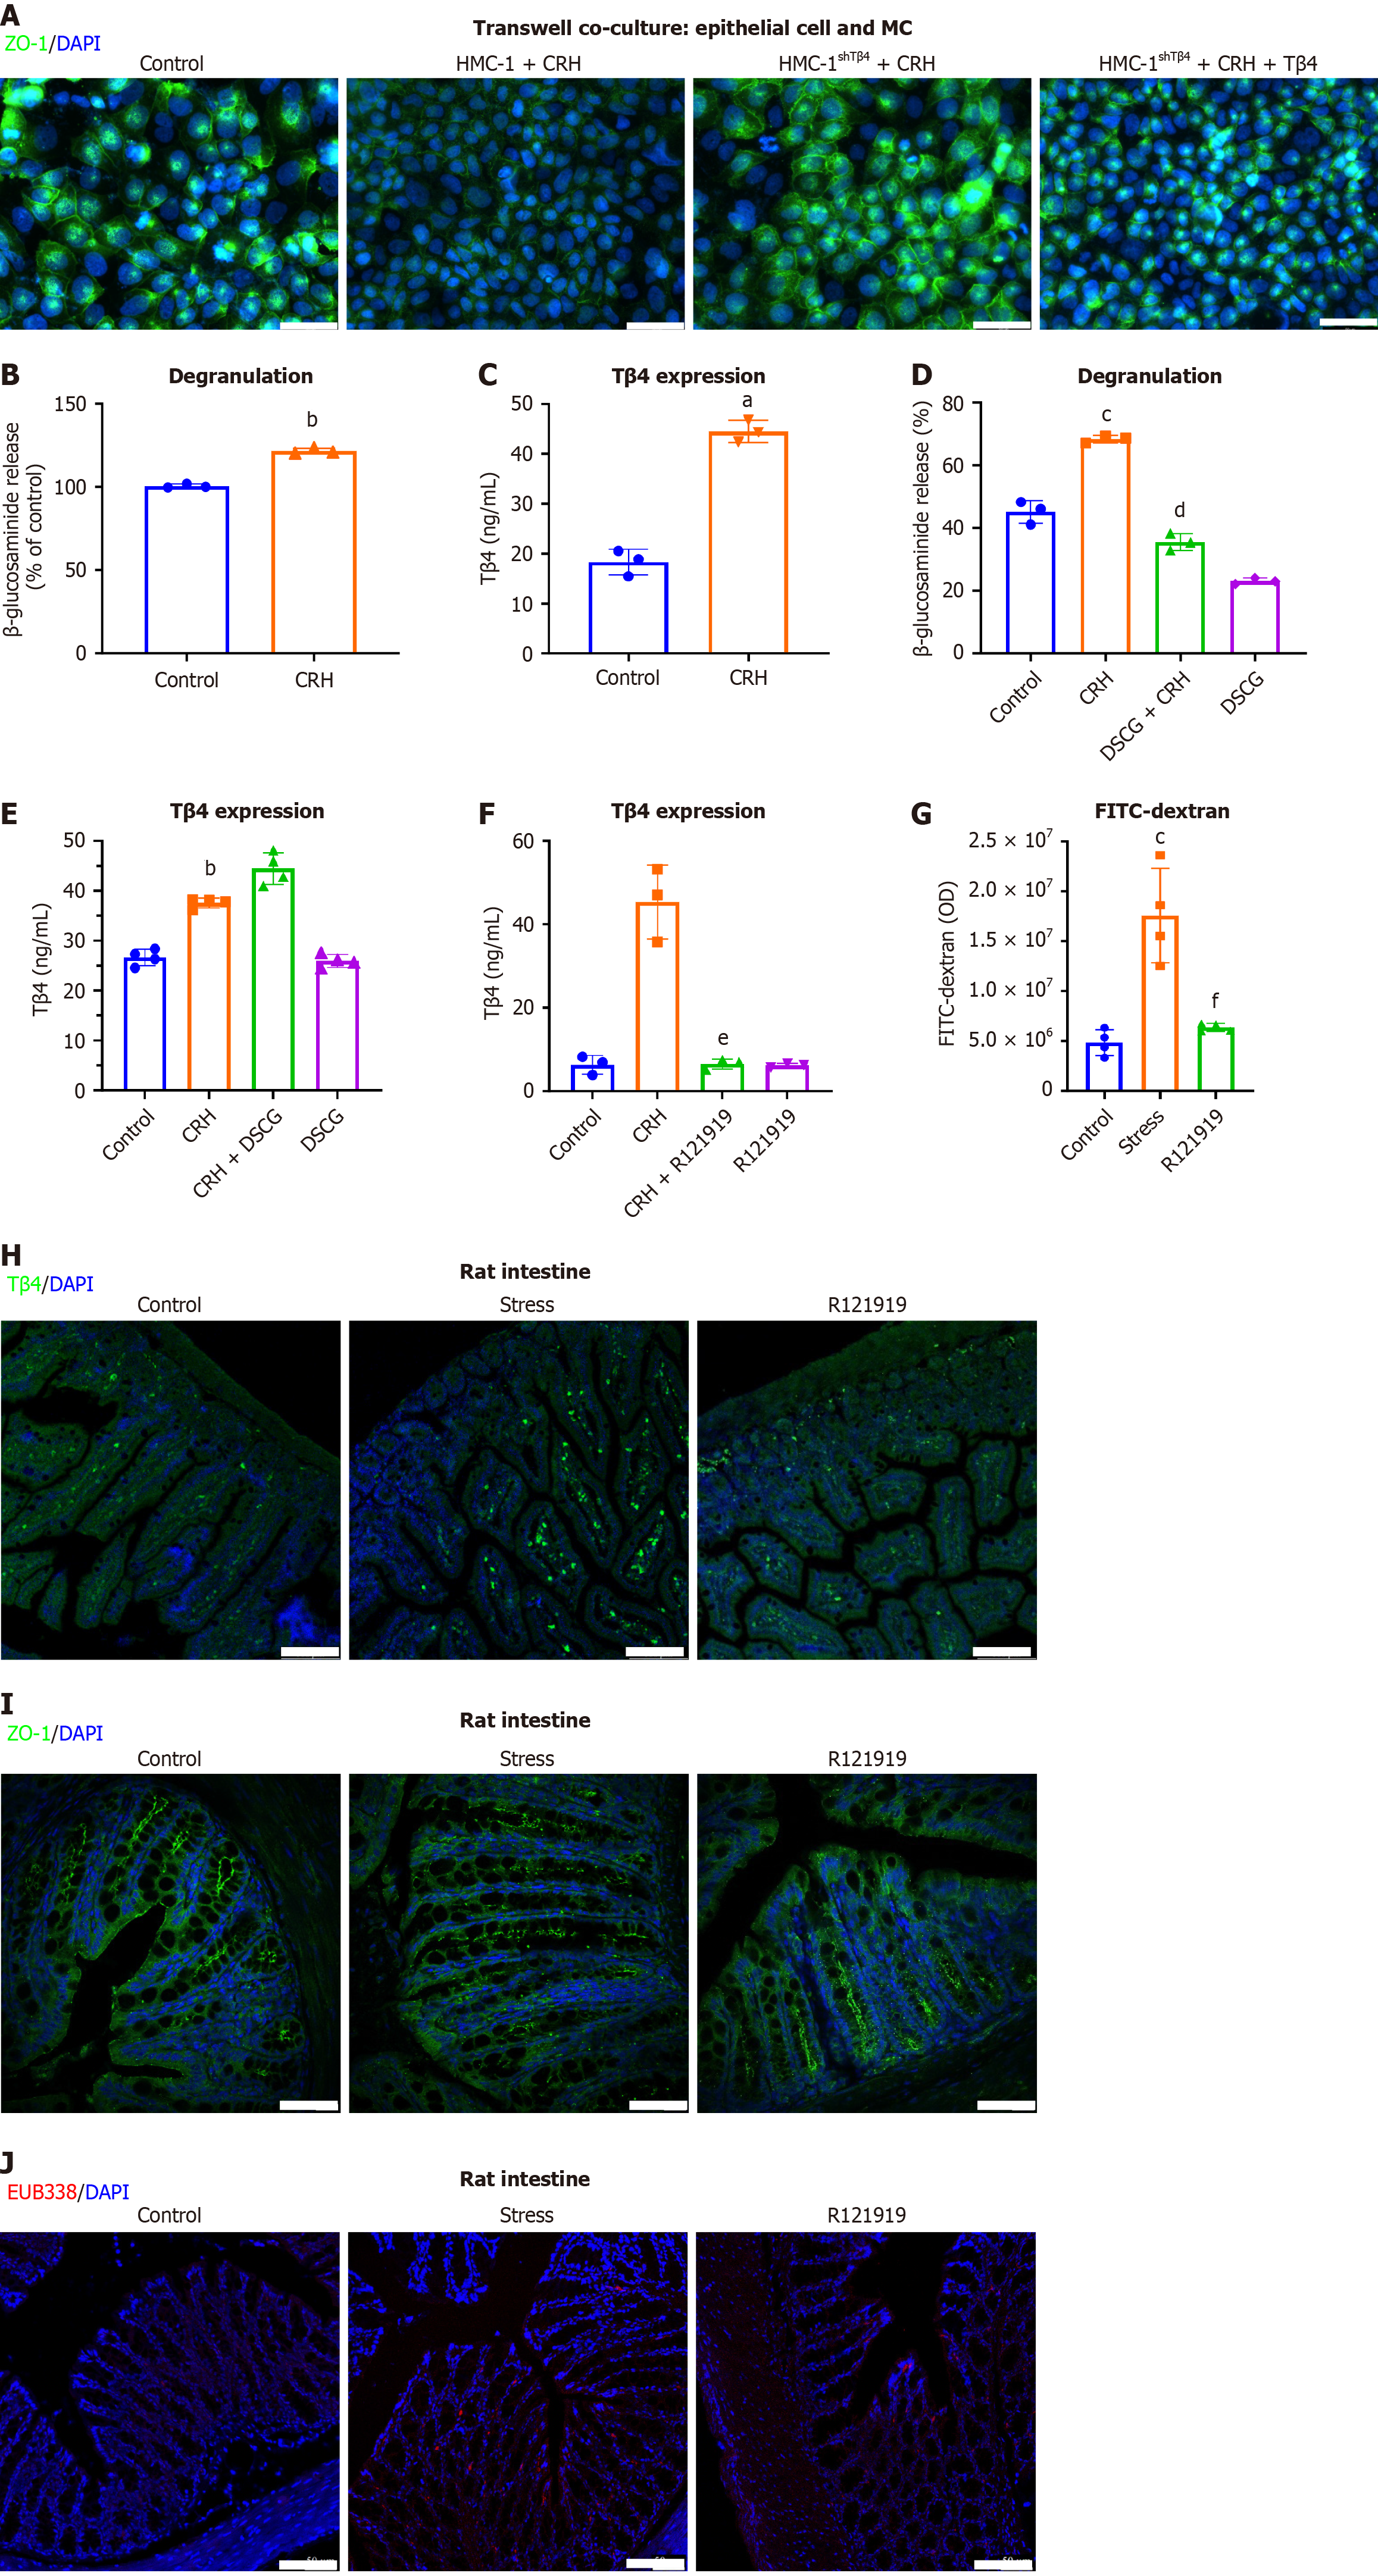
Figure 8 Thymosin β4 release from mast cells is driven by corticotropin-releasing hormone/corticotropin-releasing hormone receptor 1 signaling, bypassing degranulation.
A: HMC-1 cells or Thymosin β4 knock down HMC-1 cells (shTβ4) were co-cultured with Caco2 cells monolayers. The immunofluorescence staining of zonulin 1 (ZO-1) was evaluated. Scale bar, 50 μm; B and C: After treatment of HMC-1 cells with corticotropin-releasing hormone (CRH) (500 nmol/L) for 15 minutes, (B) the level of degranulation and (C) the secretion of Tβ4 were determined; D and E: The cells were treated with DSCG before CRH, and (D) the level of degranulation and (E) the secretion of Tβ4 were determined; F: The concentration of Tβ4 in HMC-1 after pre-administration with CRH receptor 1 antagonist (R121919) followed by CRH treatment; G: Stressed rats were injected with R121919 (10 mg/kg), and the intestinal barrier permeability was assessed by FD4 assay; H and I: Representative immunofluorescence of the intestine for (H) Tβ4 (Scale bar, 100 μm) and (I) ZO-1, Scale bar, 50 μm; J: Representative FISH staining for bacterial infiltration using EUB338 probe (red) and DAPI (blue). Scale bar, 100 μm. Bar, SD, aP < 0.001 vs Control, bP < 0.01 vs Control, cP < 0.05 vs Control, dP < 0.001 vs CRH group, eP < 0.05 vs CRH group, fP < 0.05 vs stress group. MC: Mast cell; ZO-1: Zonulin 1; CRH: Corticotropin-releasing hormone; Tβ4: Thymosin β4.
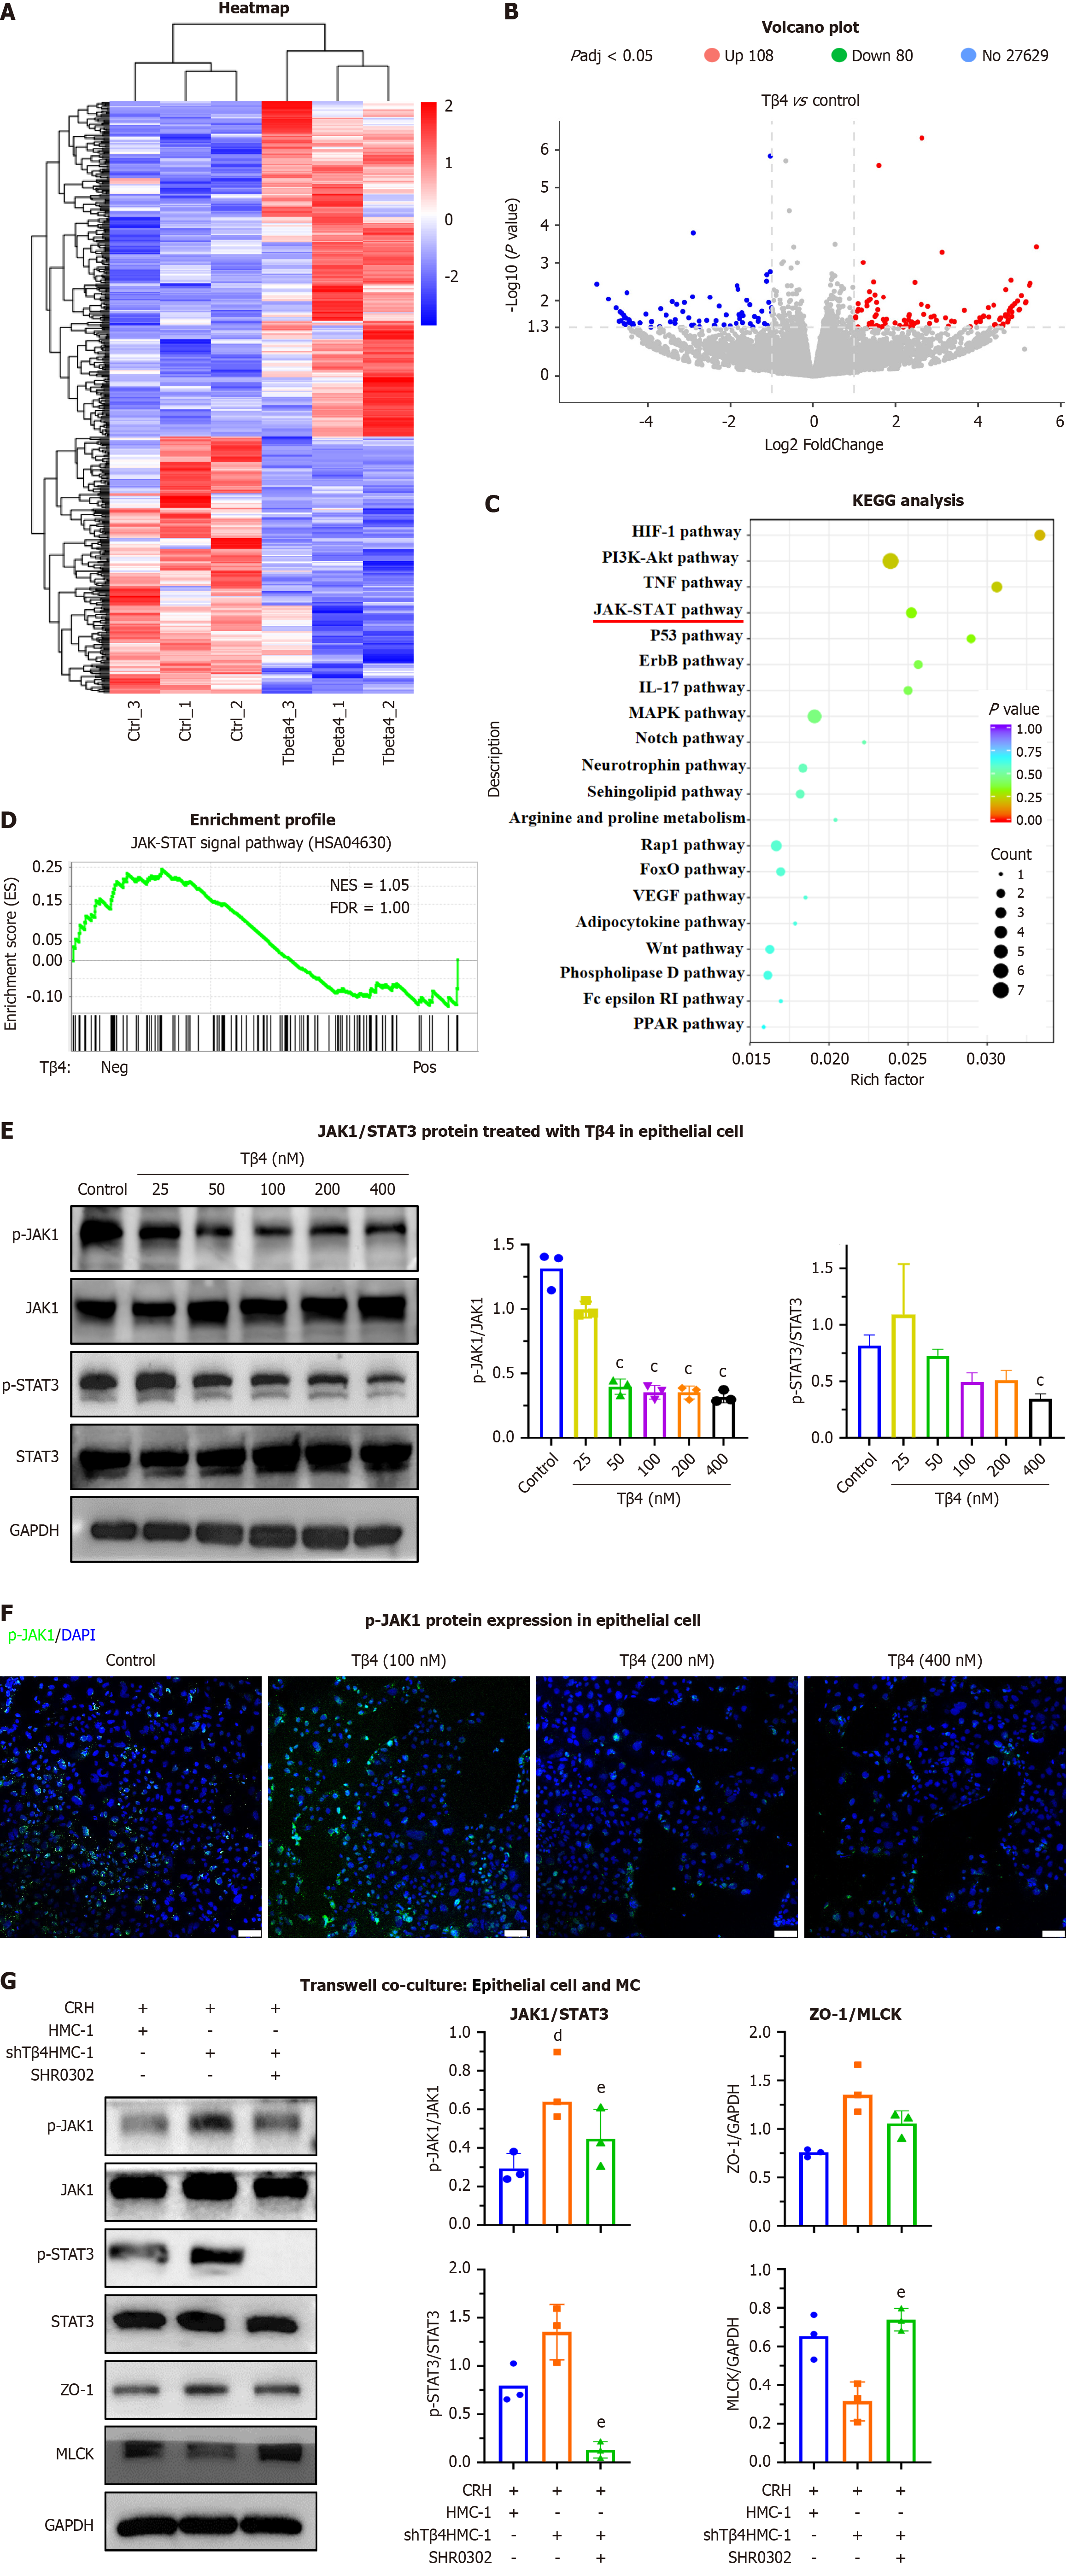
Figure 9 Thymosin β4 regulates the Janus kinase 1/signal transducer and activation of transcription 3 pathways in epithelial cells.
Caco2 cells were treated with thymosin β4 (Tβ4). A: Heatmap of differentially expressed mRNAs; B: Volcano plot of RNA-seq results (n = 3 biological replicates/group; differential expression defined as |log2 (fold change)| > 1 and FDR < 0.05); C: Top 20 enriched pathways by KEGG analysis; D: GSEA analysis of Janus kinase 1 (JAK1)/signal transducer and activation of transcription 3 (STAT3) pathway enrichment in Tβ4-positive vs -negative Caco2 cell; E: Representative western blot images and biochemical quantification of p-JAK1, JAK1, p-STAT3, STAT3. Bar, SD, cP < 0.05 vs Control; F: Immunofluorescence staining of p-JAK1 in Caco2 cells. Scale bar, 100 μm; G: Activated mast cells [HMC-1 and HMC-1shTβ4 treated with corticotropin-releasing hormone (CRH)] stimulated with SHR0302 and co-cultured with Caco2 cells, and representative western blot images and biochemical quantification of p-JAK1, JAK1, p-STAT3, STAT3, zonulin 1, myosin light chain kinase and GAPDH. Bar, SD, dP < 0.05 vs “HMC-1 with CRH”, eP < 0.05 vs “HMC-1shTβ4 with CRH”. Tβ4: Thymosin β4; JAK1: Janus kinase 1; STAT3: Signal transducer and activation of transcription 3; MC: Mast cell; ZO-1: Zonulin 1; MLCK: Myosin light chain kinase; CRH: Corticotropin-releasing hormone.
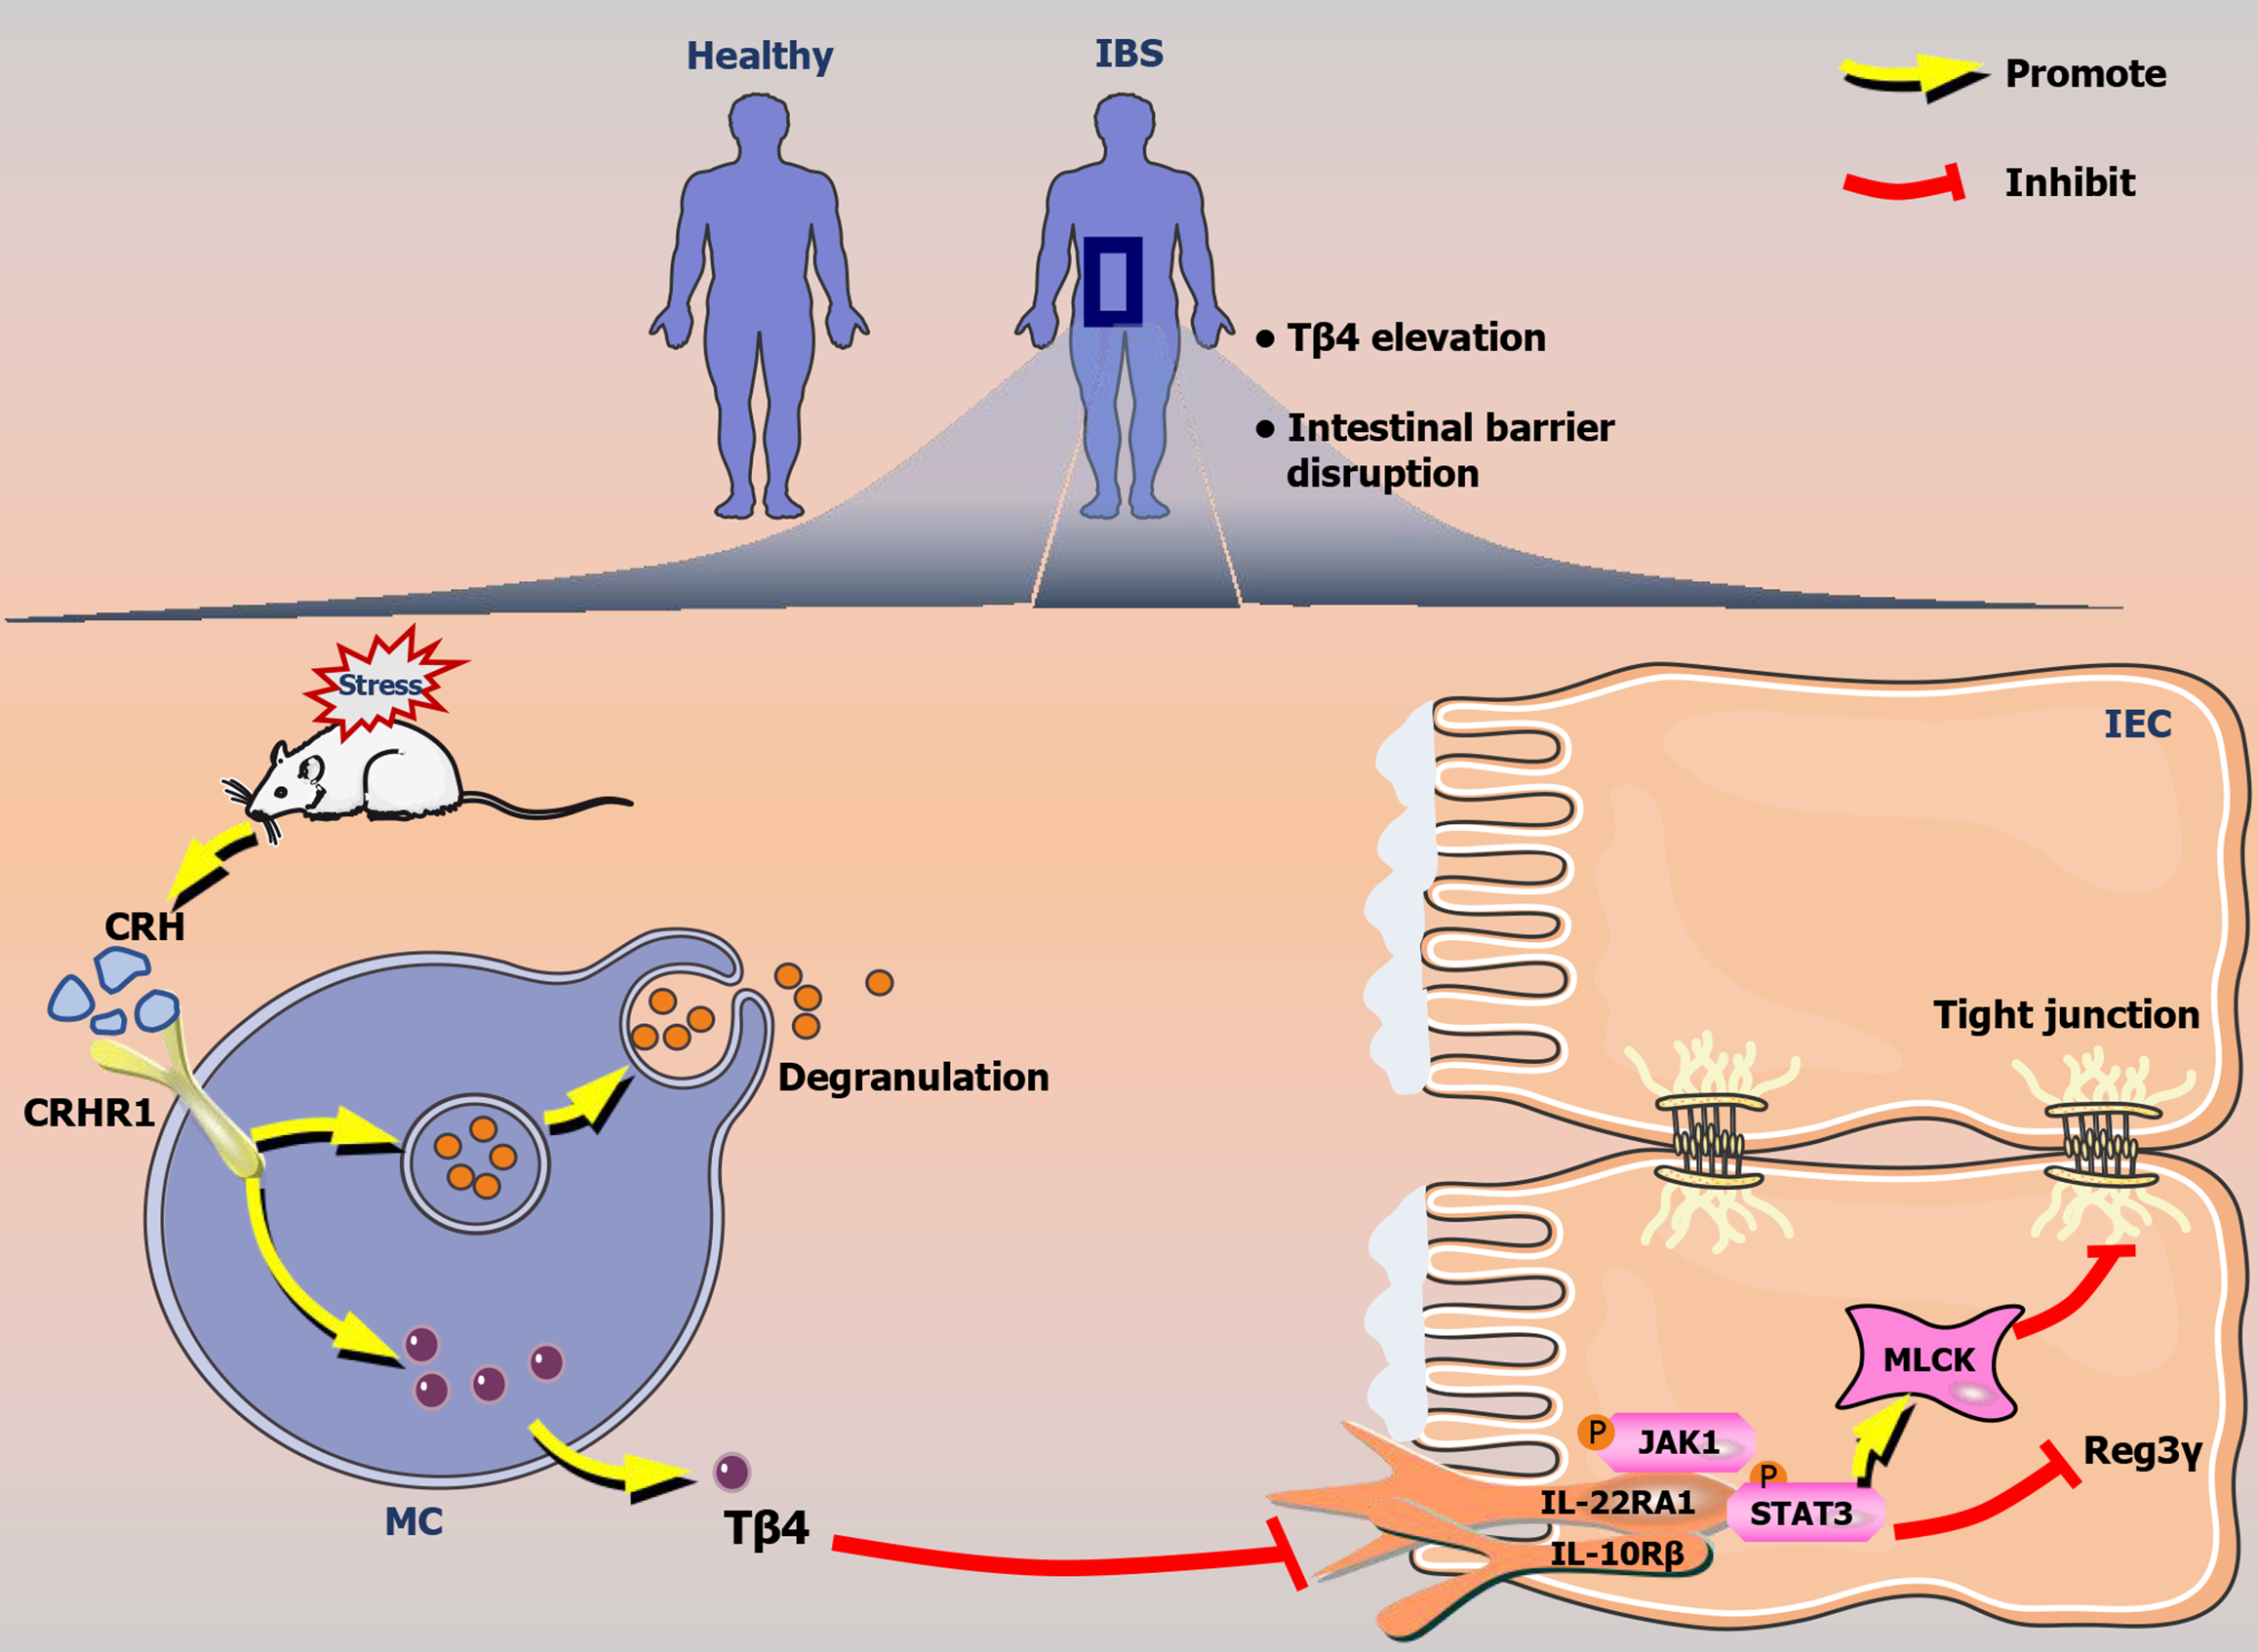
Figure 10 Graphical abstract.
Mast cell-released thymosin β4 drives intestinal barrier dysfunction in stress-induced irritable bowel syndrome. Tβ4: Thymosin β4; CRH: Corticotropin-releasing hormone; CRHR1: Corticotropin-releasing hormone receptor 1; JAK1: Janus kinase 1; STAT3: Signal transducer and activation of transcription 3; MC: Mast cell; MLCK: Myosin light chain kinase; IL22RA1: Interleukin 22 receptor A1; IBS: Irritable bowel syndrome.
- Citation: Sun YS, Bai XQ, Sun KD, Li J, Liu L, Chen YY, Zeng ZY, Wang Q, Guo YB. Thymosin β4 released by mast cells under stress conditions impairs intestinal epithelial barrier via IL22RA1/JAK1/STAT3 signaling in irritable bowel syndrome. World J Gastroenterol 2025; 31(42): 111706
- URL: https://www.wjgnet.com/1007-9327/full/v31/i42/111706.htm
- DOI: https://dx.doi.org/10.3748/wjg.v31.i42.111706


