Copyright
©The Author(s) 2025.
World J Gastroenterol. Oct 14, 2025; 31(38): 111298
Published online Oct 14, 2025. doi: 10.3748/wjg.v31.i38.111298
Published online Oct 14, 2025. doi: 10.3748/wjg.v31.i38.111298
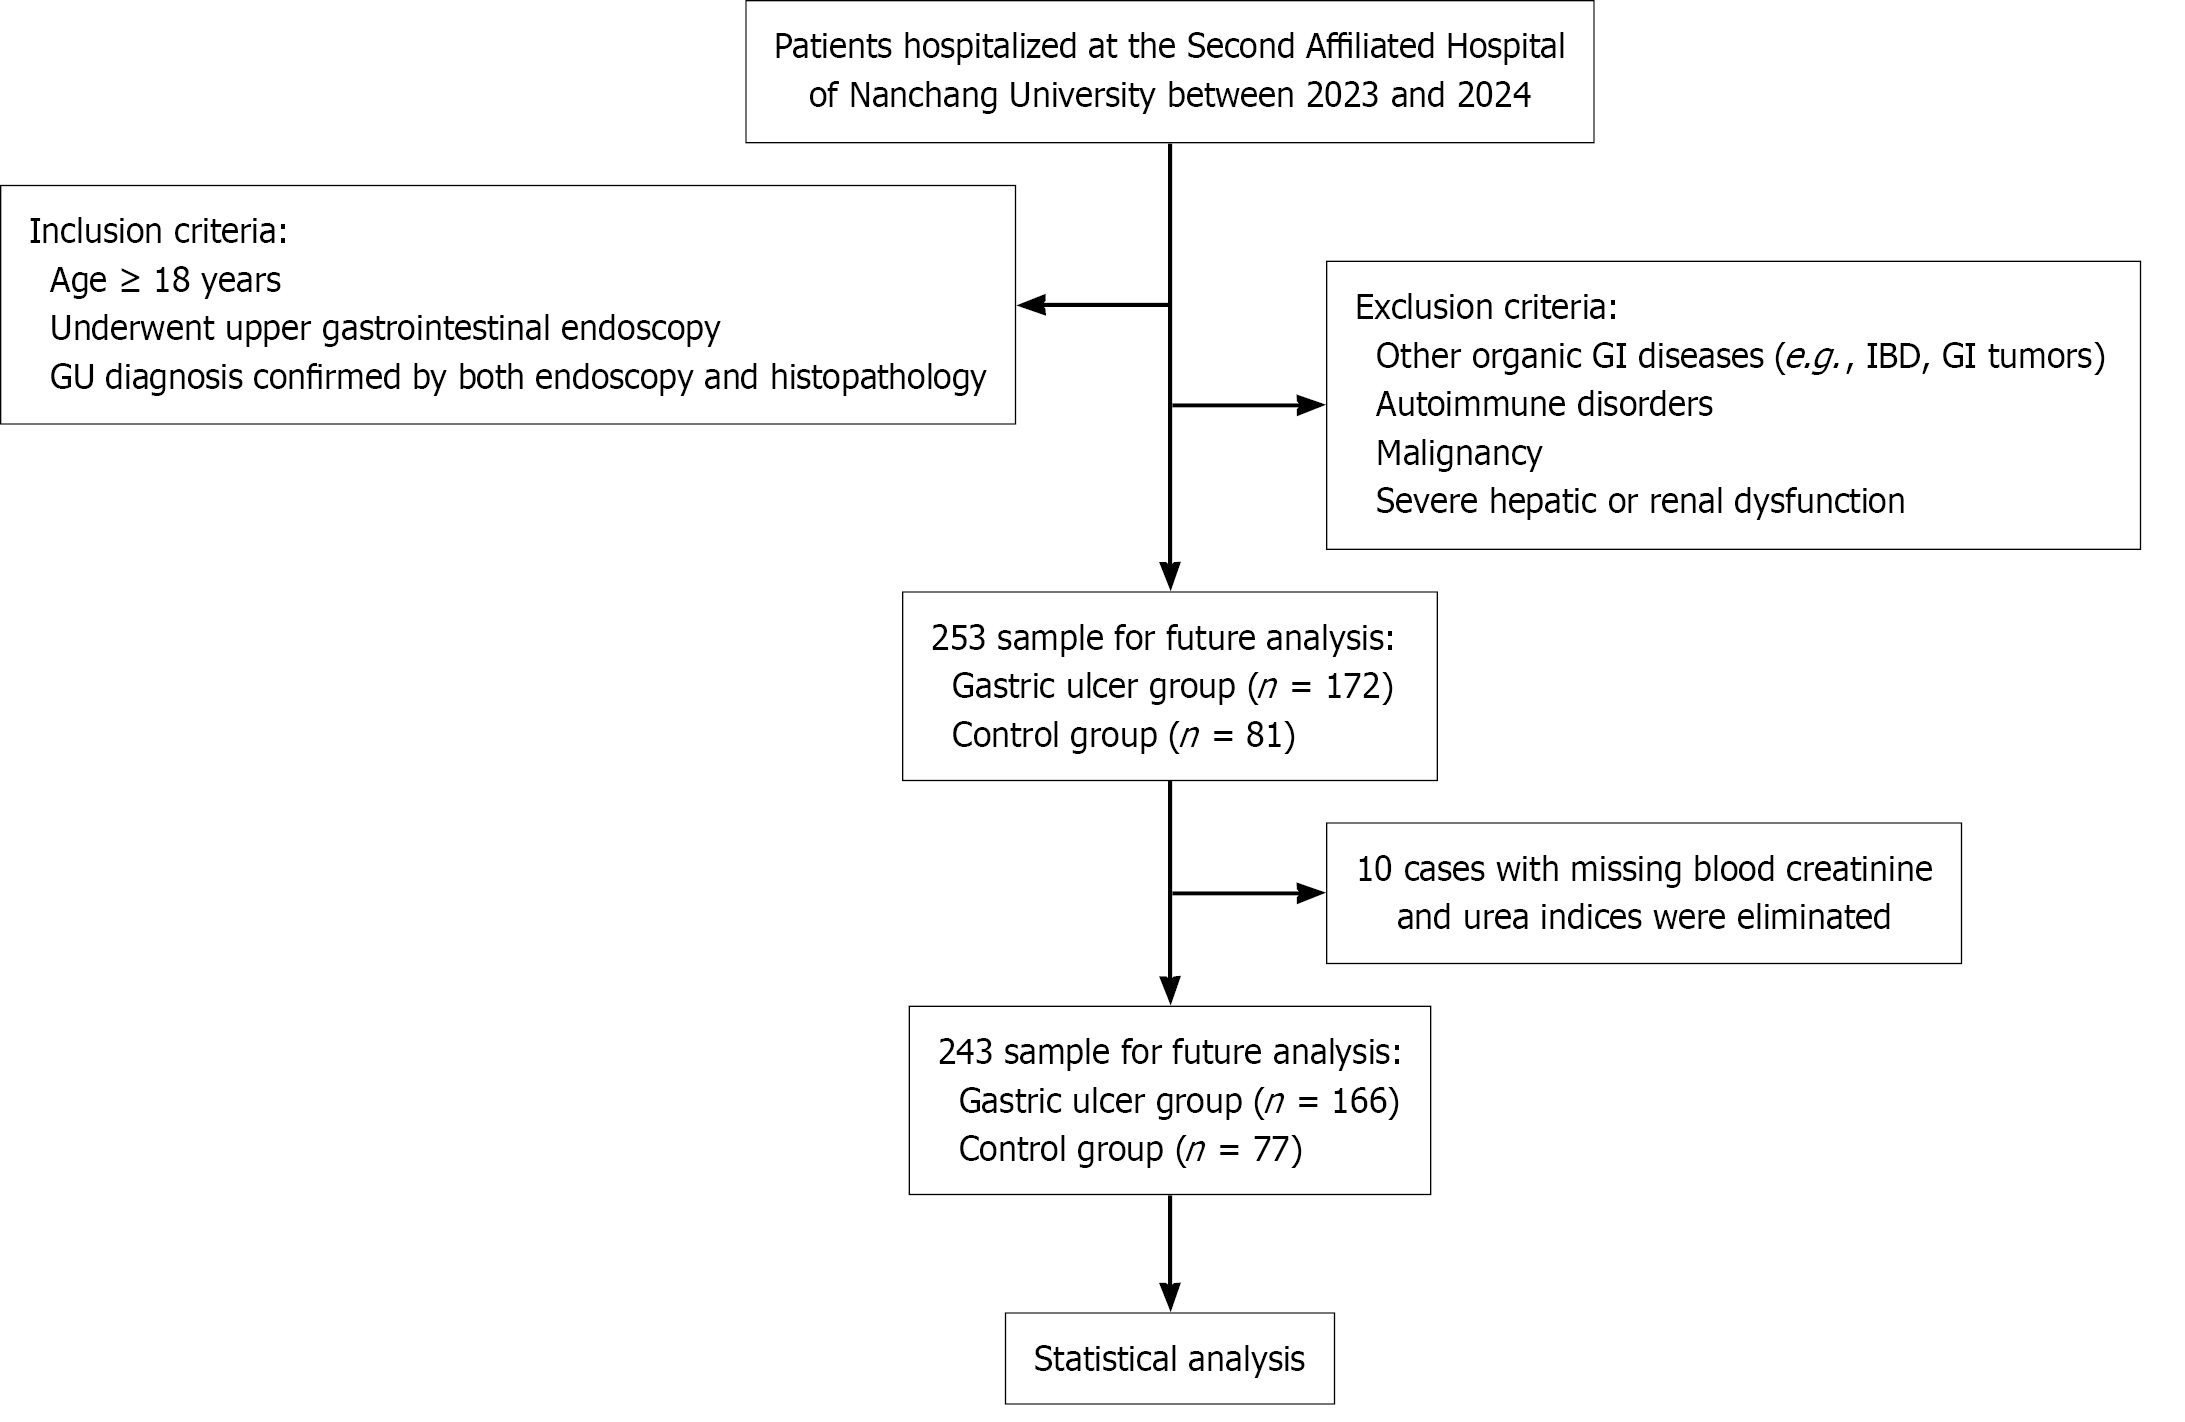
Figure 1 Flowchart for the study.
GU: Gastric ulcer; GI: Gastrointestinal; IBD: Inflammatory bowel disease.
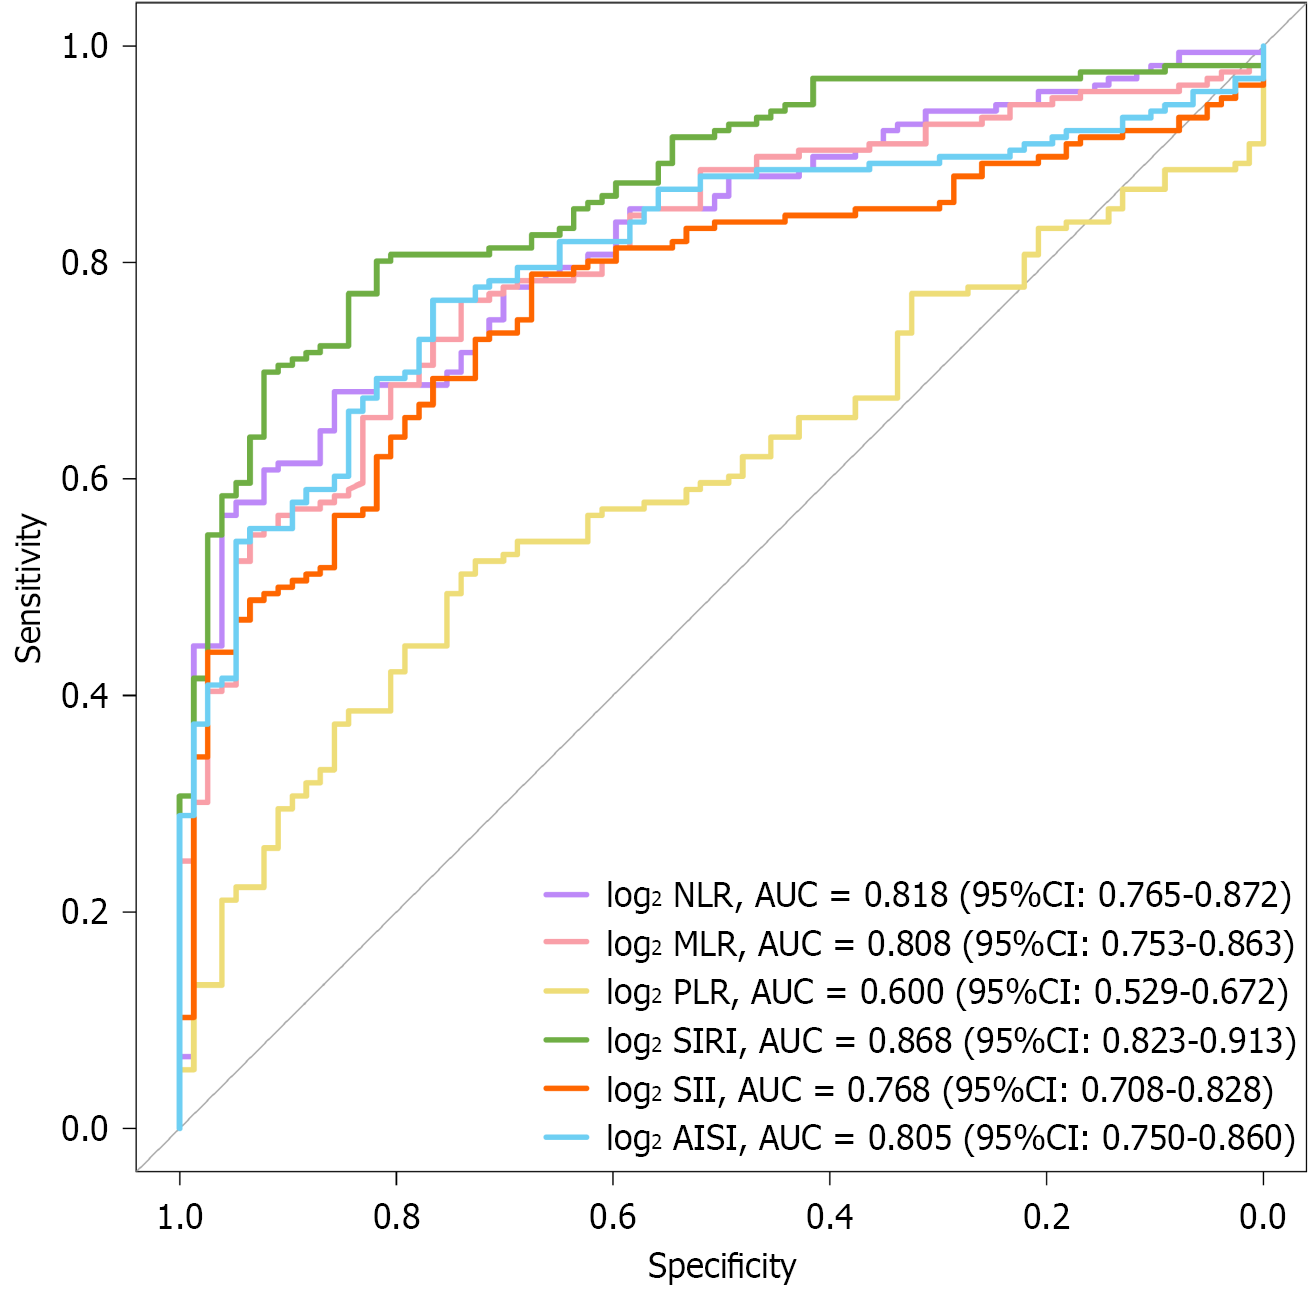
Figure 2 Receiver operating characteristic curves for complete blood count-derived inflammatory marker as a predictor of gastric ulcer.
AUC: Area under curve; CI: Confidence interval; NLR: Neutrophil-to-lymphocyte ratio; MLR: Monocyte-to-lymphocyte ratio; PLR: Platelet-to-lymphocyte ratio; SIRI: Systemic inflammatory response index; SII: Systemic immune-inflammation index; AISI: Aggregate index of systemic inflammation.
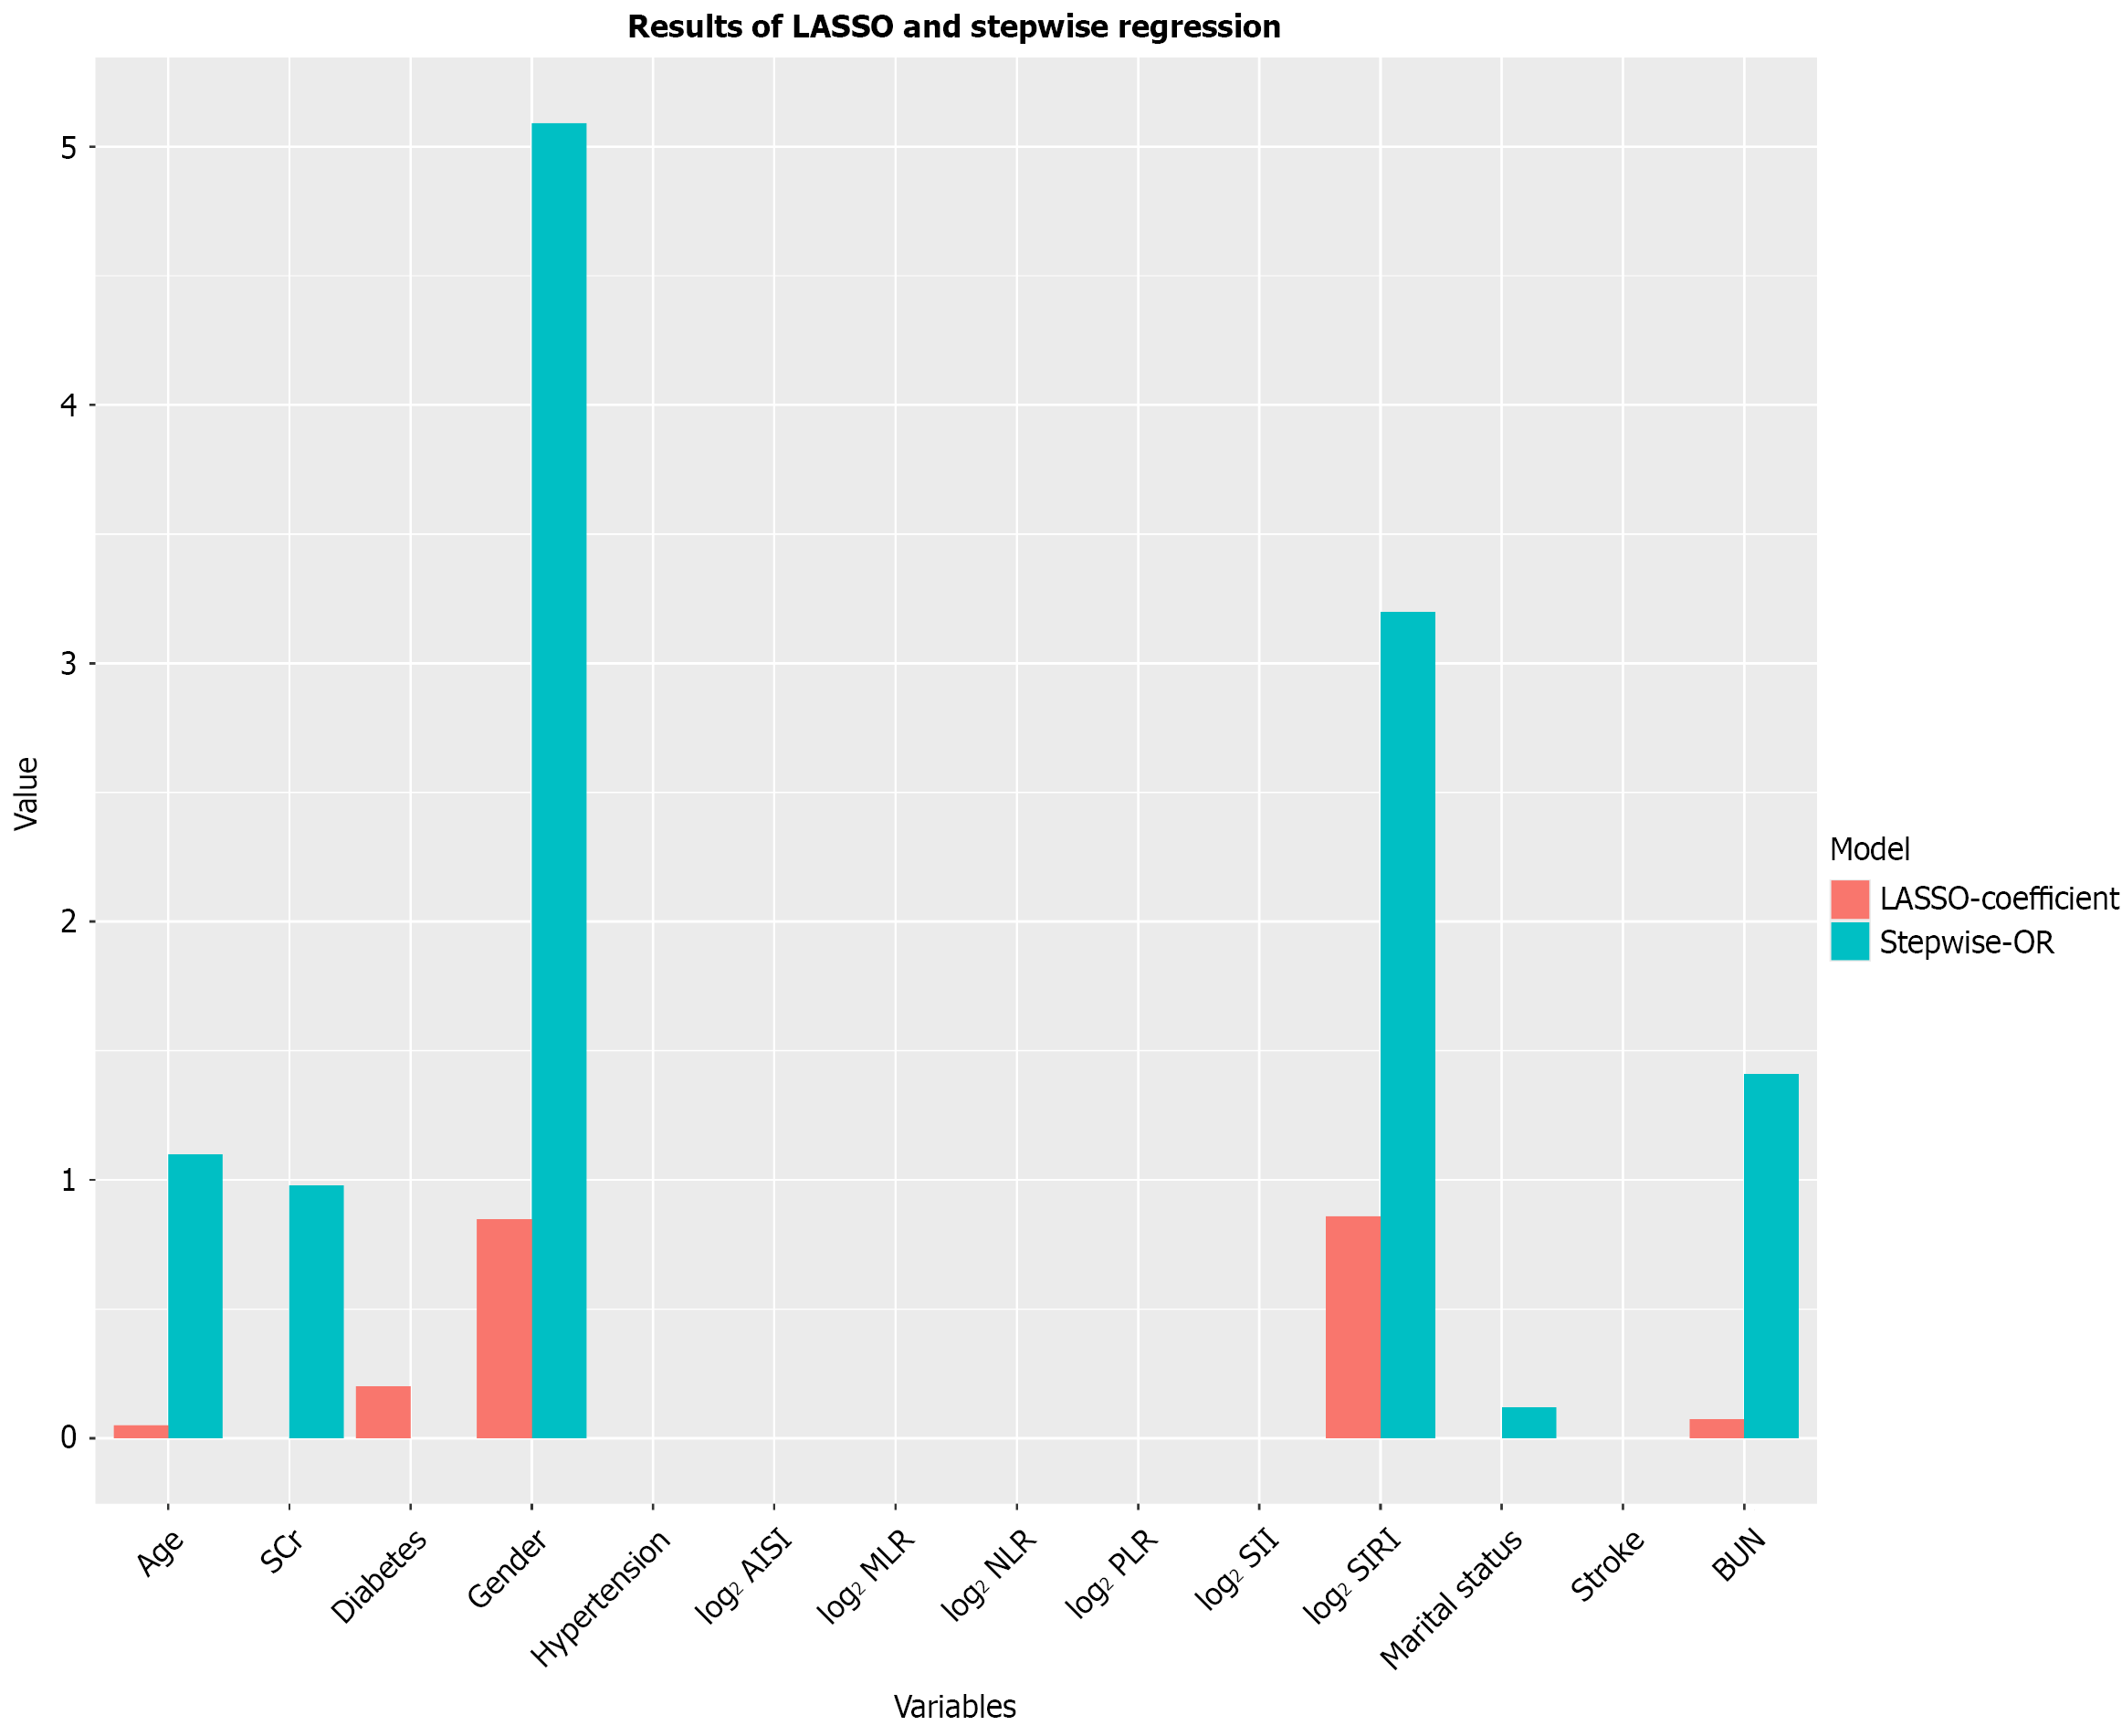
Figure 3 Screening of variables based on least absolute shrinkage and selection operator and stepwise regression.
OR: Odds ratio; SCr: Serum creatinine; BUN: Blood urea nitrogen; NLR: Neutrophil-to-lymphocyte ratio; MLR: Monocyte-to-lymphocyte ratio; PLR: Platelet-to-lymphocyte ratio; SIRI: Systemic inflammatory response index; SII: Systemic immune-inflammation index; AISI: Aggregate index of systemic inflammation.
- Citation: Shen Q, Sun ZH, Xu YM, Hu QB, Zhang WH, Huang SA. Associations between complete-blood-count-derived inflammatory markers and gastric ulcer: A cross-sectional study. World J Gastroenterol 2025; 31(38): 111298
- URL: https://www.wjgnet.com/1007-9327/full/v31/i38/111298.htm
- DOI: https://dx.doi.org/10.3748/wjg.v31.i38.111298


