Copyright
©The Author(s) 2025.
World J Gastroenterol. Sep 14, 2025; 31(34): 109900
Published online Sep 14, 2025. doi: 10.3748/wjg.v31.i34.109900
Published online Sep 14, 2025. doi: 10.3748/wjg.v31.i34.109900
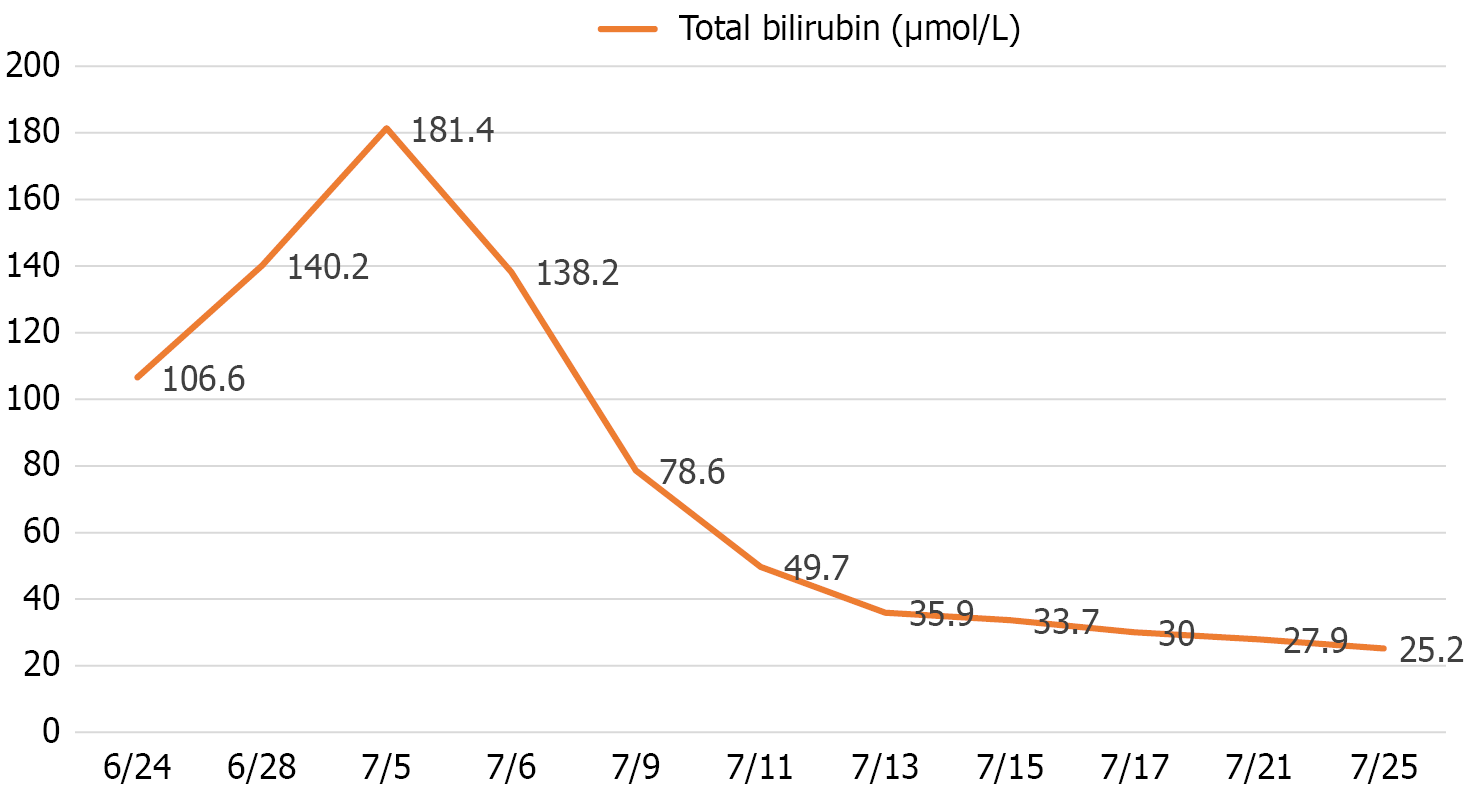
Figure 1 Changes of the serum total bilirubin level of the patient.
The pre-operation total bilirubin level was pathologically elevated (181.4 μmol/L before the operation). The total bilirubin level decreased dramatically after the endoscopic ultrasound-guided hepaticogastrostomy process, assuming success of the operation, and maintained around 30 μmol/L after the operation.
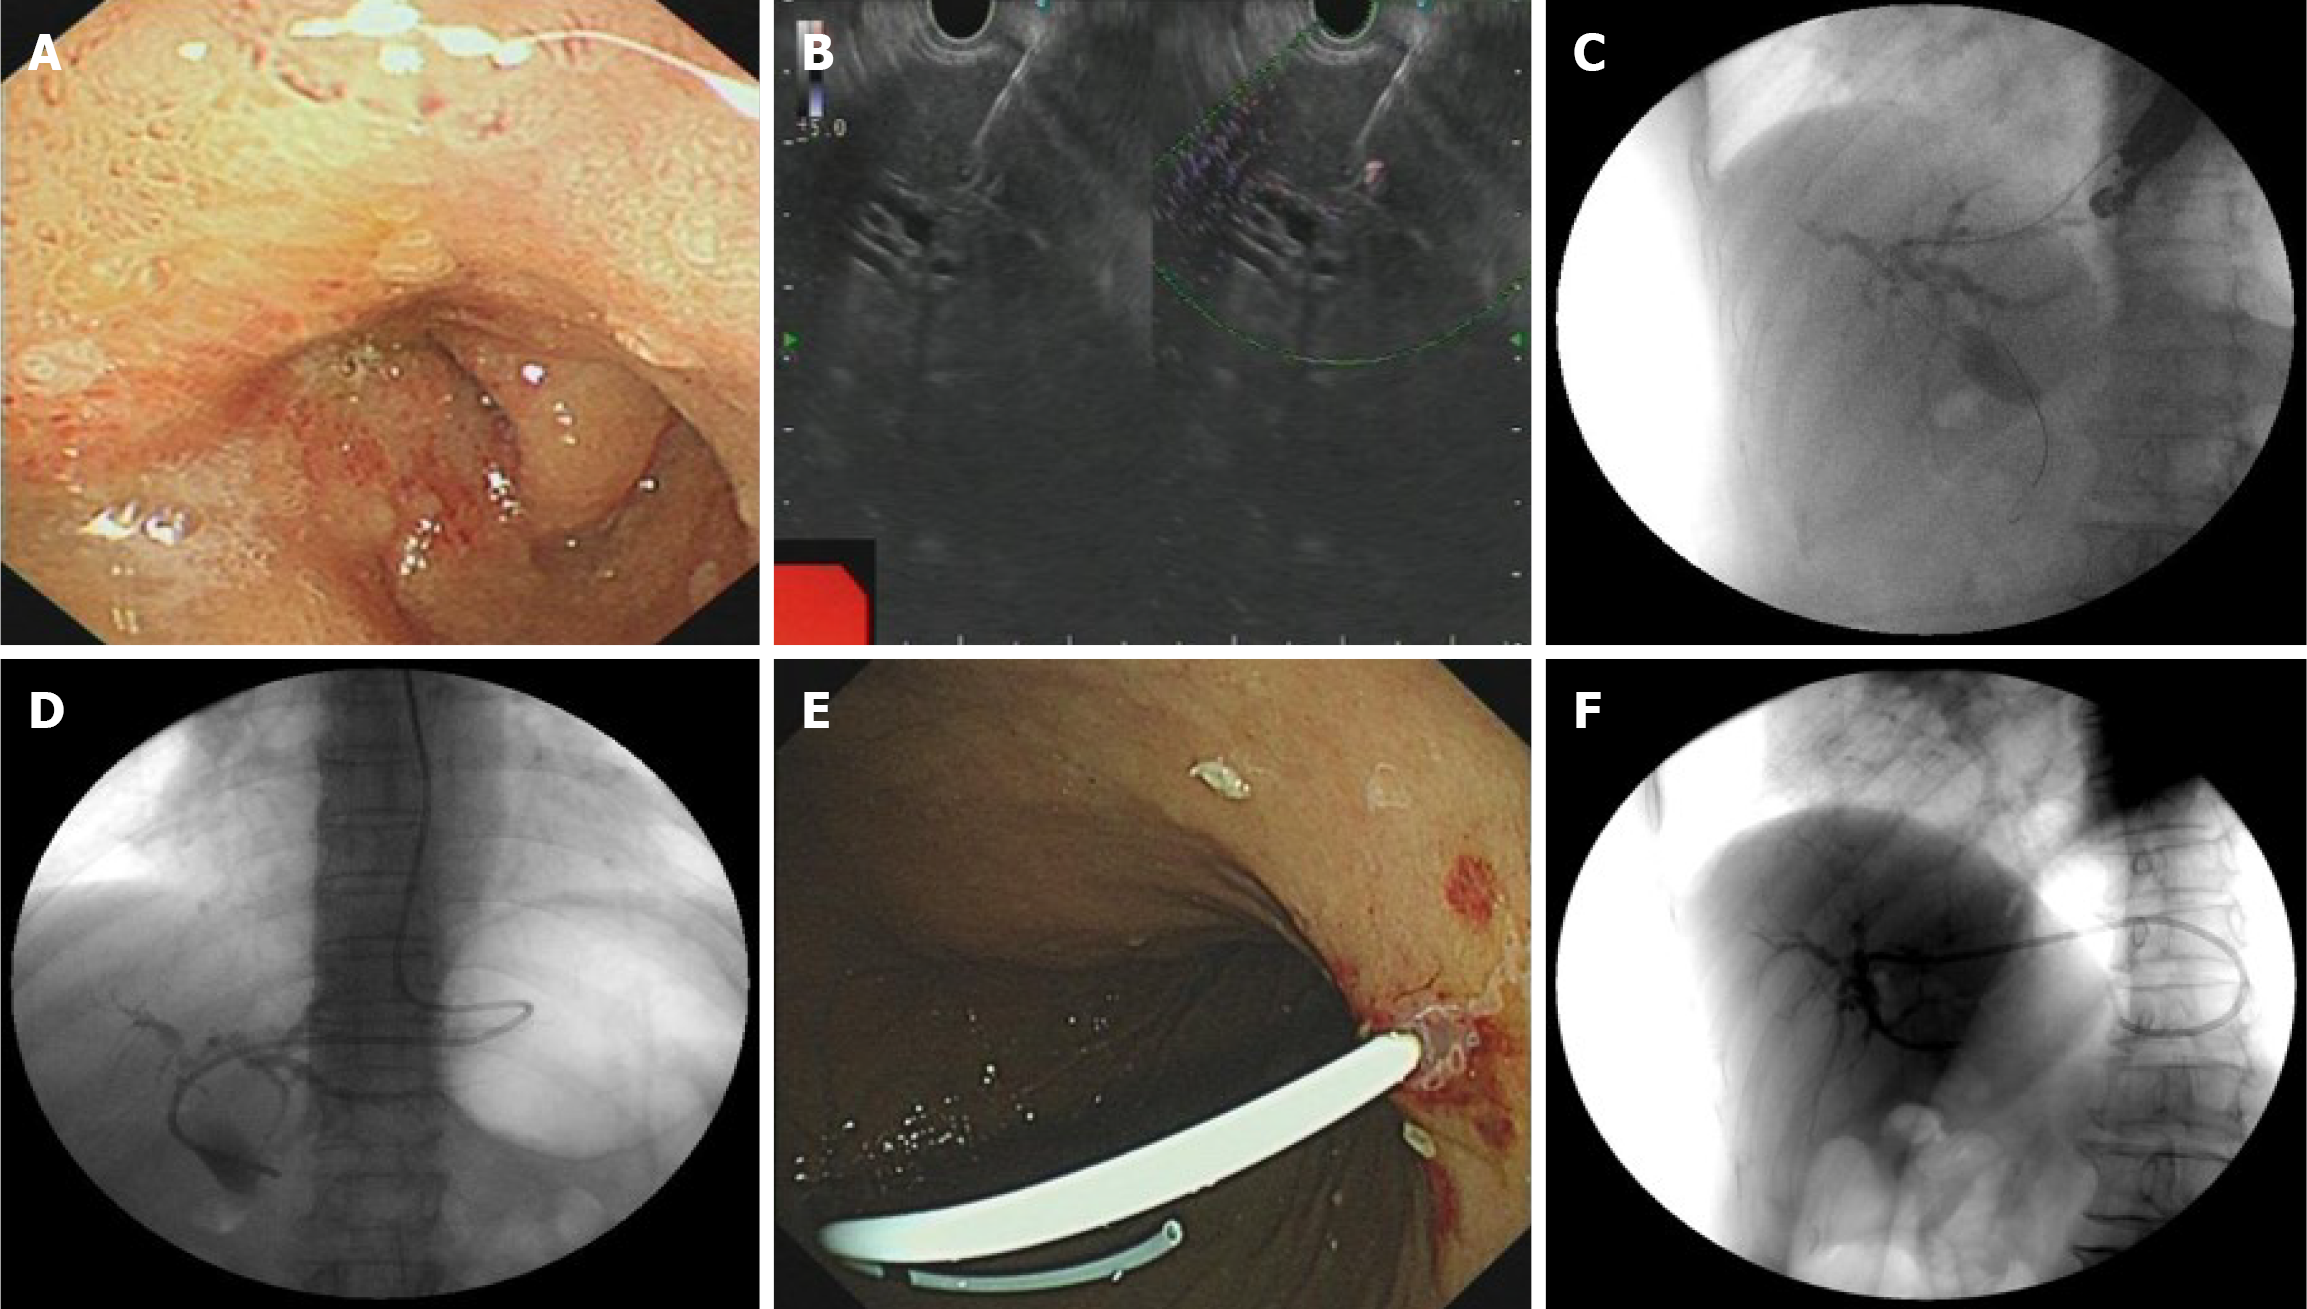
Figure 2 The Endoscopic ultrasound-guided hepaticogastrostomy process and the stent position after the operation.
A: Duodenal obstruction in the patient. Endoscopic view showing stenosis in the descending duodenum, precluding endoscopic retrograde cholangiopancreatography cannulation; B: Transgastric needle puncture. Ultrasonographic endoscopic puncture of the intrahepatic S2 segmental bile duct through the upper posterior wall of the gastric body under the cardia; C: Contrast injection. Successful injection of contrast agent (30% biligrafin) confirmings intrahepatic ductal access; D: Nasobiliary drainage placement; E: Snipped nasal bile duct for stent drainage; F: Final stent position under X-ray.
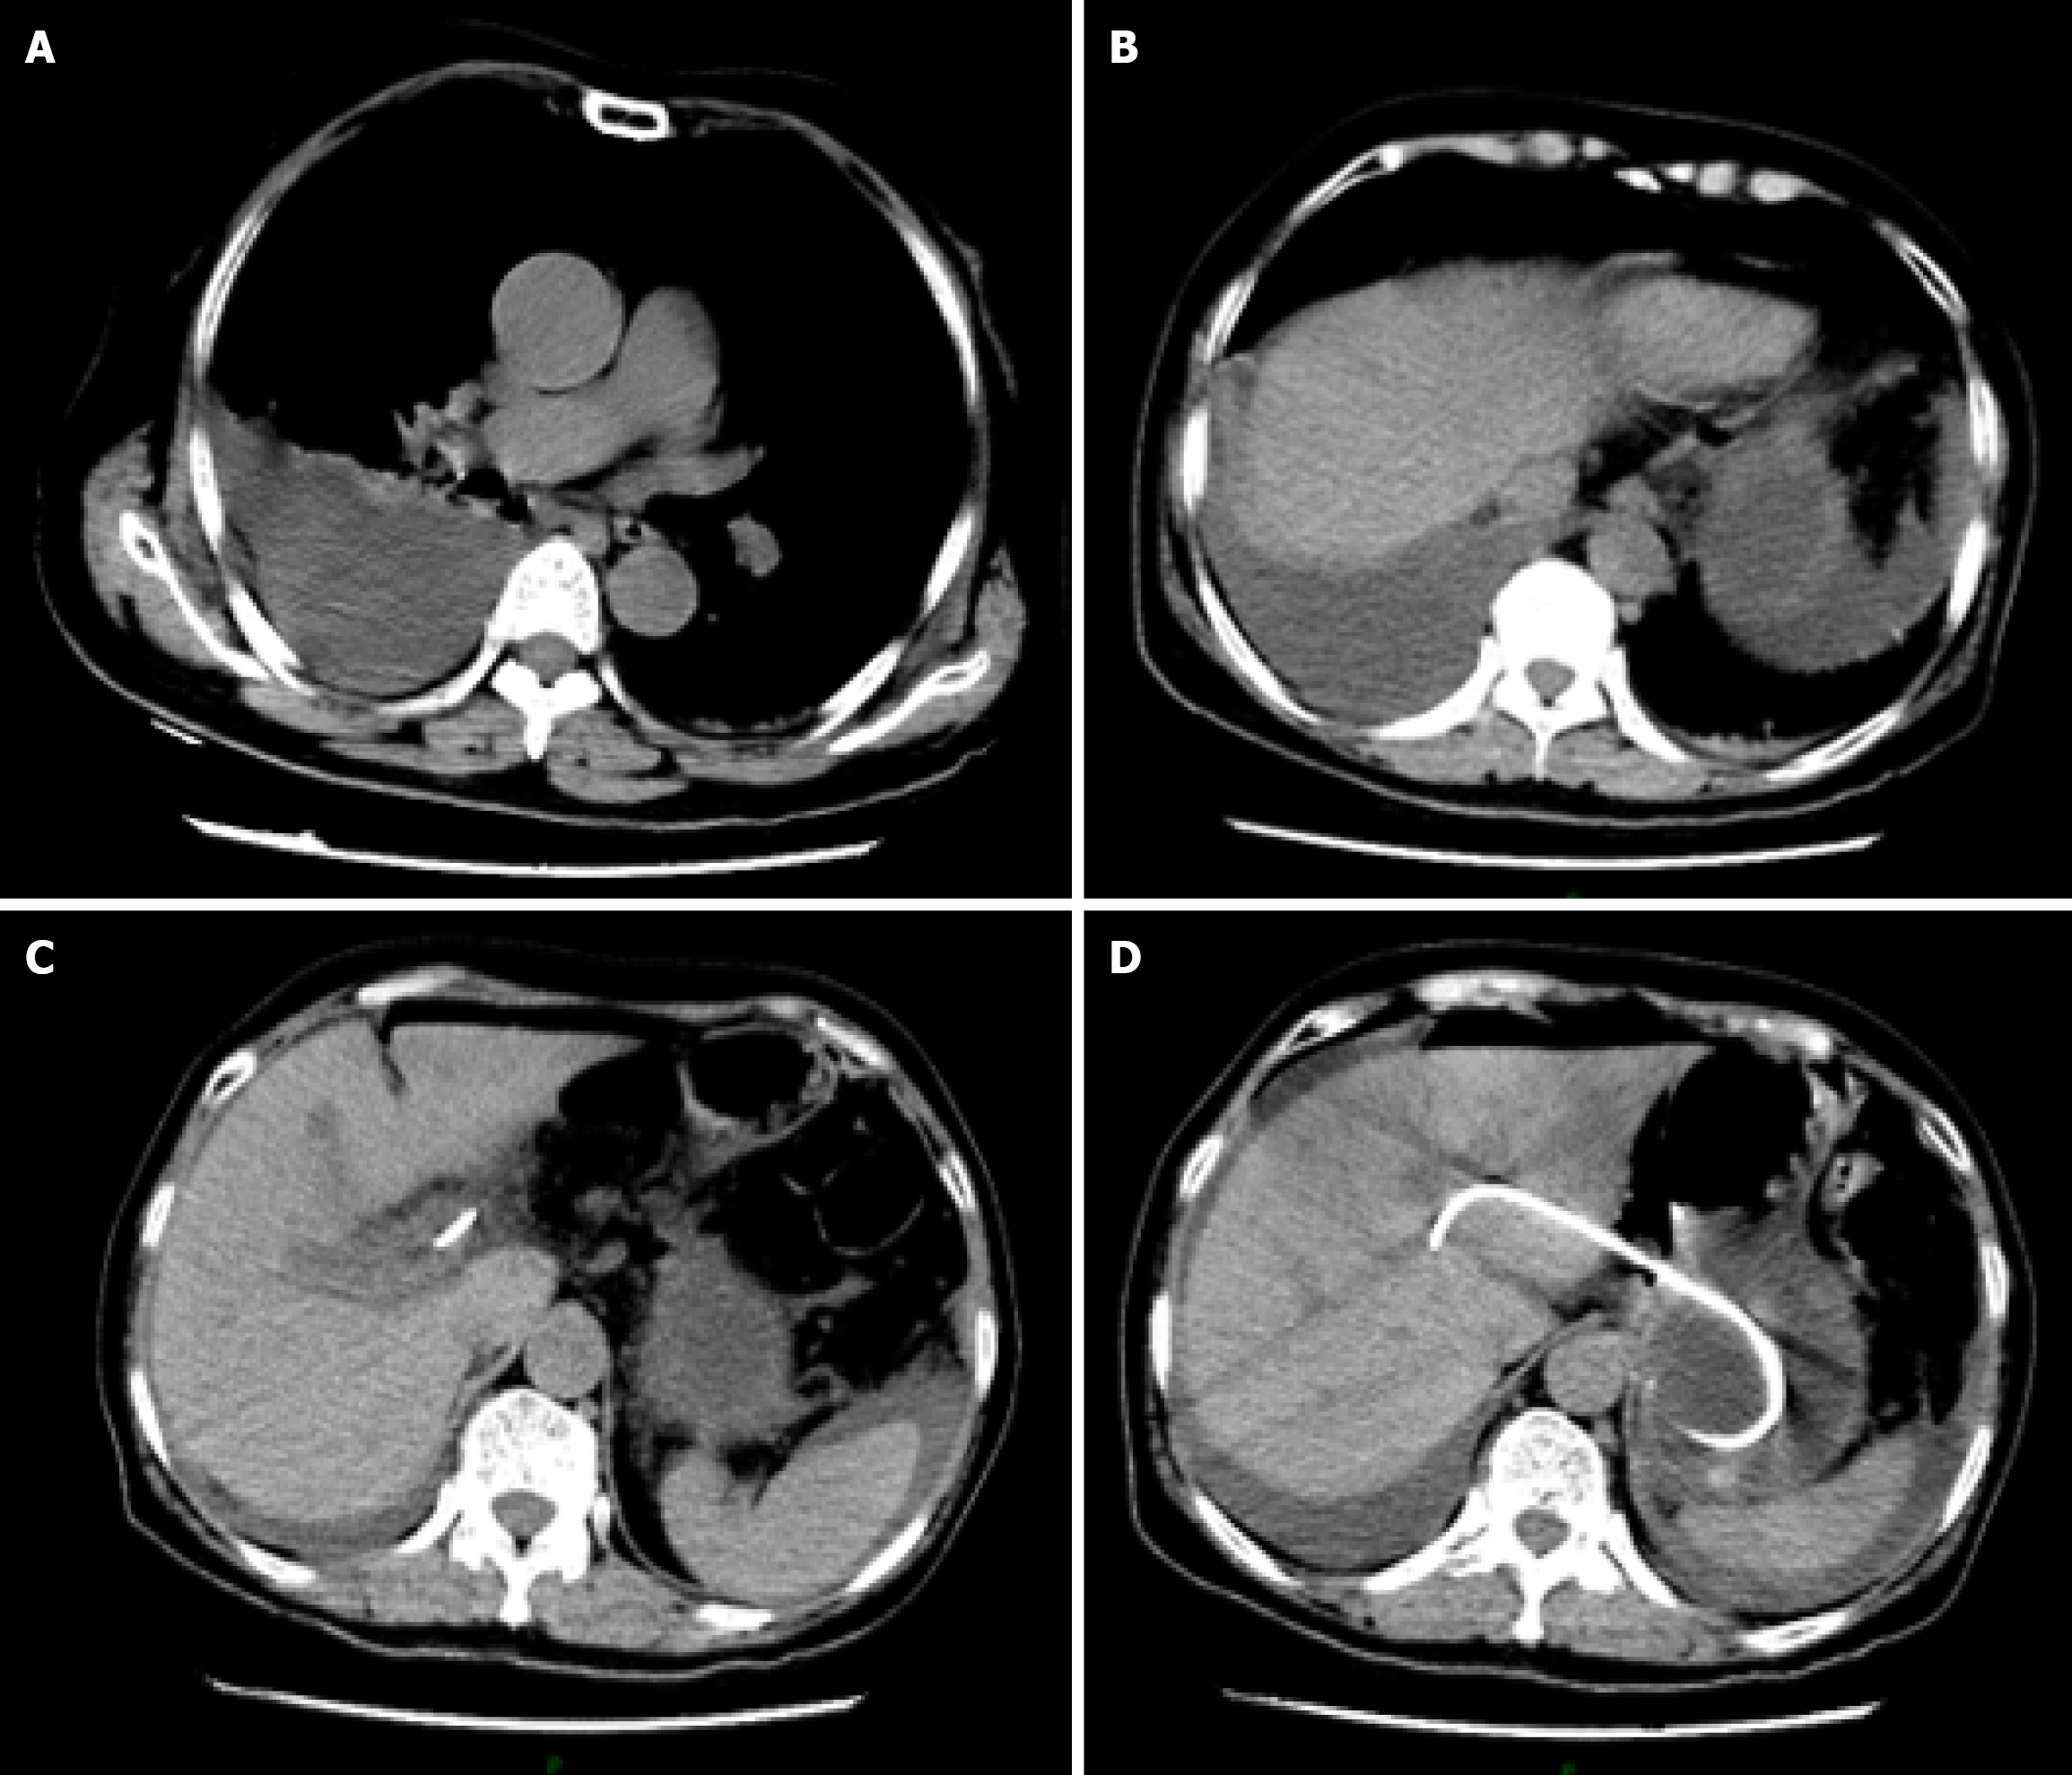
Figure 3 Emergency computed tomography scan of the patient on the second postoperative day.
Computed tomography results suggested right pleural effusion and right lower lobe lung atelectasis. The stent remained well-positioned, excluding the possibility of stent migration. A: Chest-level axial view of the patient. Density fluid opacity is identified in the right pleural cavity, occupying part of the thoracic space, consistent with right pleural effusion. The right lung tissue, compressed by the effusion, shows reduced volume and increased density, demonstrating atelectasis, with distorted and aggregated lung markings and loss of normal lung expansion morphology; B: Upper abdominal-level view of the patient. The fluid-density opacity persists in the right pleural cavity, indicating the extent of the pleural effusion. The right lung atelectasis continues, with the lung tissue compression pattern similar to that observed in view; C: Mid abdominal-level view of the patient: The shapes, sizes, and densities of upper abdominal solid organs (e.g., liver, spleen, pancreas) are approximately normal. The hollow organs (e.g., gastrointestinal tract) show normal course and morphology, without significant dilation or abnormal density; D: A stent-like foreign body shadow is visualized within the body, it remains well-positioned, same as the location of intraoperative implantation, excluding the possibility of stent migration.
Figure 4 Abnormal pleural effusion and urine color.
A: Dark green pleural effusion (left bigger arrow) and unexplained dark green urine drained out by catheterization (right smaller arrow); B: The unexplained dark green urine turned to normal color spontaneously after intravenous treatment every afternoon (right smaller arrow).
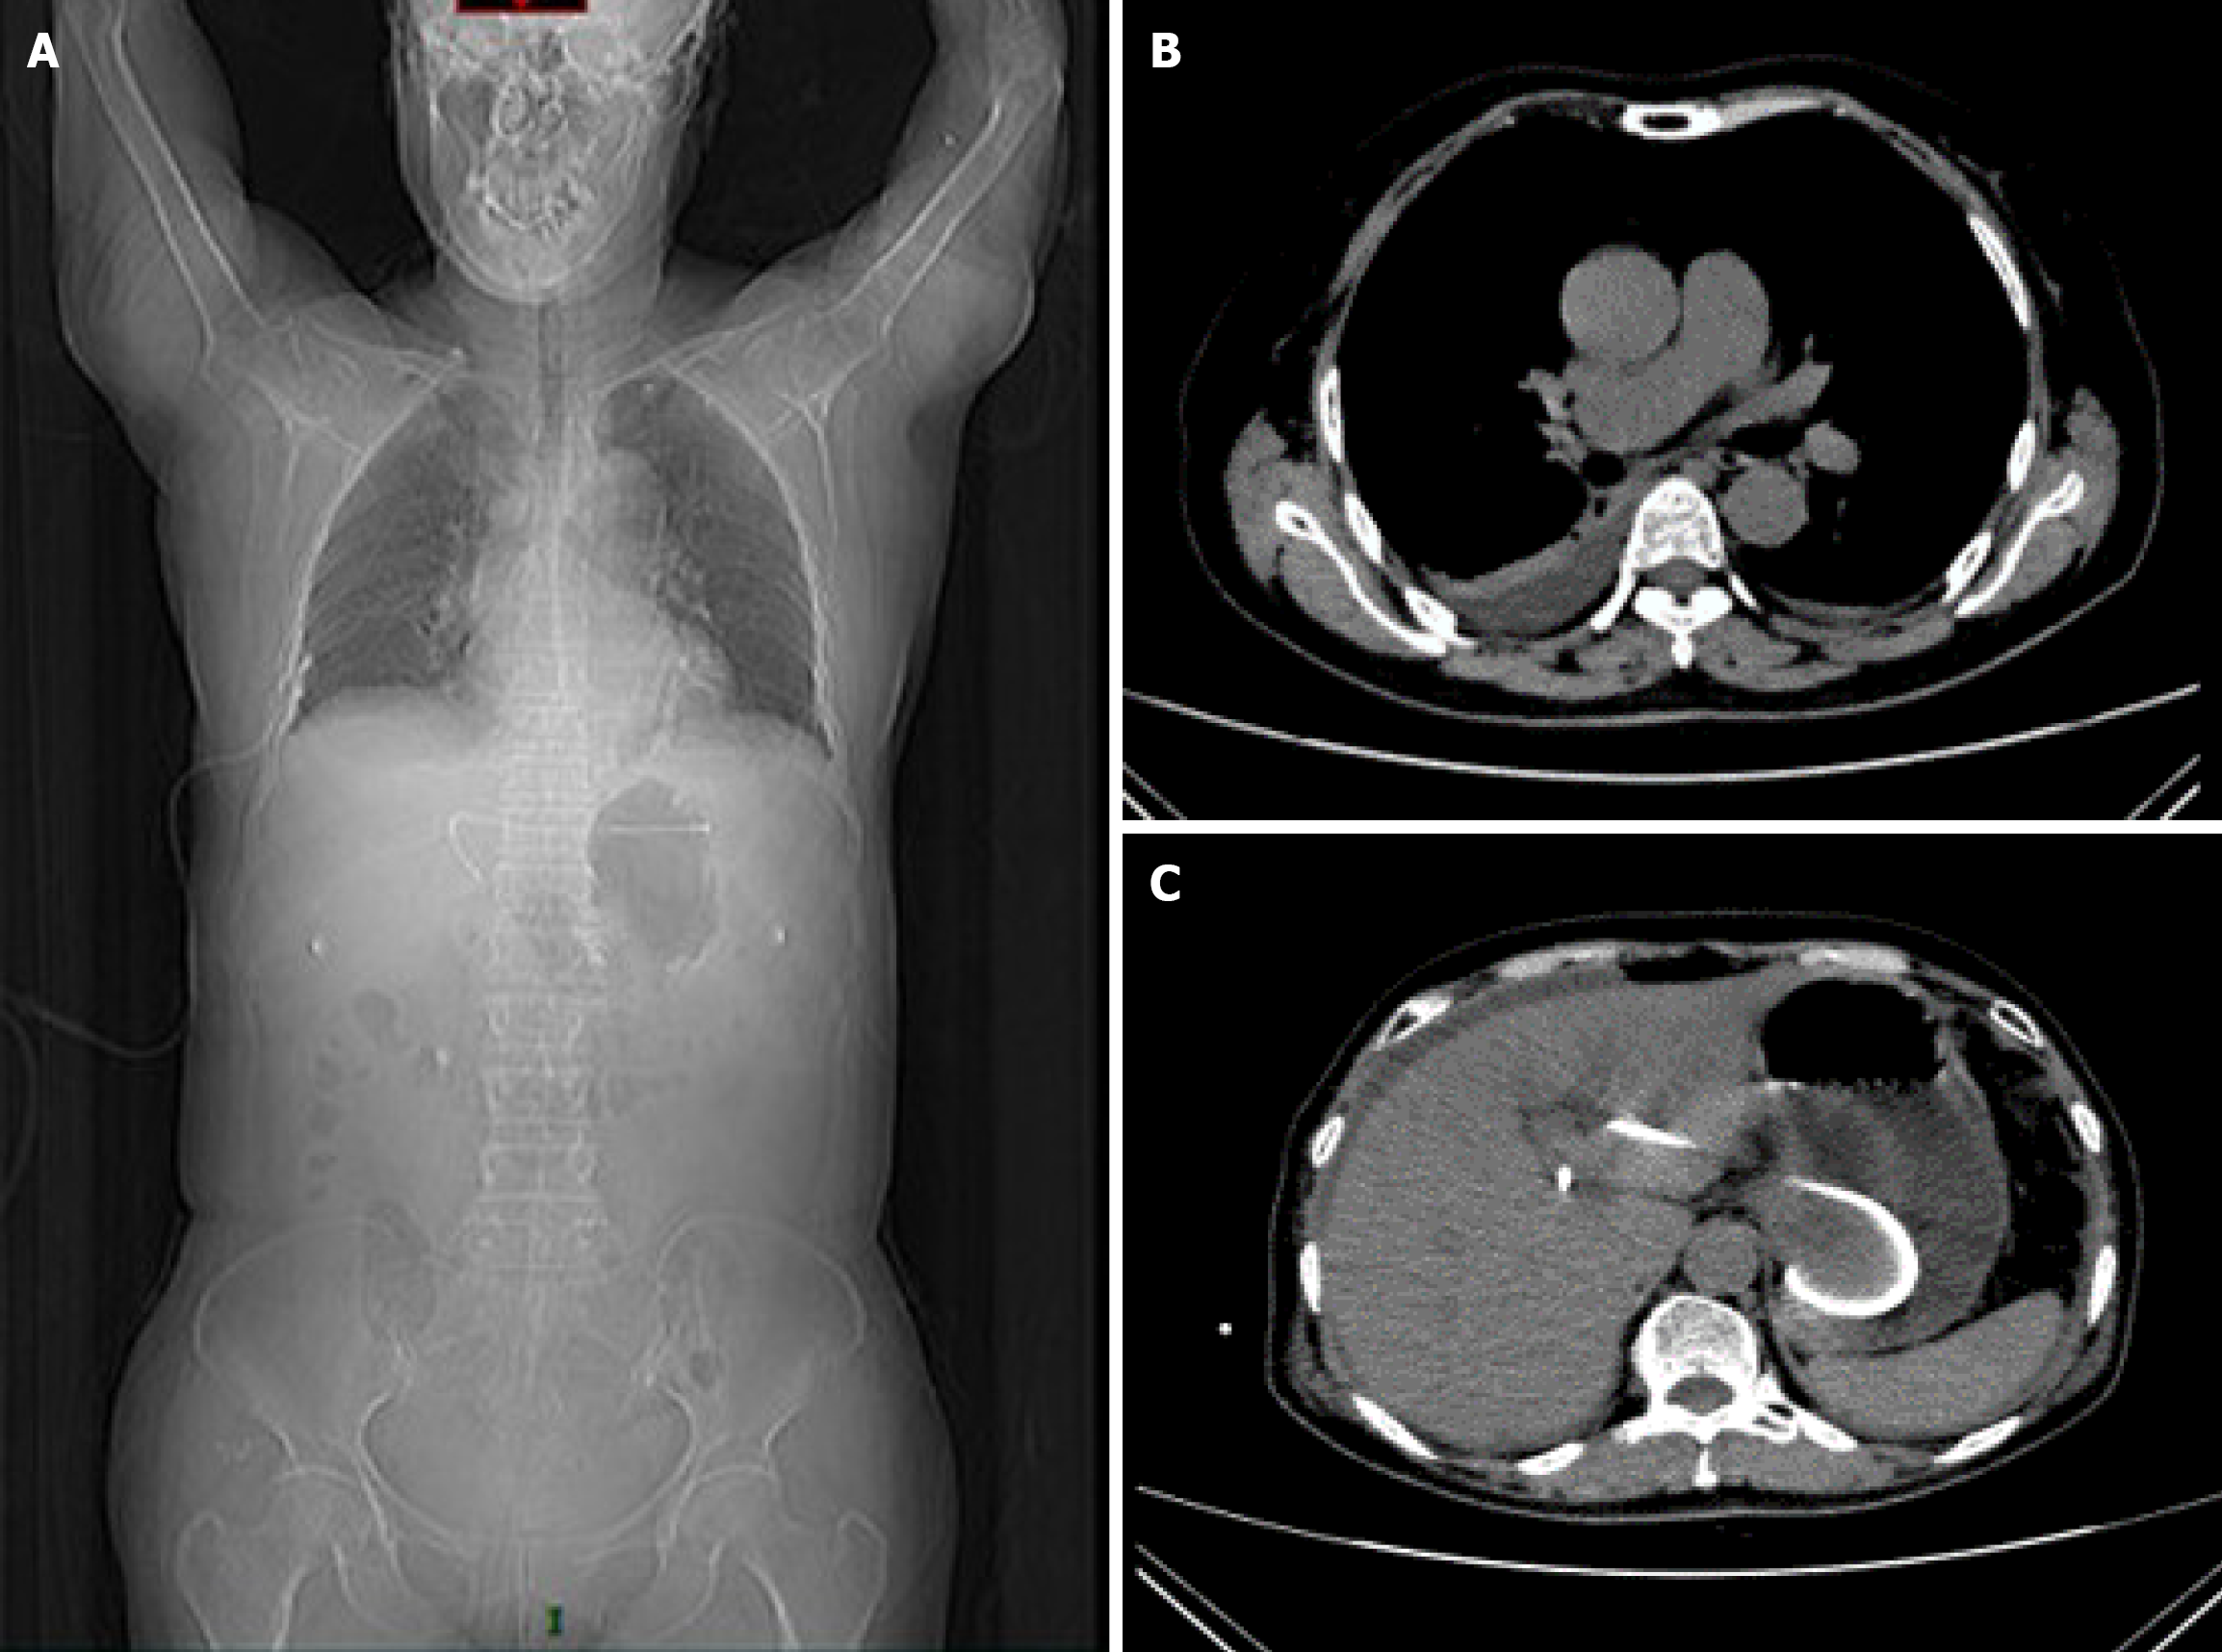
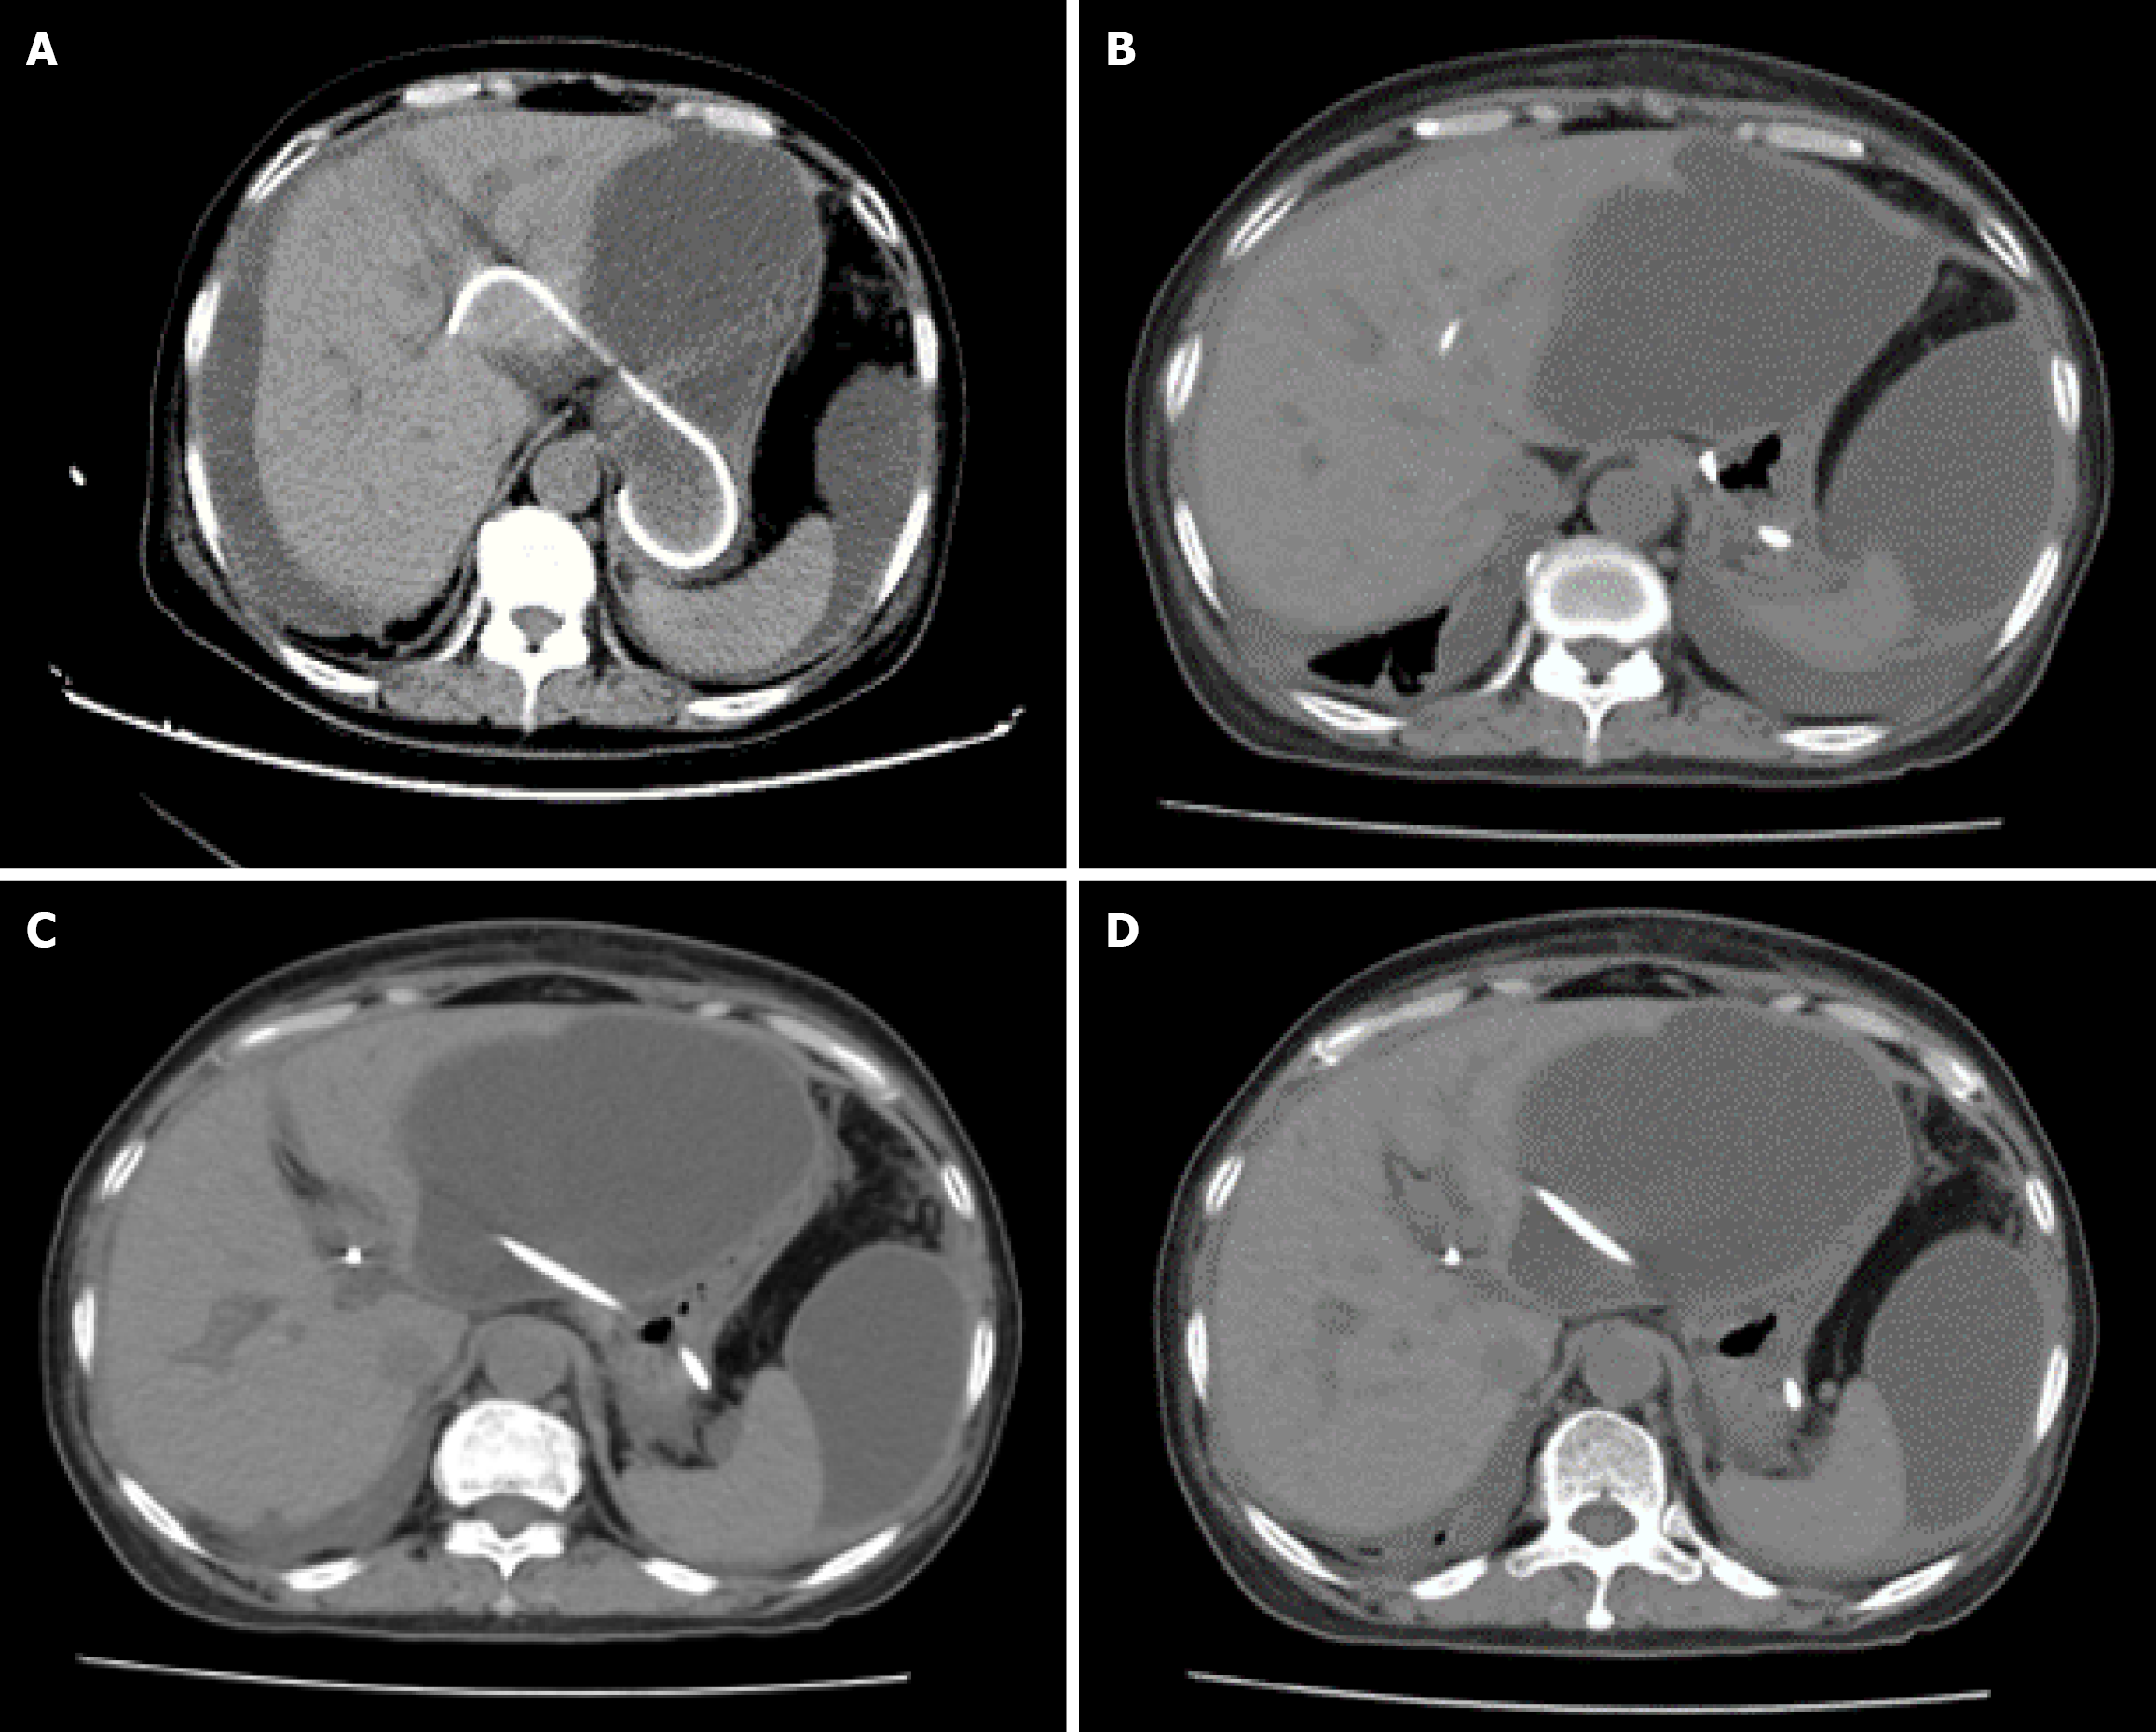
Figure 5 computed tomography scan on postoperative day 7.
A: A significant increase of bile masses was found in the abdominal cavity, and the previous pleural effusion basically had disappeared; B and C: Position of the stent under X-ray and computed tomography scan.
Figure 6 computed tomography scan on postoperative day 17.
A: Position of the stent; B and C: Computed tomography scan indicated partially encapsulated ascites in the abdominal cavity and pelvis; D: The volume of the ascites was larger than the previous, and most were concentrated around the liver.
- Citation: Zhang KY, He Q, Jin Y, Liu J, Lin R, Han CQ. Dark green urine following endoscopic ultrasound-guided hepaticogastrostomy: A case report. World J Gastroenterol 2025; 31(34): 109900
- URL: https://www.wjgnet.com/1007-9327/full/v31/i34/109900.htm
- DOI: https://dx.doi.org/10.3748/wjg.v31.i34.109900


