Copyright
©The Author(s) 2025.
World J Gastroenterol. Aug 28, 2025; 31(32): 110333
Published online Aug 28, 2025. doi: 10.3748/wjg.v31.i32.110333
Published online Aug 28, 2025. doi: 10.3748/wjg.v31.i32.110333
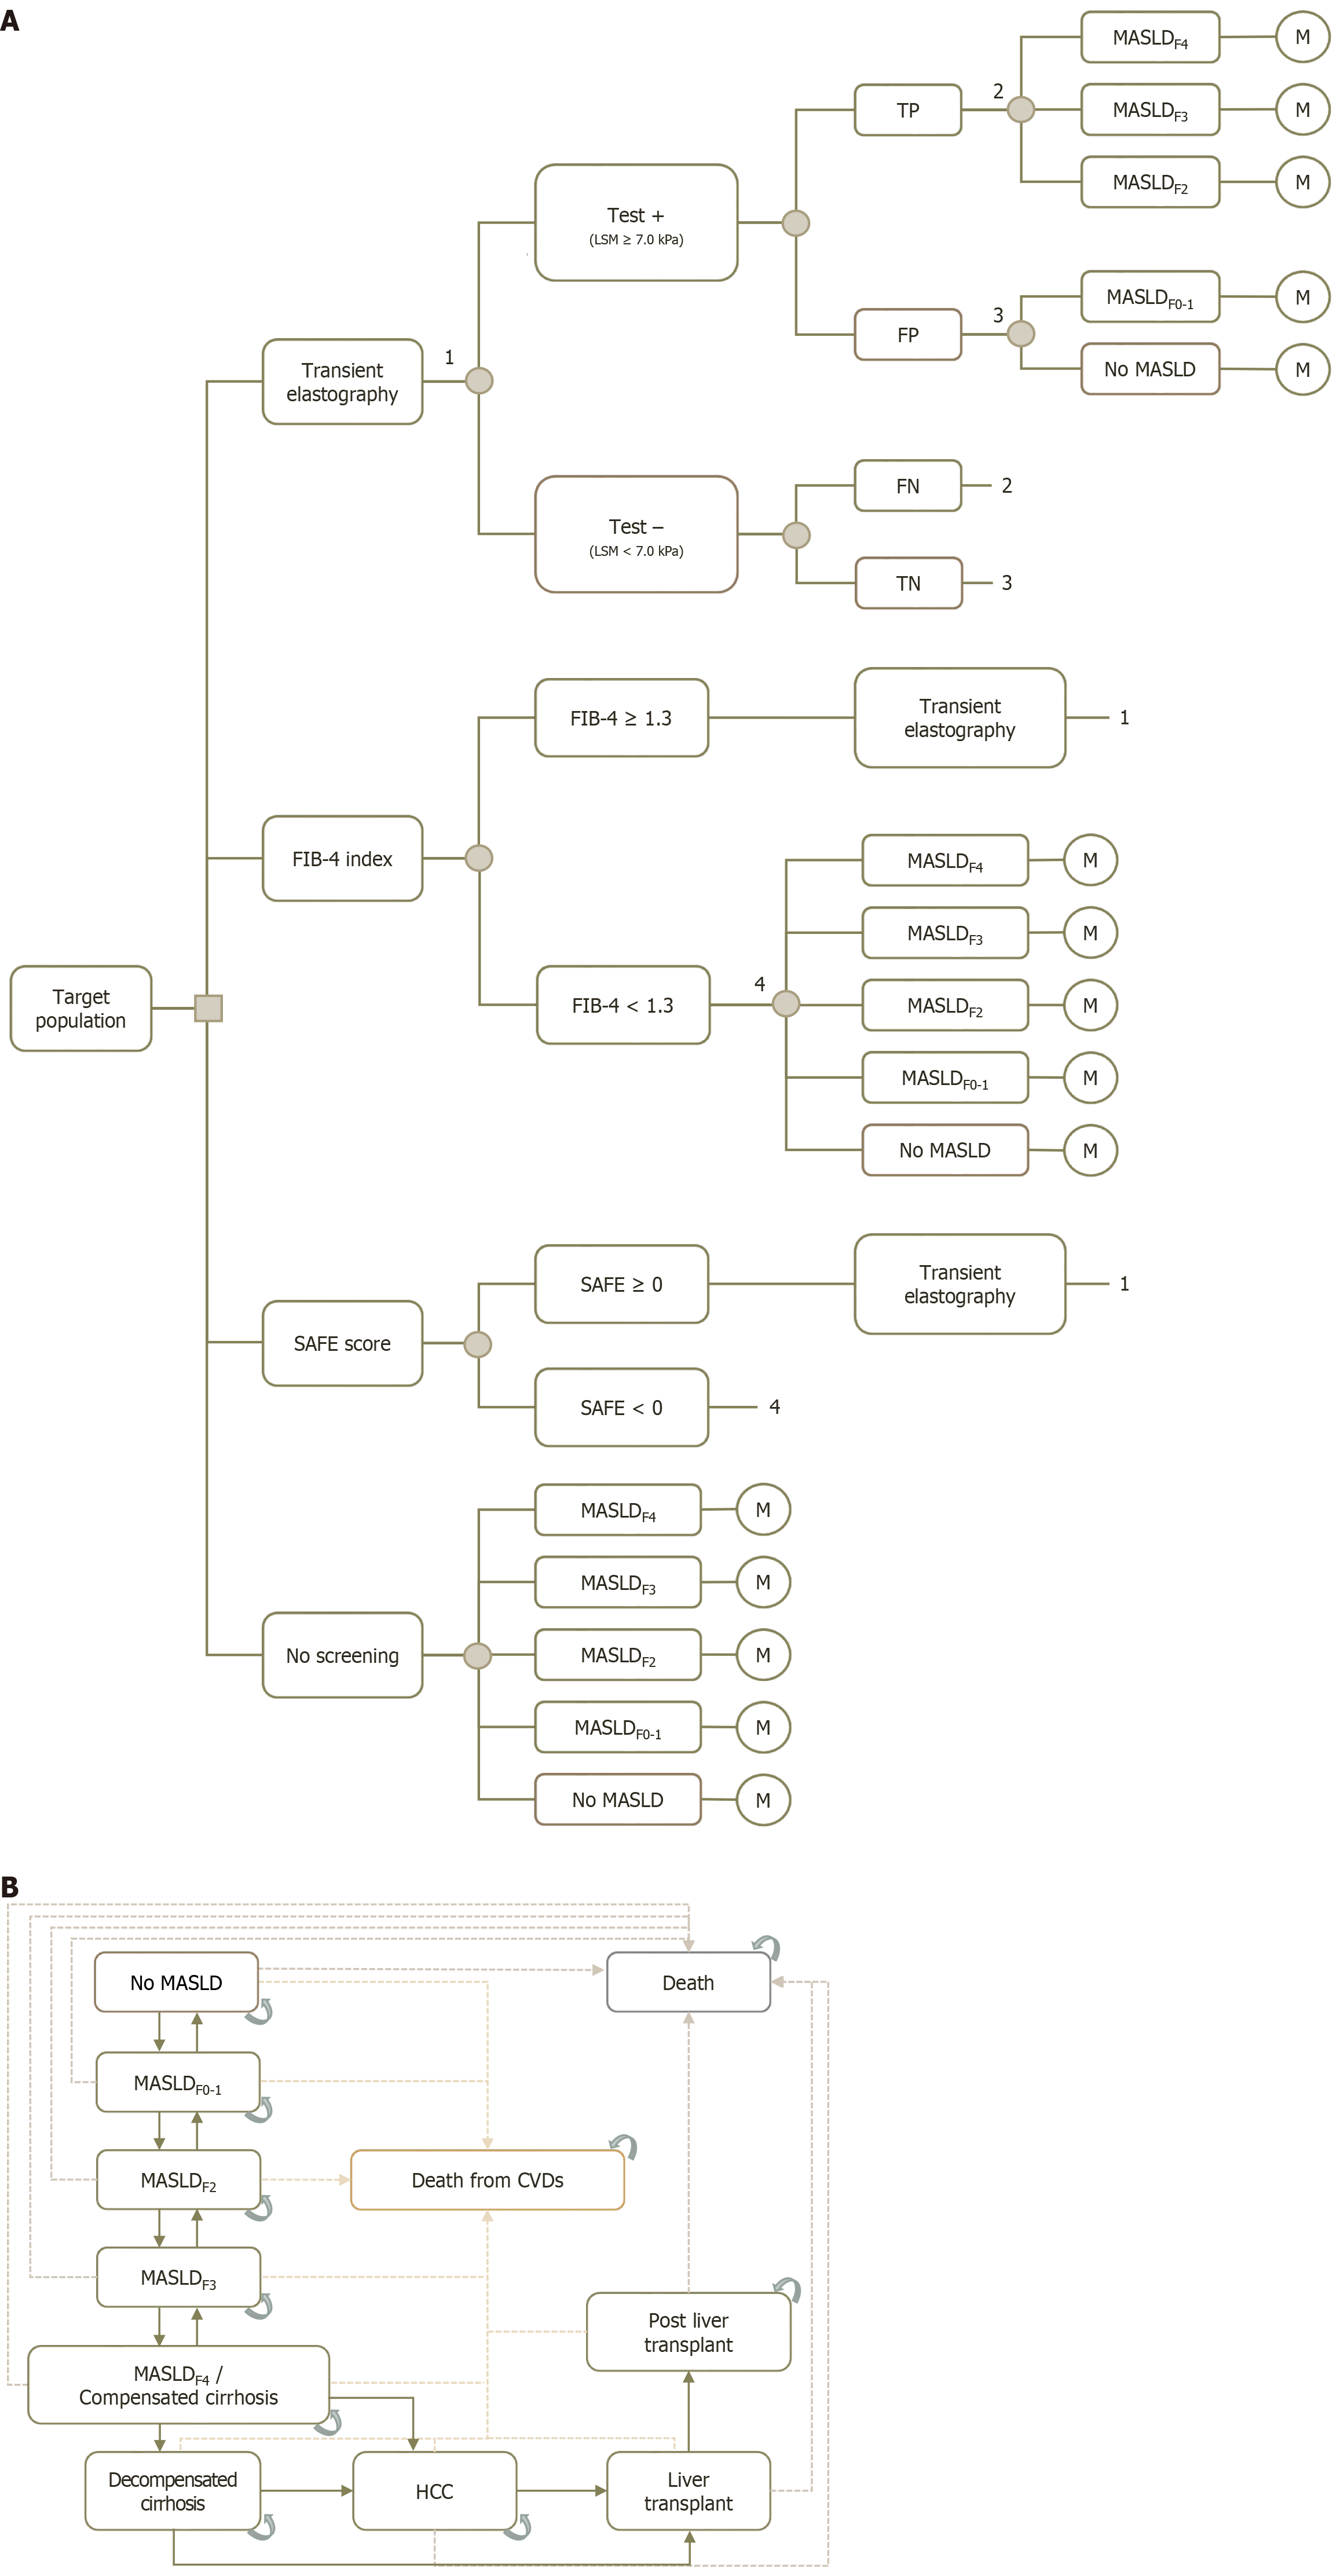
Figure 1 Models.
A: Decision tree; B: Markov model. In the decision tree, the decision node is represented by a square symbol, while chance nodes are depicted using circle symbols. In the Markov model, rounded rectangles represent possible metabolic dysfunction-associated steatotic liver disease-related health states of the patients. The "death" health states encompass mortality from all causes. Arrows indicate the possible pathways that patients may transition through within the model. Solid line arrows represent transitional probabilities, dashed arrows represent those transit to the death states. 1Test results from transient elastography. 2Outcomes following true positive (TP) and false negative (FN) results from transient elastography. 3Outcomes following false positive (FP) and true negative (TN) results from transient elastography. 4Outcomes of patients with scores below the cutoff values of the scoring systems. CVD: Cardiovascular disease; F: Fibrosis stage; HCC: Hepatocellular carcinoma; M: Markov; MASLD: Metabolic dysfunction-associated steatotic liver disease.
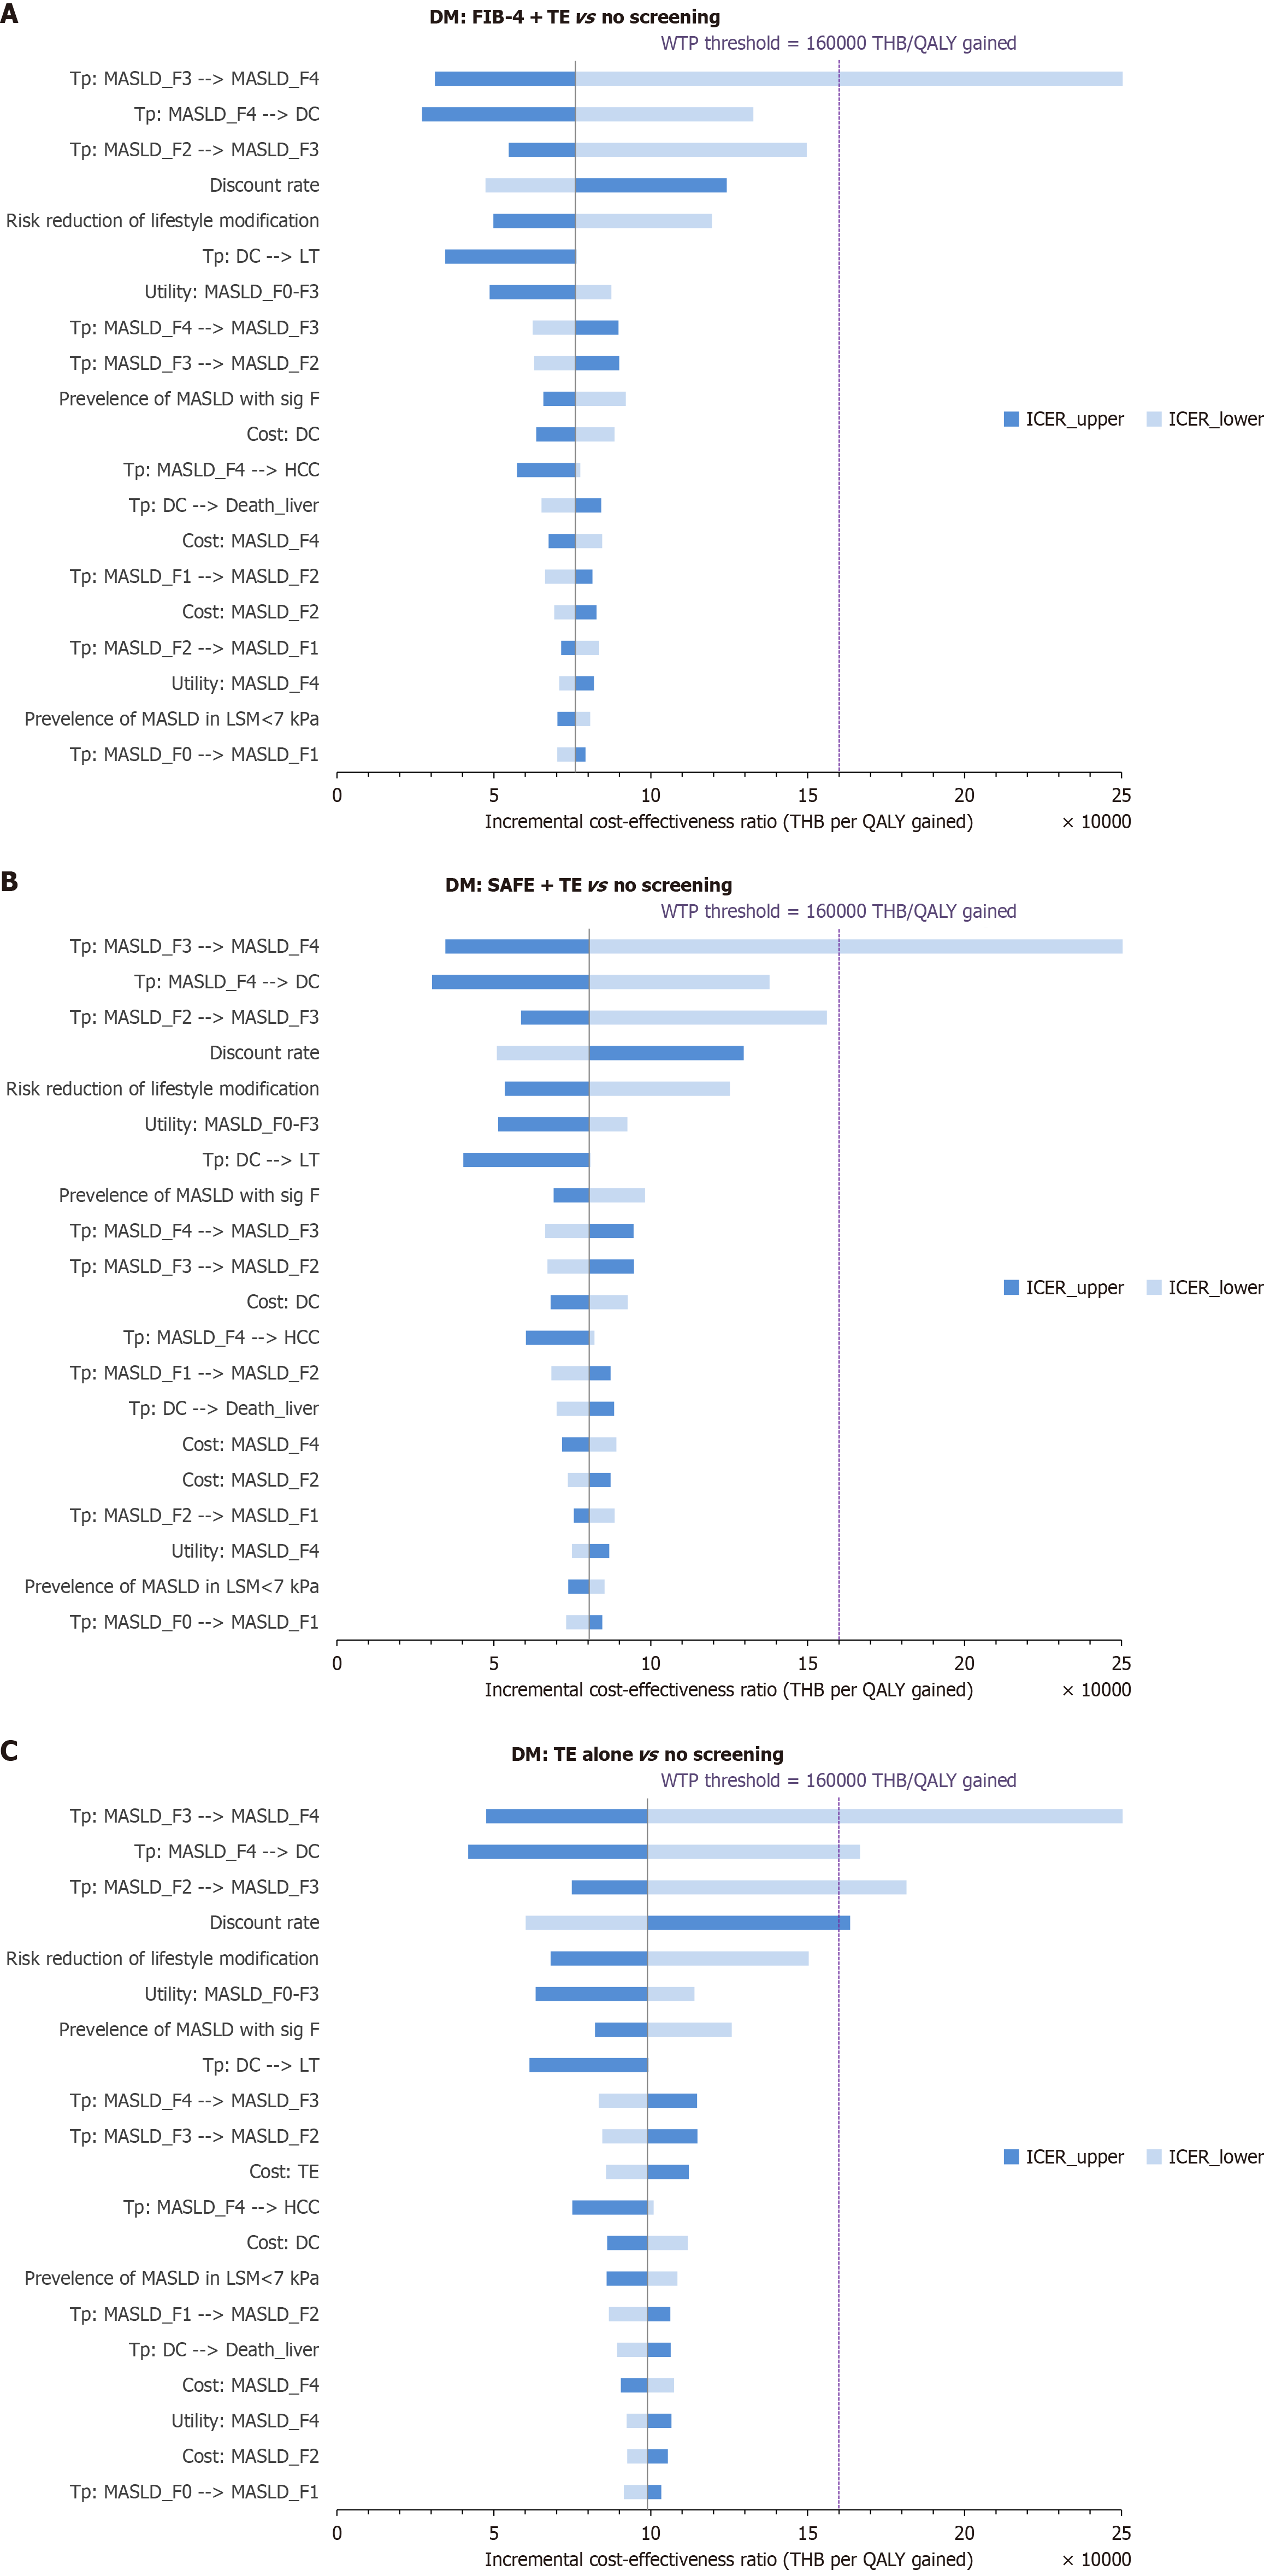
Figure 2 Tornado diagrams.
A: Fibrosis-4 + transient elastography (TE) compared to no screening; B: Steatosis-associated fibrosis estimator + TE compared to no screening; C: TE alone compared to no screening. The vertical axis ranks model parameters by their influence on the incremental cost-effectiveness ratio (ICER). Horizontal bars display the ICER span when each parameter is varied across its 95% confidence interval; bars extending left of the base-case value indicate greater cost-effectiveness, whereas bars extending right denote reduced cost-effectiveness. The dashed purple line represents the Thai willingness-to-pay threshold of 160000 Thai baht (THB)/quality-adjusted life-year (QALY) gained. DC: Decompensated cirrhosis; DM: Diabetes mellitus; F: Fibrosis stage; FIB-4: Fibrosis-4 index; LSM: Liver stiffness measurement; MASLD: Metabolic dysfunction-associated steatotic liver disease; SAFE: Steatosis-associated fibrosis estimator score; Tp: Transitional probability.
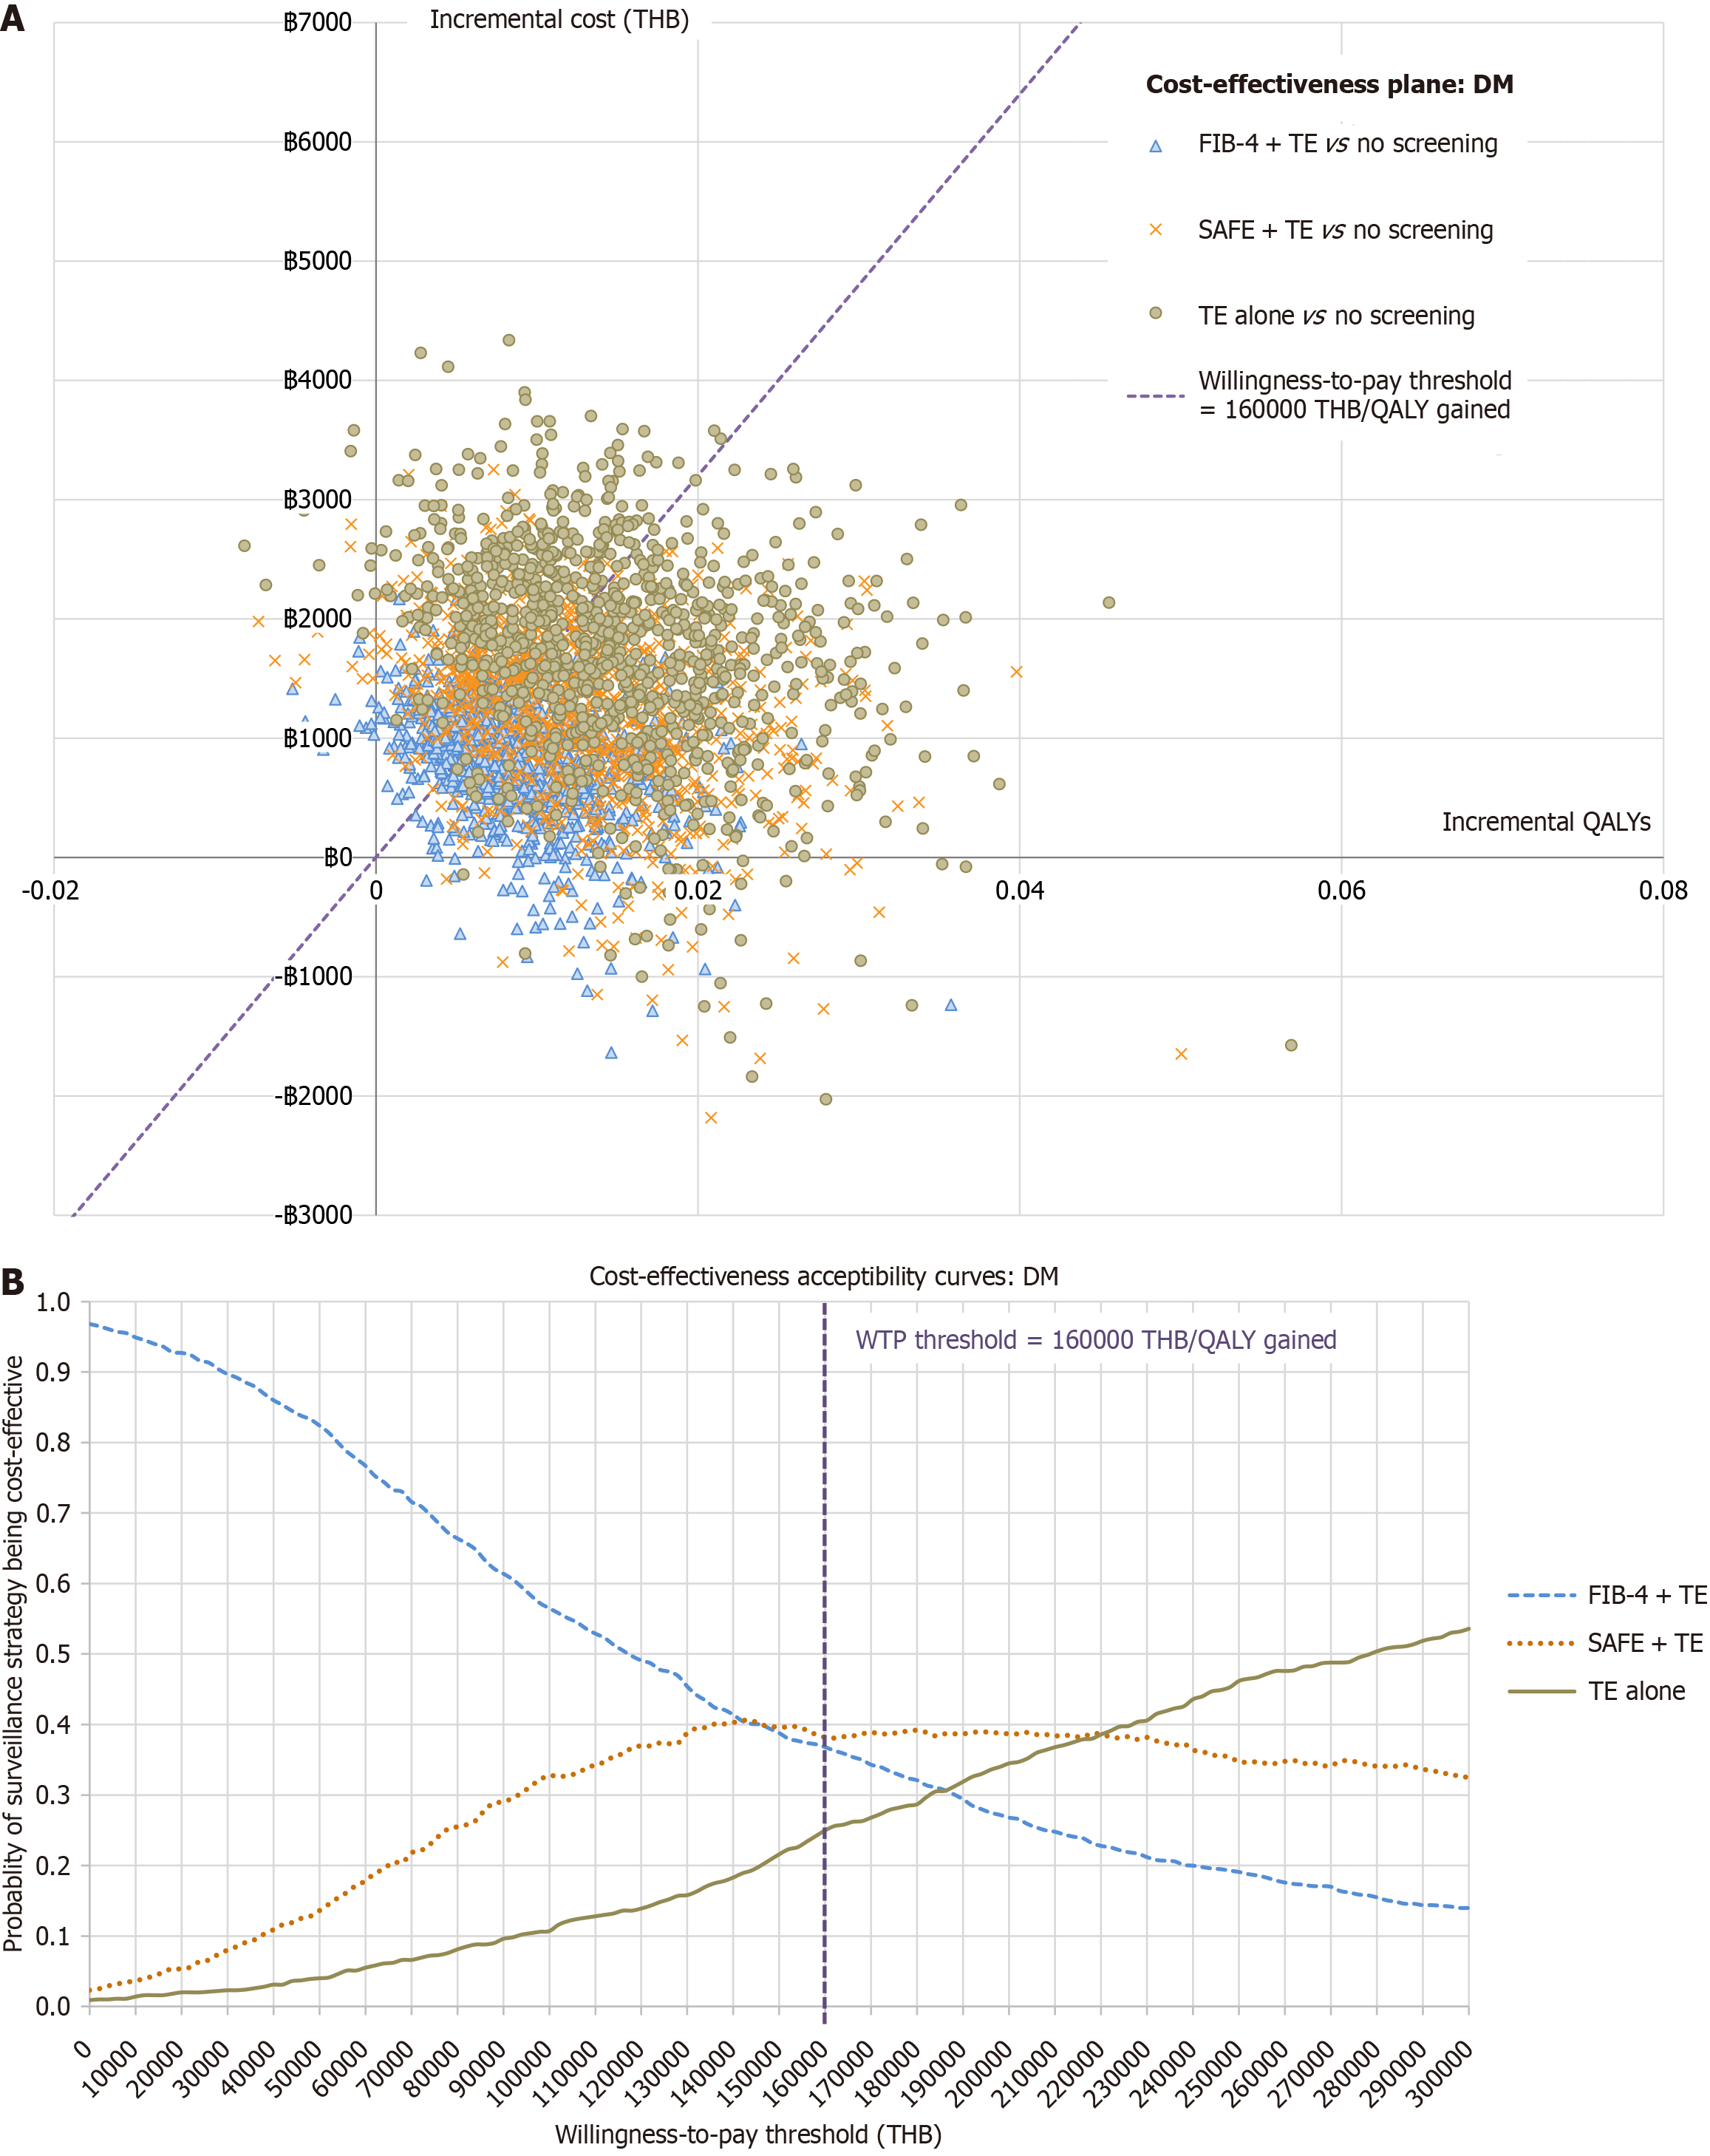
Figure 3 Probabilistic sensitivity analysis.
A: Cost-effectiveness plane plotting incremental costs (vertical axis) against incremental quality-adjusted life-years (QALYs) (horizontal axis) for each strategy vs no screening. Points below the dashed purple line (Thai willingness-to-pay threshold) are deemed cost-effective; B: Cost-effectiveness acceptability curves illustrating, across a continuum of willingness-to-pay thresholds, the probability that each strategy is cost-effective; the current Thai threshold is marked by the dashed purple line. DM: Diabetes mellitus; FIB-4: Fibrosis-4 index; SAFE: Steatosis-associated fibrosis estimator score; TE: Transient elastography; THB: Thai baht.
- Citation: Kositamongkol C, Tantiyavarong P, Ratanatawan A, Sripongpun P, Mahawithitwong P, Kositamongkol P, Saokaew S, Phisalprapa P. Cost-effectiveness of transient elastography for liver fibrosis screening in Thai patients with diabetes mellitus. World J Gastroenterol 2025; 31(32): 110333
- URL: https://www.wjgnet.com/1007-9327/full/v31/i32/110333.htm
- DOI: https://dx.doi.org/10.3748/wjg.v31.i32.110333


