Copyright
©The Author(s) 2025.
World J Gastroenterol. Aug 28, 2025; 31(32): 104277
Published online Aug 28, 2025. doi: 10.3748/wjg.v31.i32.104277
Published online Aug 28, 2025. doi: 10.3748/wjg.v31.i32.104277
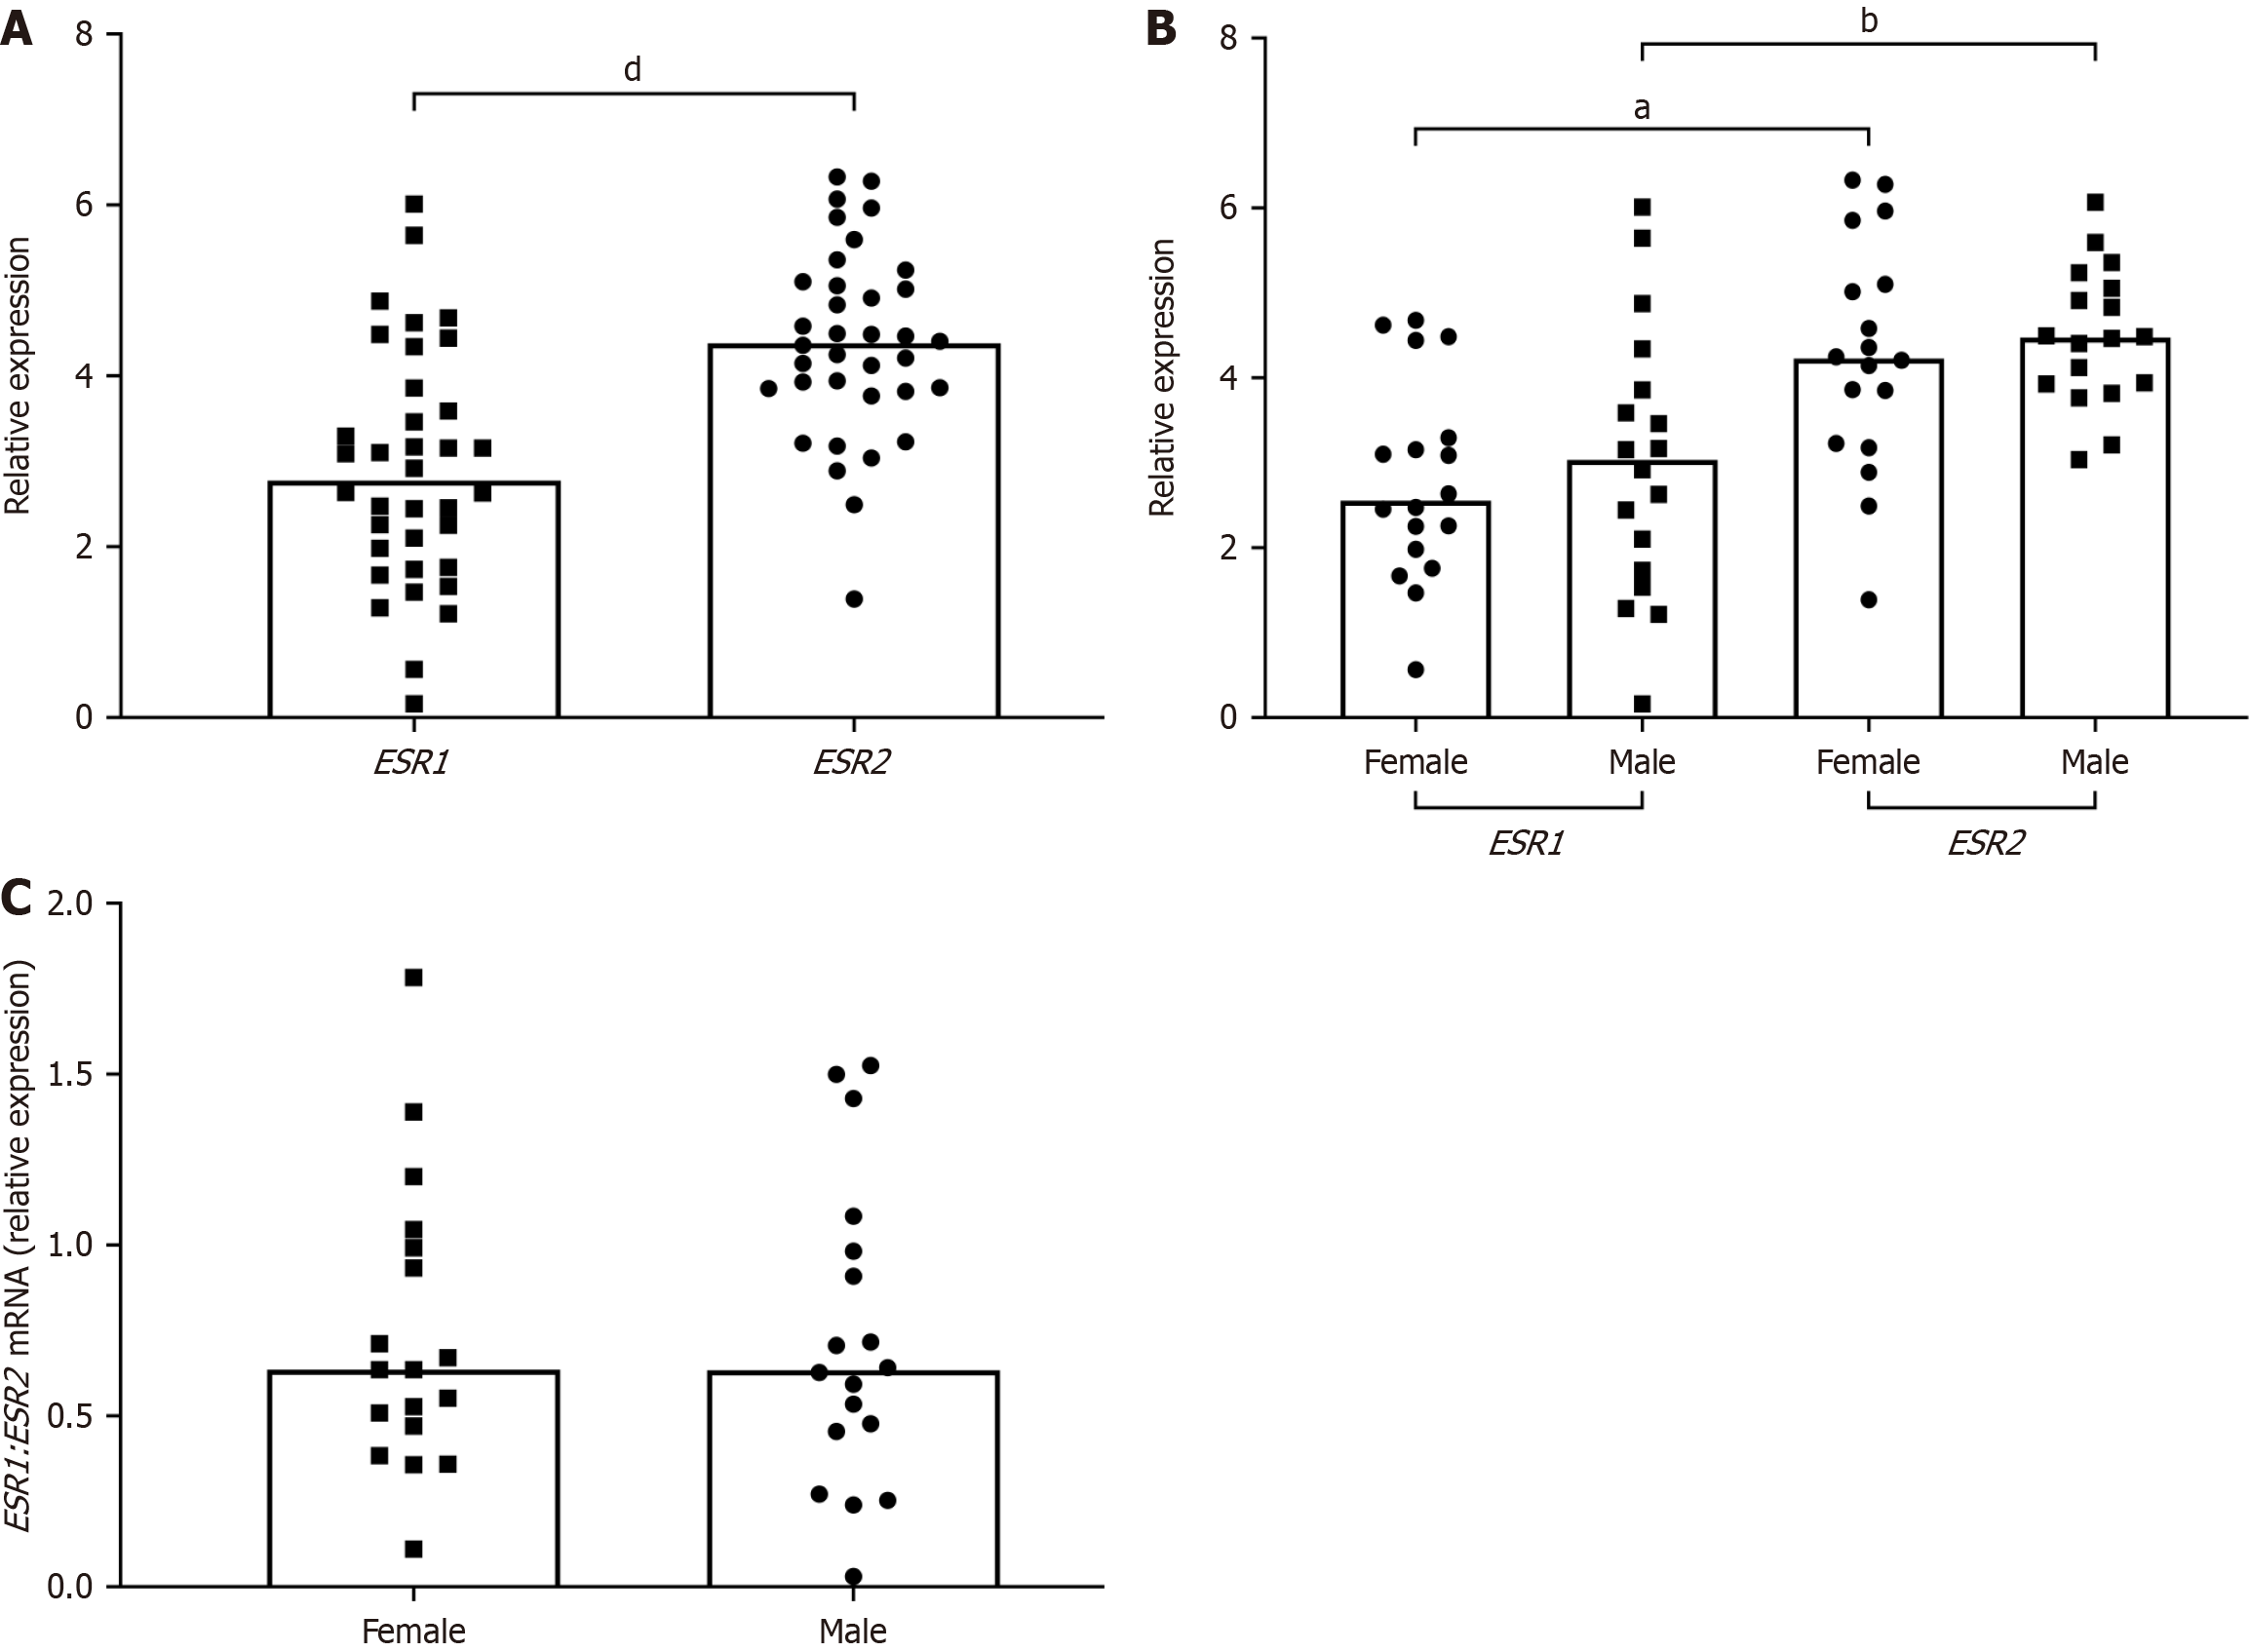
Figure 1 Message RNA expression of estrogen receptor α and estrogen receptor β in human liver tissues from normal subjects.
A: Estrogen receptor subtype expression was analyzed in human liver tissues by quantitative reverse transcription polymerase chain reaction using gene specific primers. Target gene expression was normalized to GUSB and SRSF4 expression using the ΔCt method and plotted; B: Stratification of A by sex; C: Ratio of ESR1 to ESR2 message RNA expression in normals stratified by sex. Column bars represent the median. Each symbol represents one individual. Data were analyzed by Mann-Whitney U or Kruskal-Wallis test where aP ≤ 0.05. bP ≤ 0.01. dP ≤ 0.0001. mRNA: Message RNA.
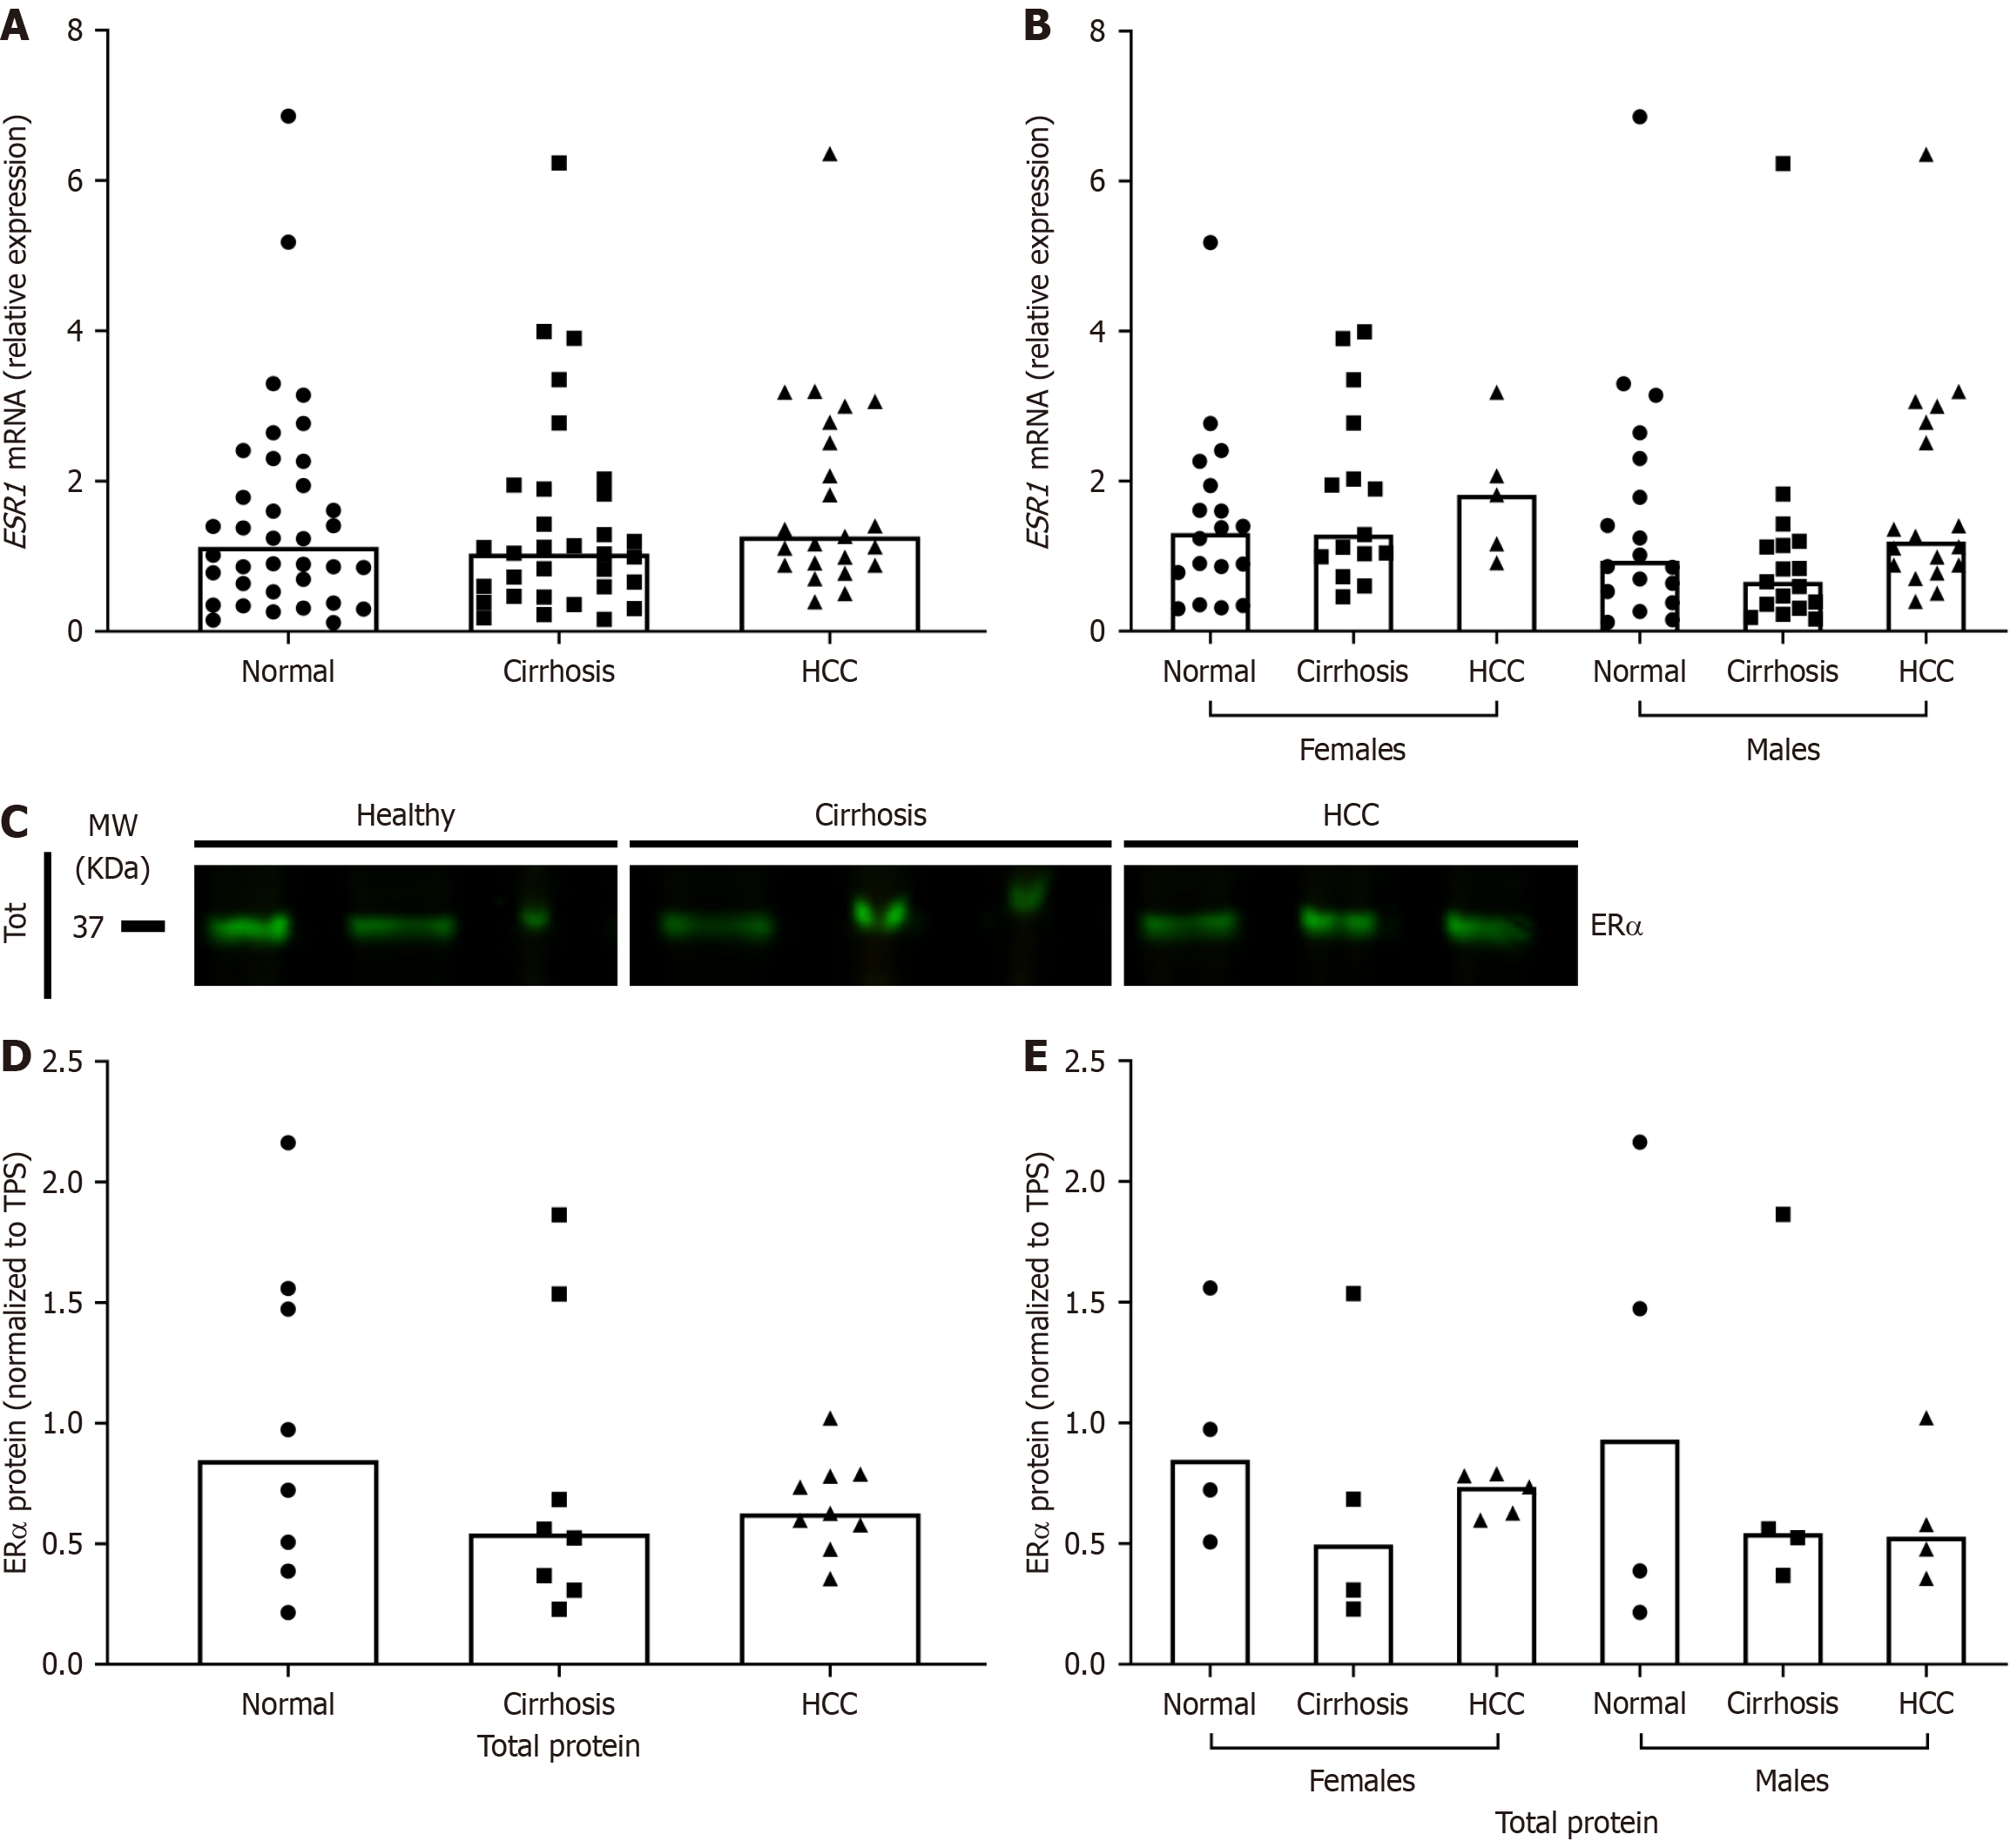
Figure 2 Expression of estrogen receptor α in human liver tissues with hepatitis C virus-related diseases.
Estrogen receptor (ER) α message RNA and protein expressions were analyzed in hepatitis C virus (HCV)-related cirrhosis and HCV-related hepatocellular carcinoma liver tissues and compared to normals. A: ESR1 transcript levels by quantitative reverse transcription polymerase chain reaction normalized to GUSB and SRSF4 expression and compared using the ΔΔCt method; B: Stratification of A by sex; C: ERα protein expression by Western blot using whole liver tissue lysates (tot); D: Quantification of C by densitometry from multiple blots and normalized to total protein; E: ERα protein expression in human liver tissues stratified by sex. Column bars represent the median. Each symbol represents one individual. Data were analyzed by Kruskal-Wallis test with Dunn’s Multiple Comparisons posttest where P ≤ 0.05 was considered significant. mRNA: Message RNA; HCC: Hepatocellular carcinoma; ER: Estrogen receptor; TPS: Total protein stain.
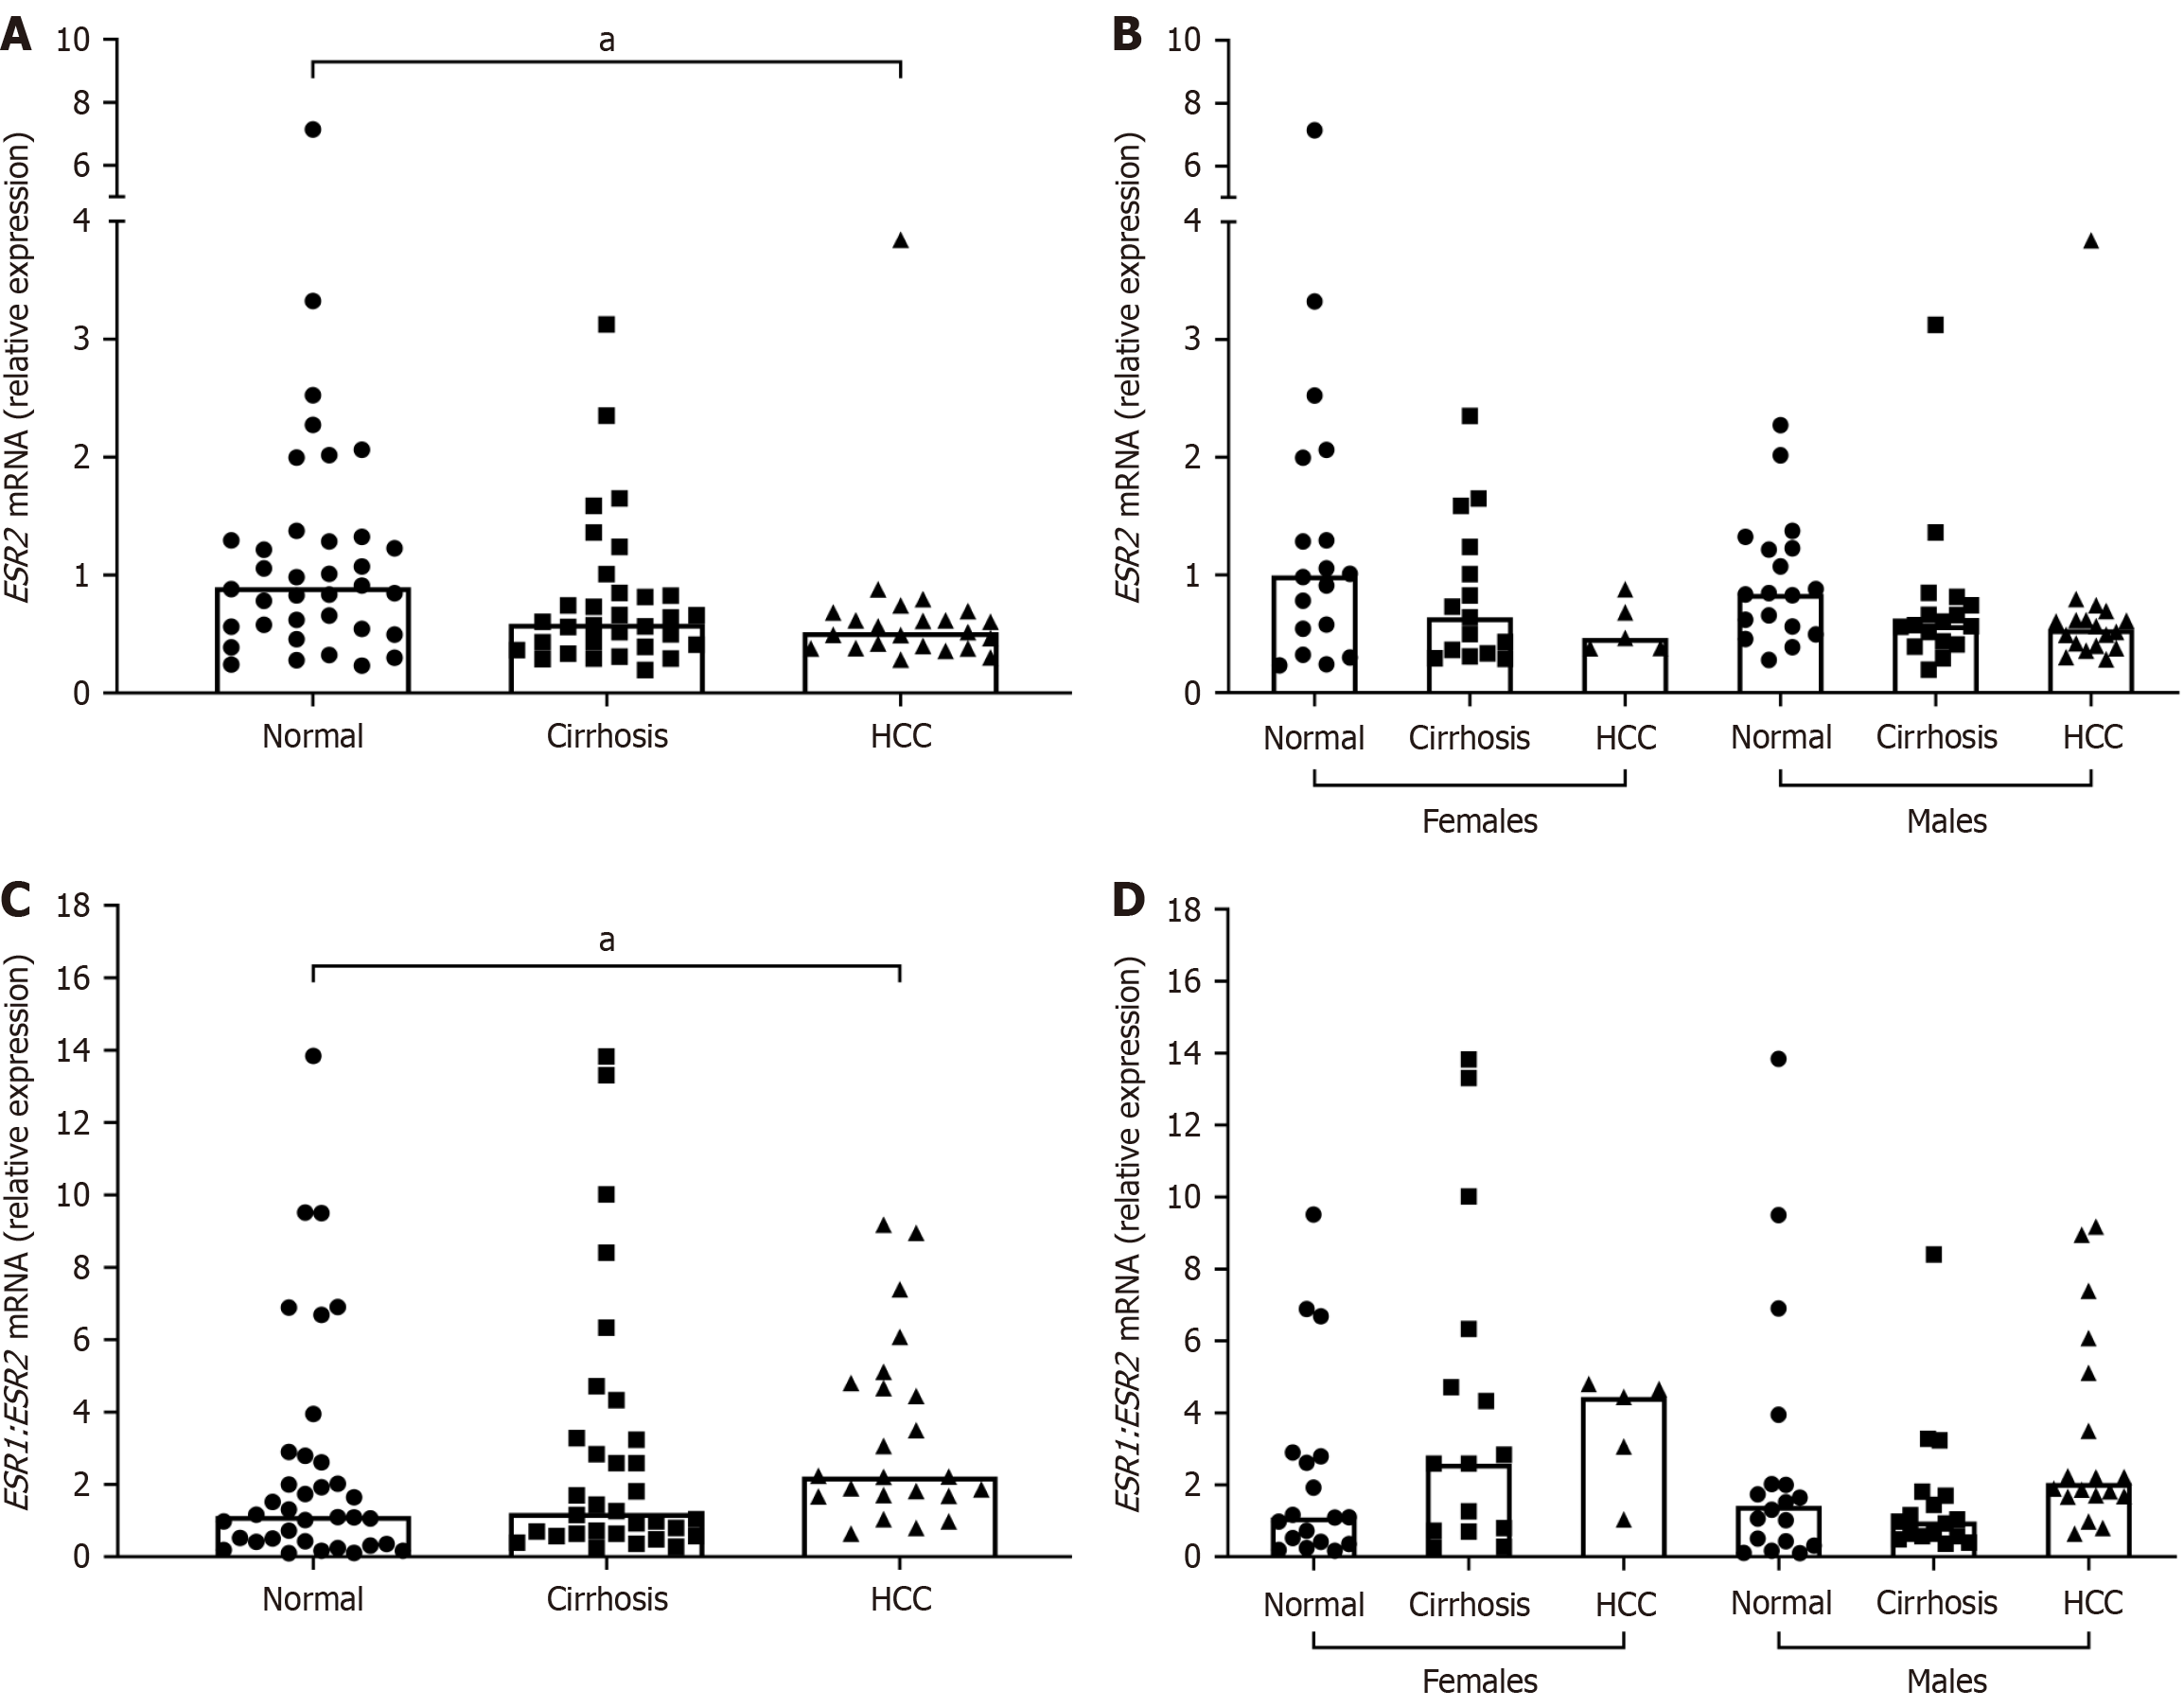
Figure 3 Message RNA expression of estrogen receptor β in human liver tissues with hepatitis C virus-related diseases.
Estrogen receptor (ER) β message RNA (mRNA) expression was analyzed in hepatitis C virus (HCV)-related cirrhosis and HCV-related hepatocellular carcinoma liver tissues and compared to normals. A: ESR2 transcript levels by quantitative reverse transcription polymerase chain reaction normalized to GUSB and SRSF4 expression and compared using the ΔΔCt method; B: Stratification of A by sex; C: Ratio of ESR1 to ESR2 mRNA expression; D: Stratification of C by sex. Column bars represent the median. Each symbol represents one individual. Data were analyzed by Kruskal-Wallis test with Dunn’s Multiple Comparisons posttest where P ≤ 0.05 was considered significant. aP ≤ 0.05. mRNA: Message RNA; HCC: Hepatocellular carcinoma.
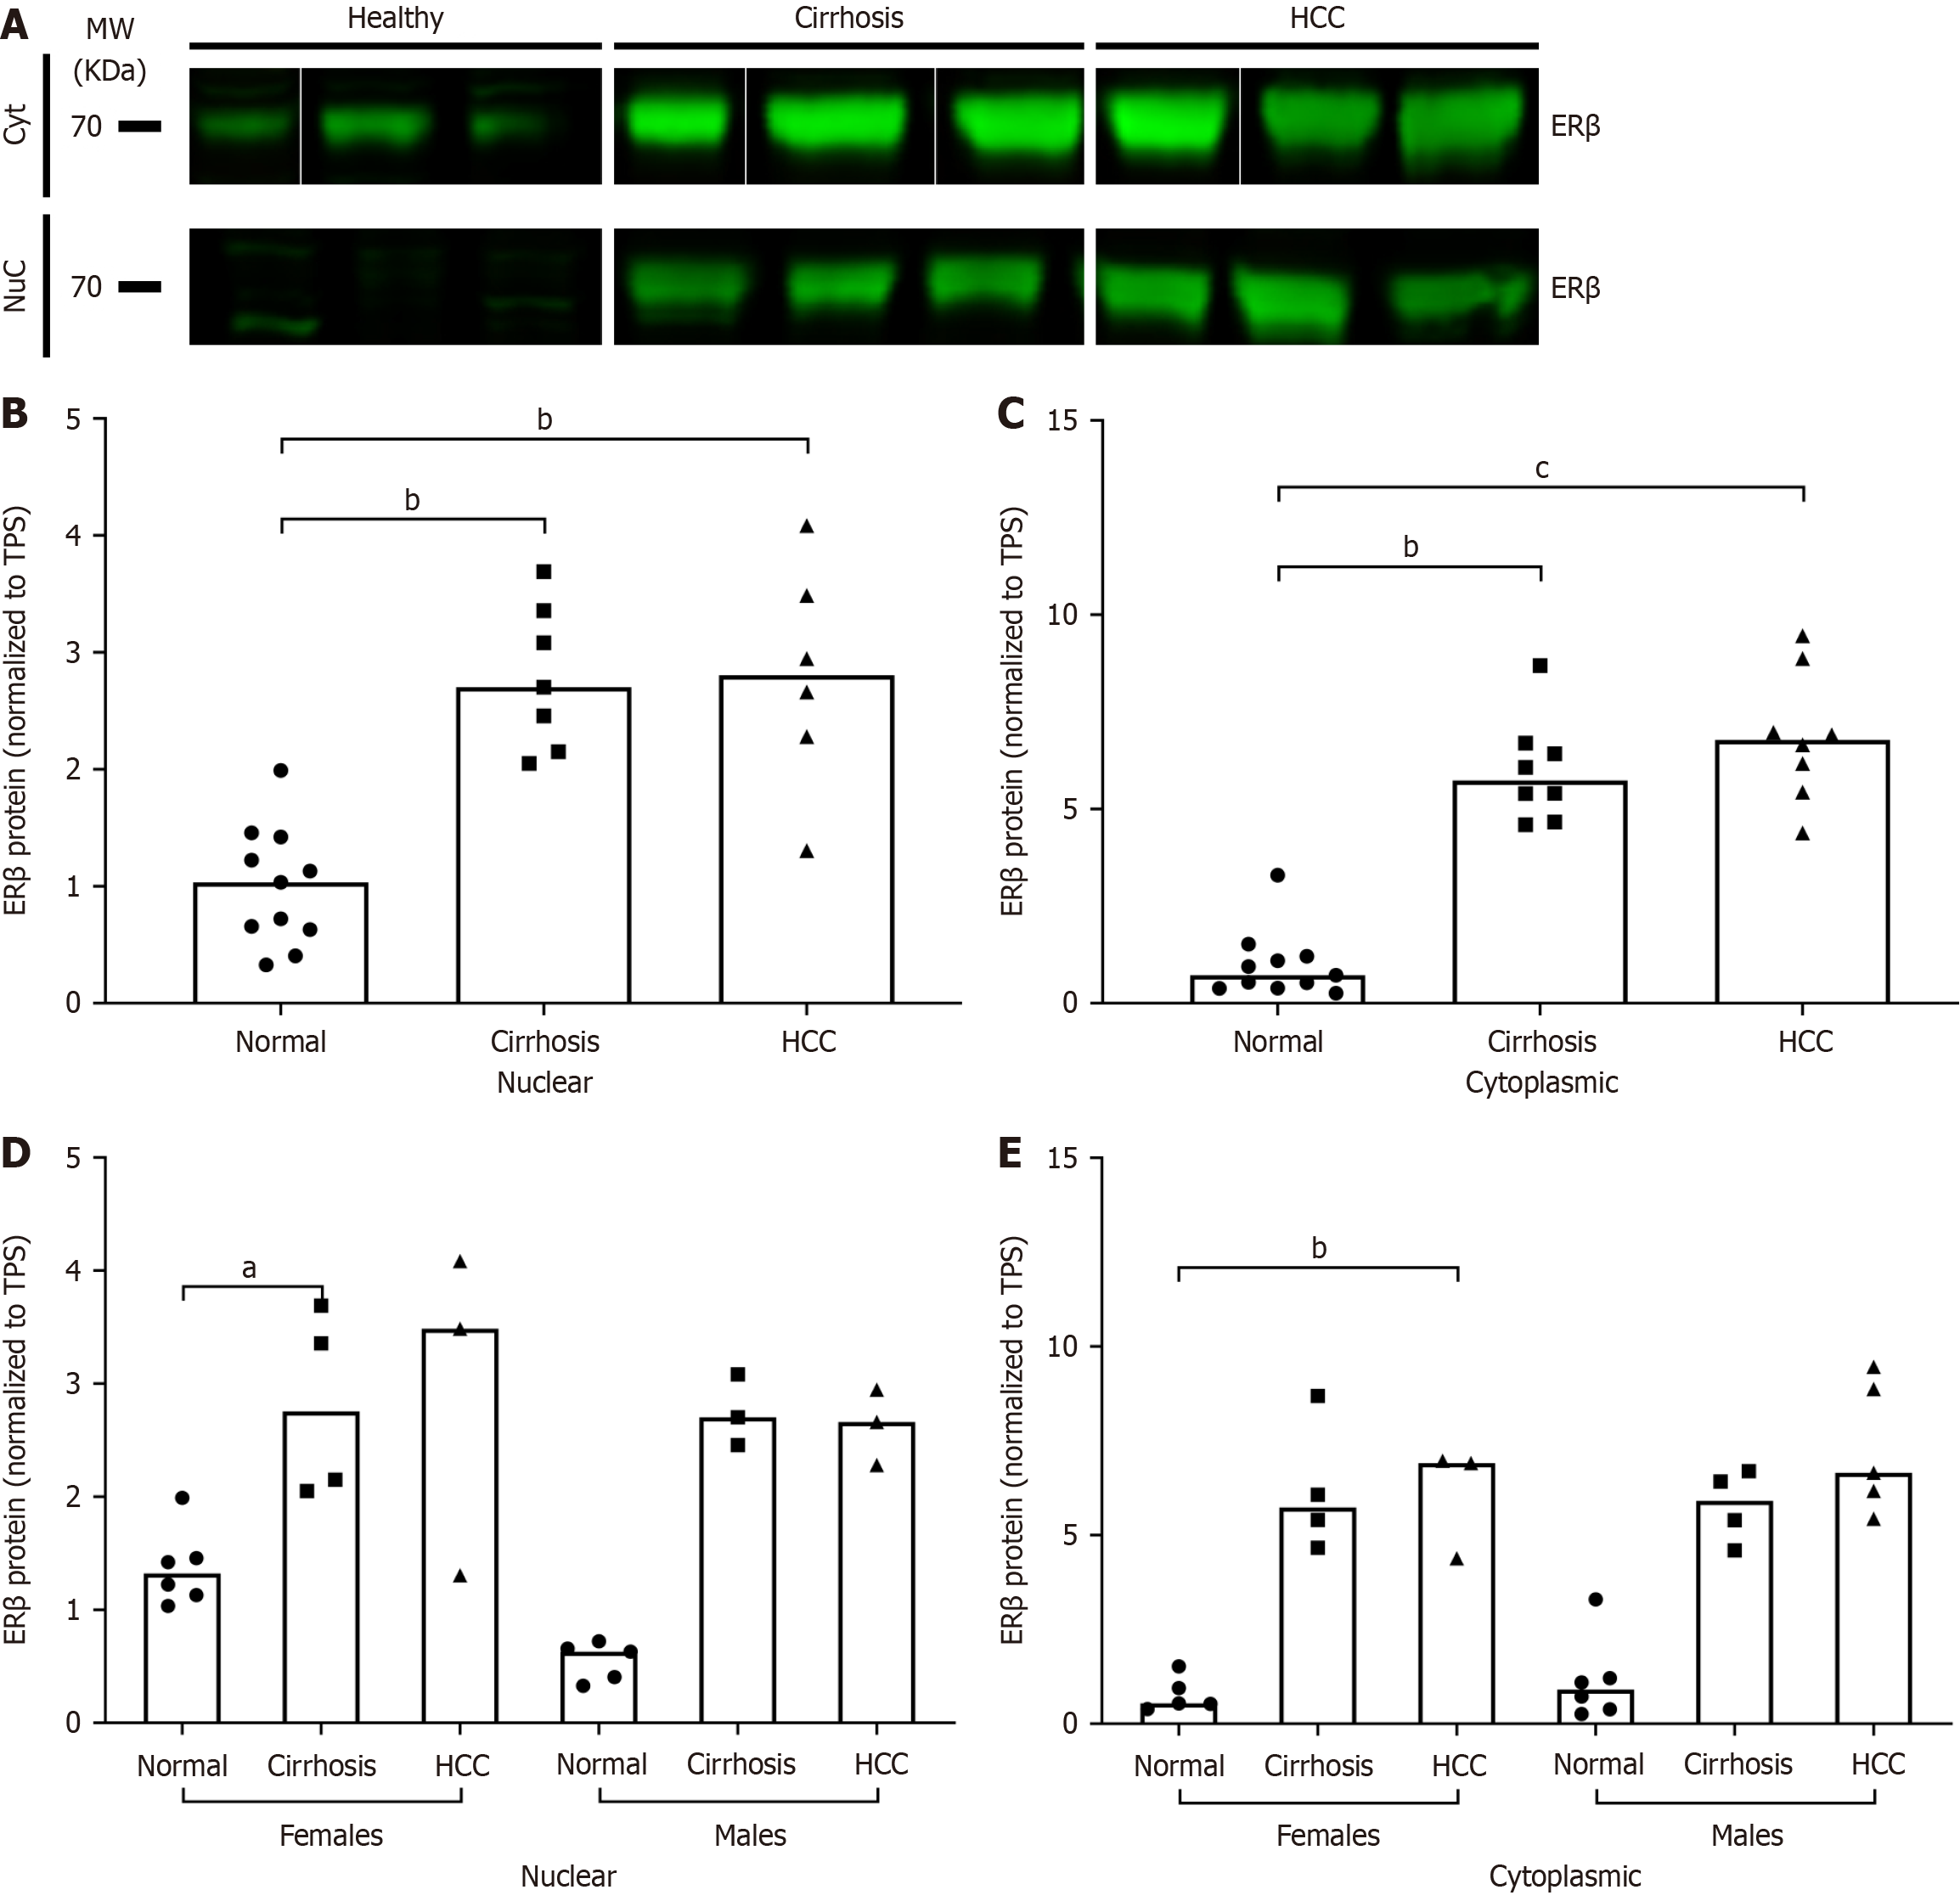
Figure 4 Protein expression of estrogen receptor β in human liver tissues with hepatitis C virus-related diseases.
Estrogen receptor (ER) β protein expression was analyzed in hepatitis C virus (HCV)-related cirrhosis and HCV-related hepatocellular carcinoma liver tissues and compared to normals. A: ERβ protein expression by Western blot in human liver tissues fractionated by nuclear and cytoplasmic protein; B and C: Quantification of A by densitometry from multiple blots and normalized to total protein; D and E: ERβ protein expression in nuclear and cytoplasmic fractions of human liver tissues and stratified by sex. Column bars represent the median. Each symbol represents one individual. Data were analyzed by Kruskal-Wallis test with Dunn’s Multiple Comparisons posttest where aP ≤ 0.05. bP ≤ 0.01. cP ≤ 0.001. Nuc: Nuclear; Cyt: Cytoplasmic; HCC: Hepatocellular carcinoma; ER: Estrogen receptor; TPS: Total protein stain.
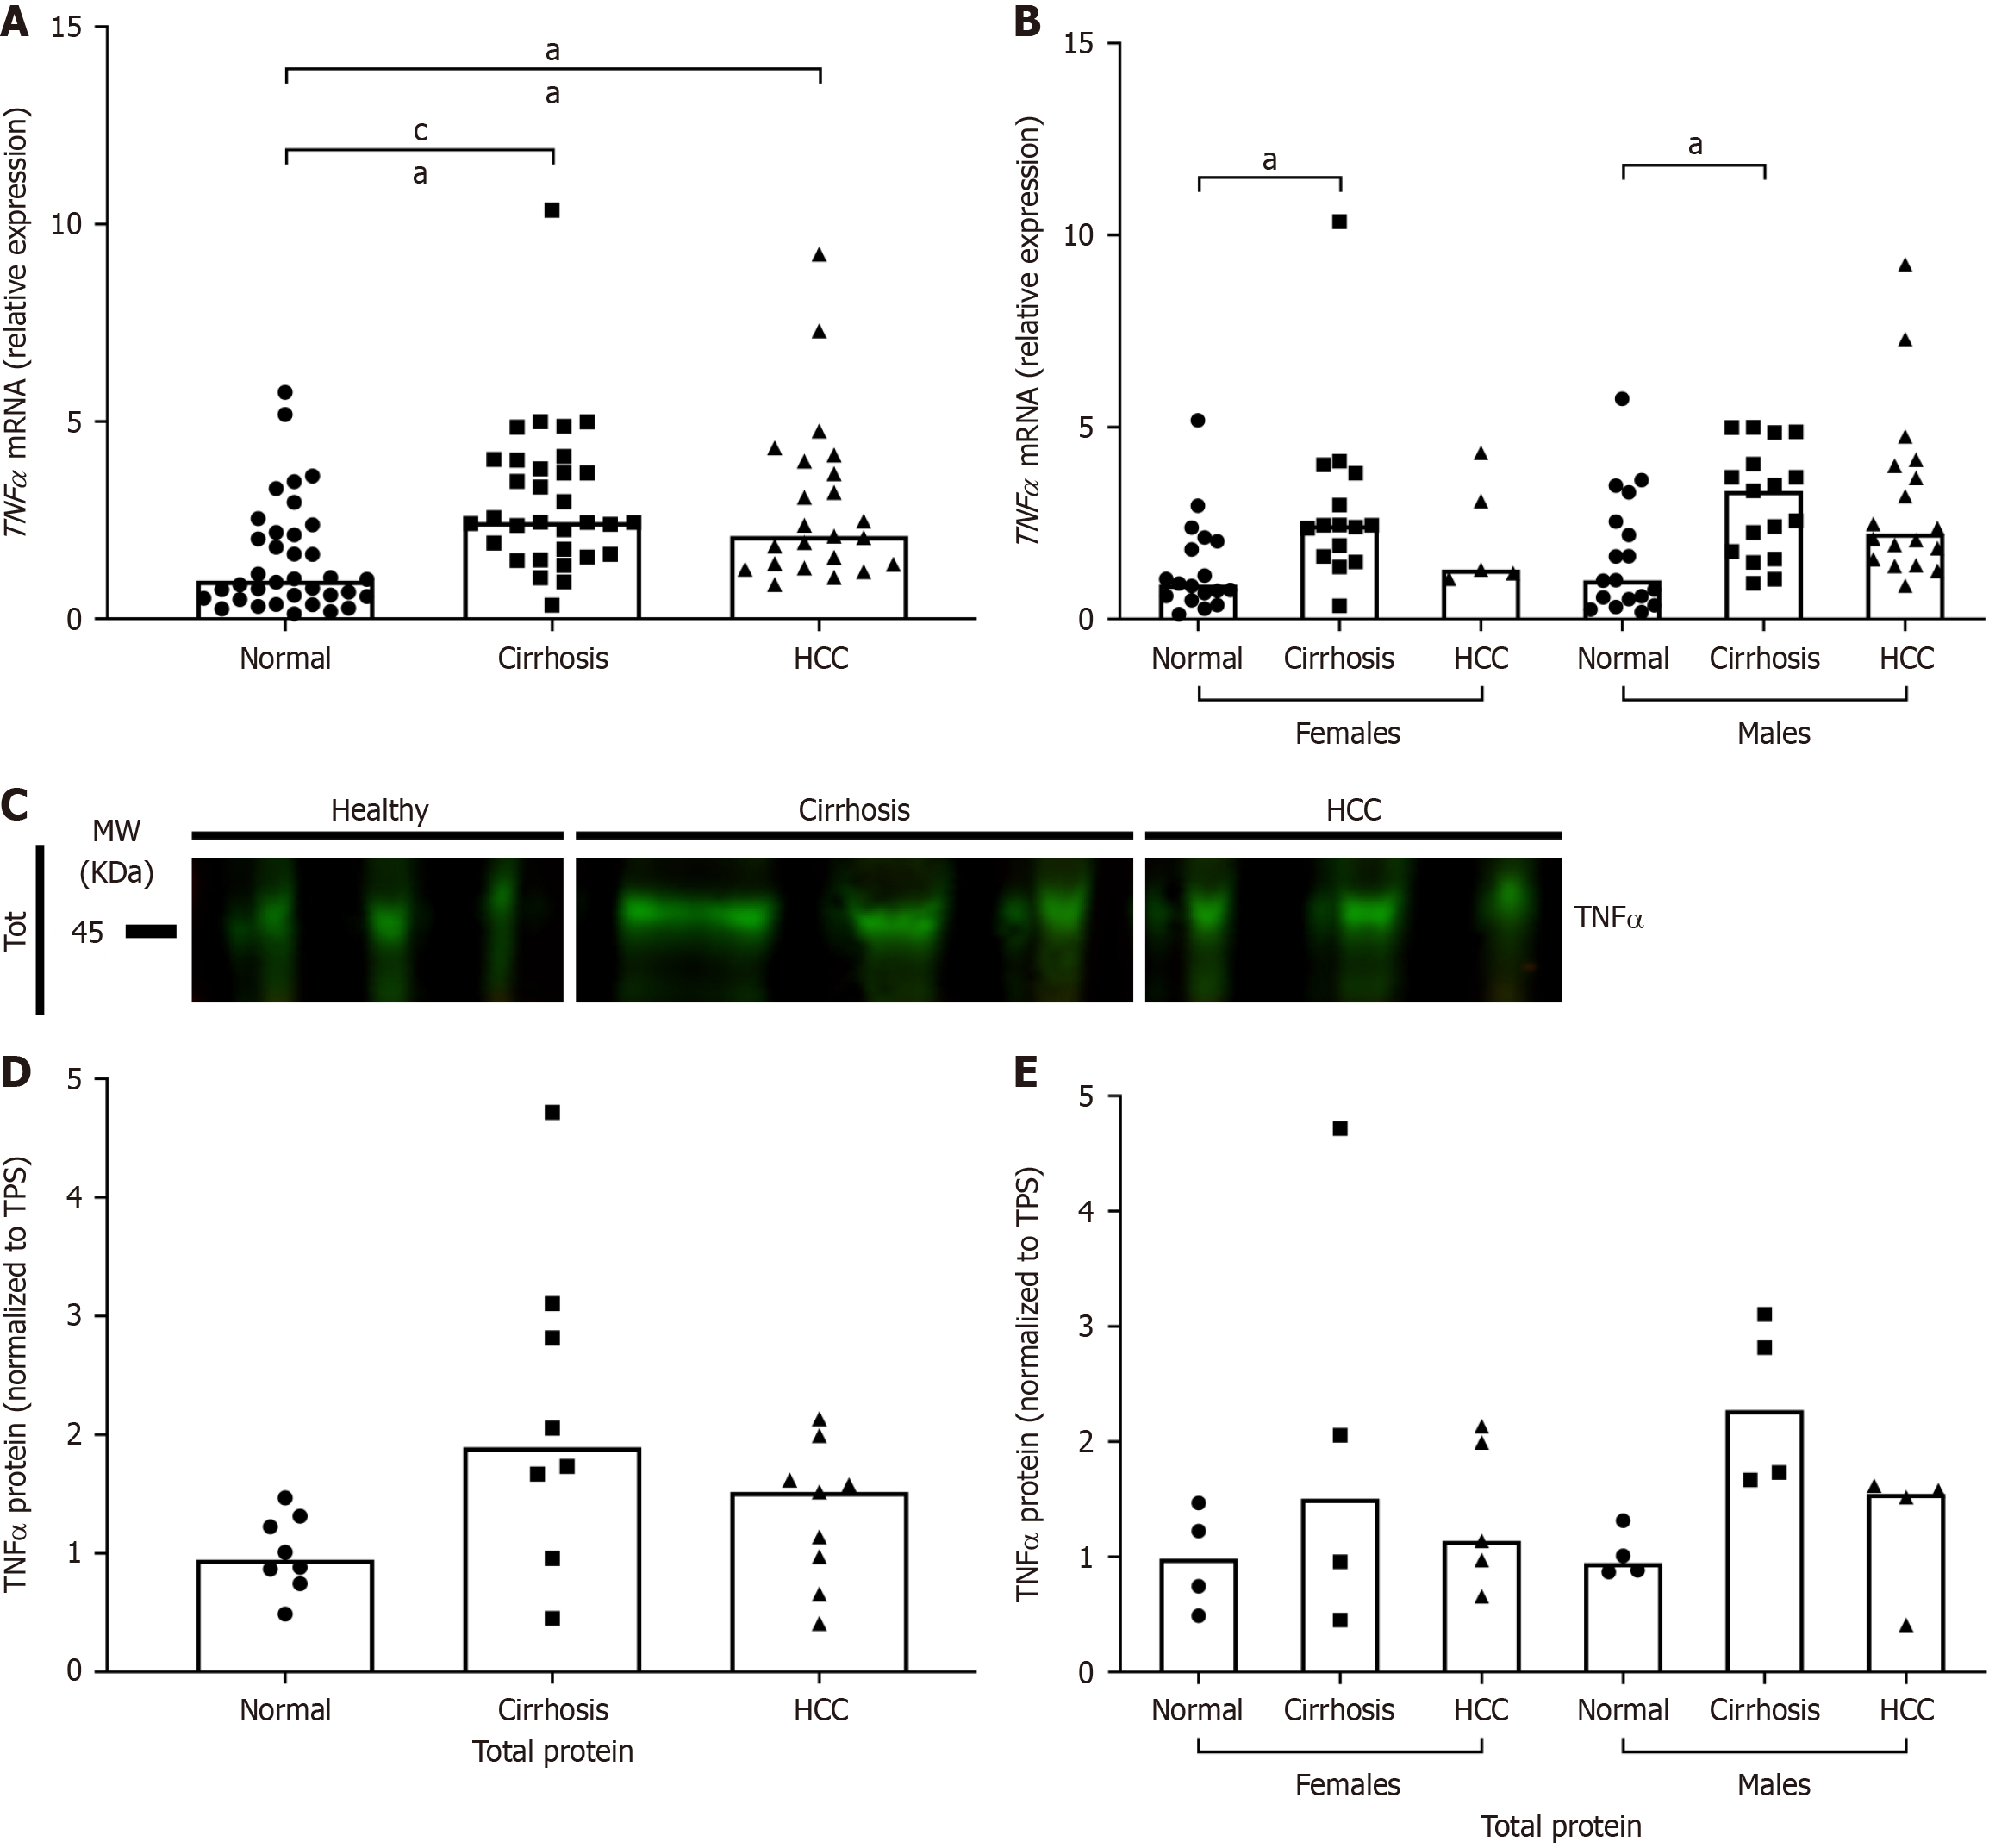
Figure 5 Expression of tumor necrosis factor-alpha in human liver tissues with hepatitis C virus-related diseases.
Tumor necrosis factor-alpha (TNF-α) message RNA and protein expressions were analyzed in hepatitis C virus (HCV)-related cirrhosis and HCV-related hepatocellular carcinoma liver tissues and compared to normals. A: TNF-α transcript levels by quantitative reverse transcription polymerase chain reaction normalized to GUSB and SRSF4 expression and compared using the ΔΔCt method; B: Stratification of A by sex; C: TNF-α protein expression by Western blot using whole liver tissue lysates; D: Quantification of C by densitometry from multiple blots and normalized to total protein; E: Stratification of D by sex. Column bars represent the median. Each symbol represents one individual. Data were analyzed by Kruskal-Wallis test with Dunn’s Multiple Comparisons posttest where aP ≤ 0.05. cP ≤ 0.001. TNF-α: Tumor necrosis factor-alpha; HCC: Hepatocellular carcinoma; TPS: Total protein stain.
- Citation: Groover S, Addison S, Nicks S, Mwangi M, Brooks A, Kaul A, Kaul R. Sex based relative expression of estrogen receptors and tumor necrosis factor-alpha in liver affects hepatitis C virus viral pathogenesis. World J Gastroenterol 2025; 31(32): 104277
- URL: https://www.wjgnet.com/1007-9327/full/v31/i32/104277.htm
- DOI: https://dx.doi.org/10.3748/wjg.v31.i32.104277


