Copyright
©The Author(s) 2025.
World J Gastroenterol. Jan 21, 2025; 31(3): 101041
Published online Jan 21, 2025. doi: 10.3748/wjg.v31.i3.101041
Published online Jan 21, 2025. doi: 10.3748/wjg.v31.i3.101041
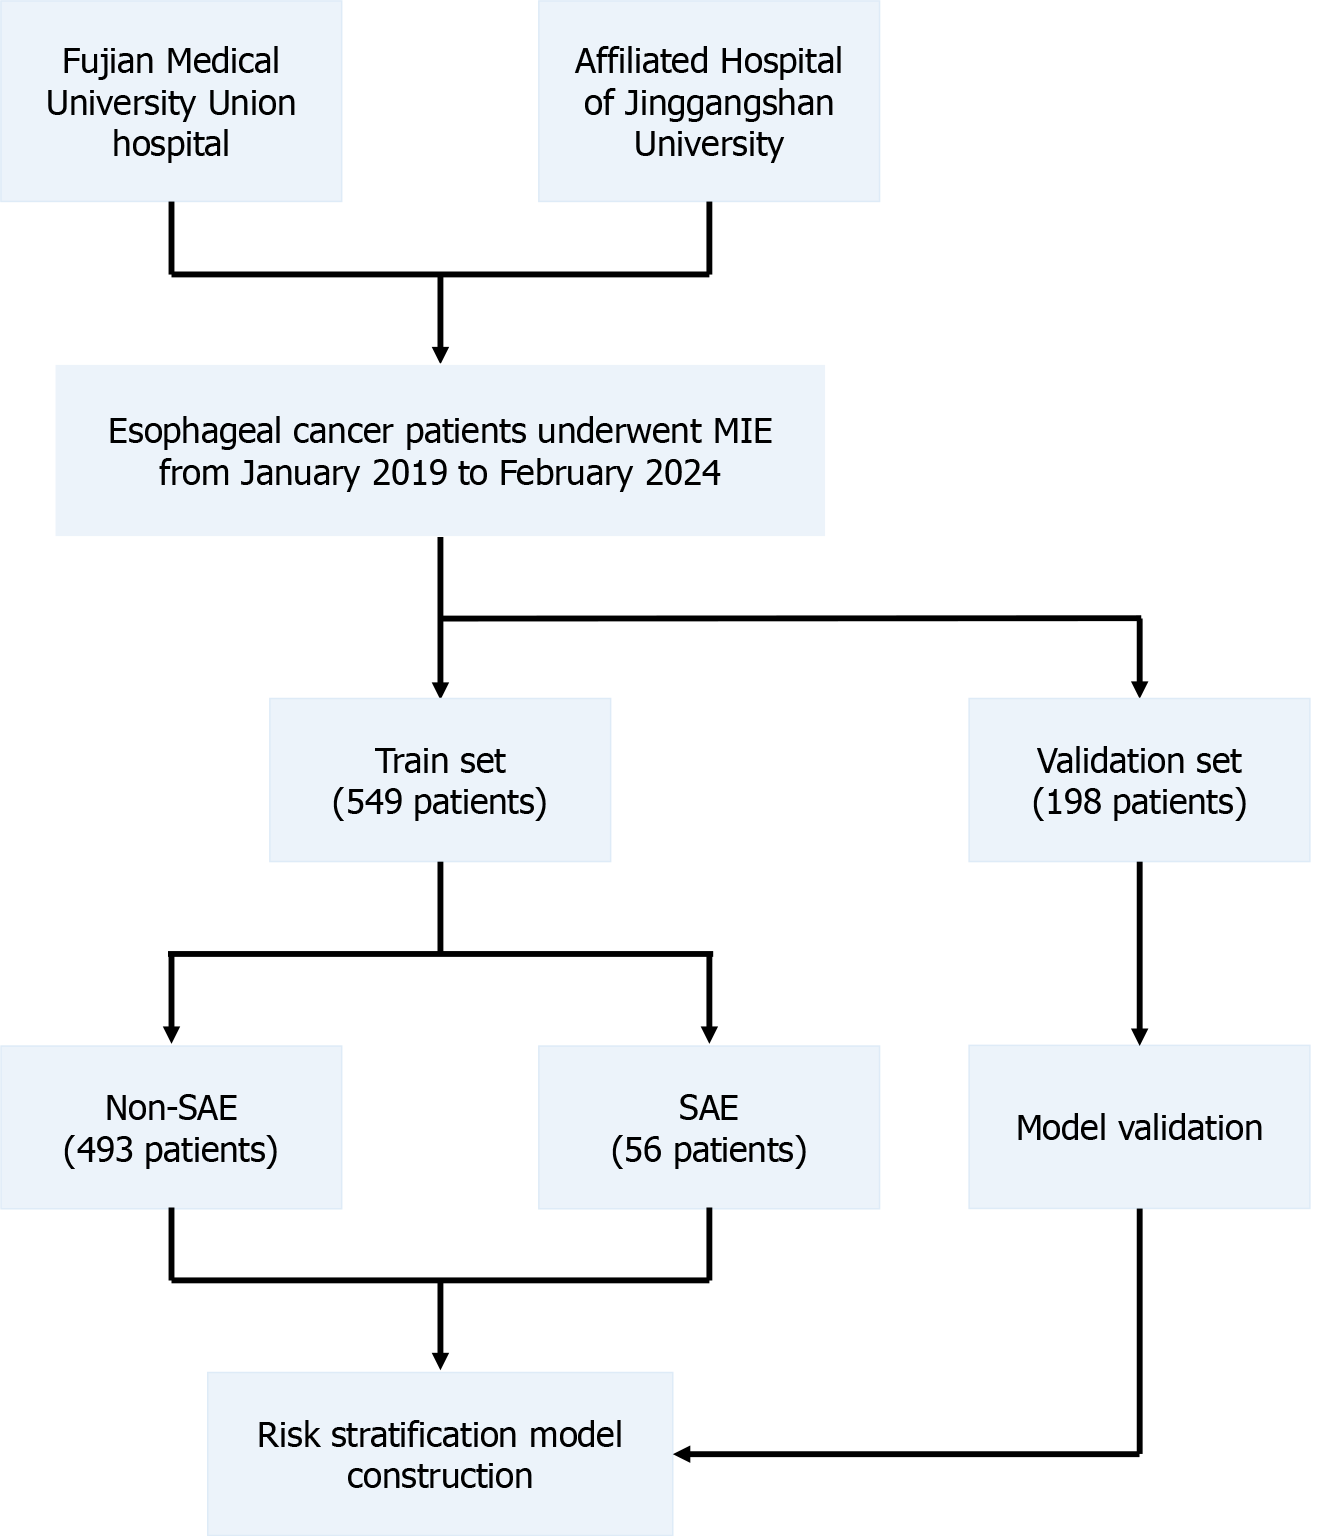
Figure 1 Work flow of research.
MIE: Minimally invasive esophagectomy; SAE: Severe adverse event.
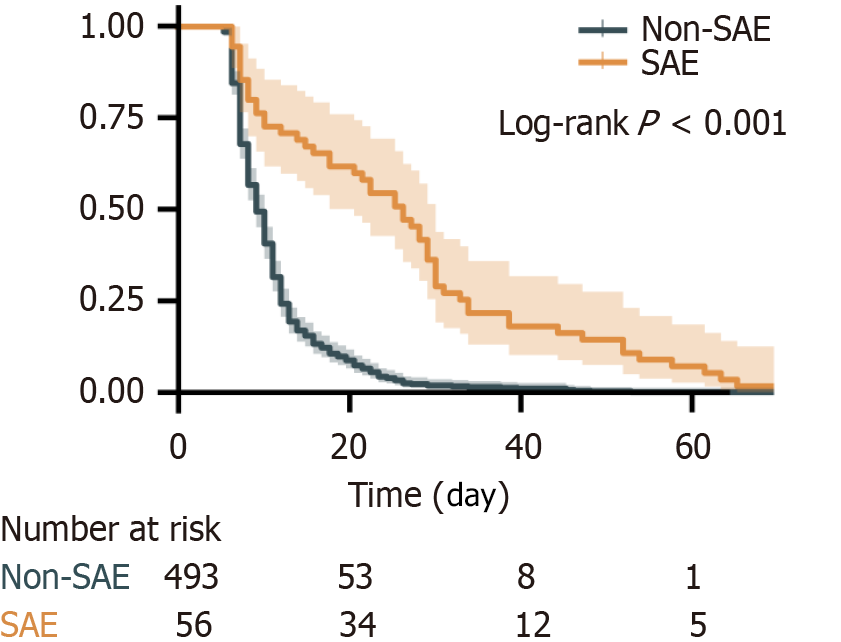
Figure 2 Kaplan-Meier curves of the length of stay for severe adverse event and non-severe adverse event.
SAE: Severe adverse event.
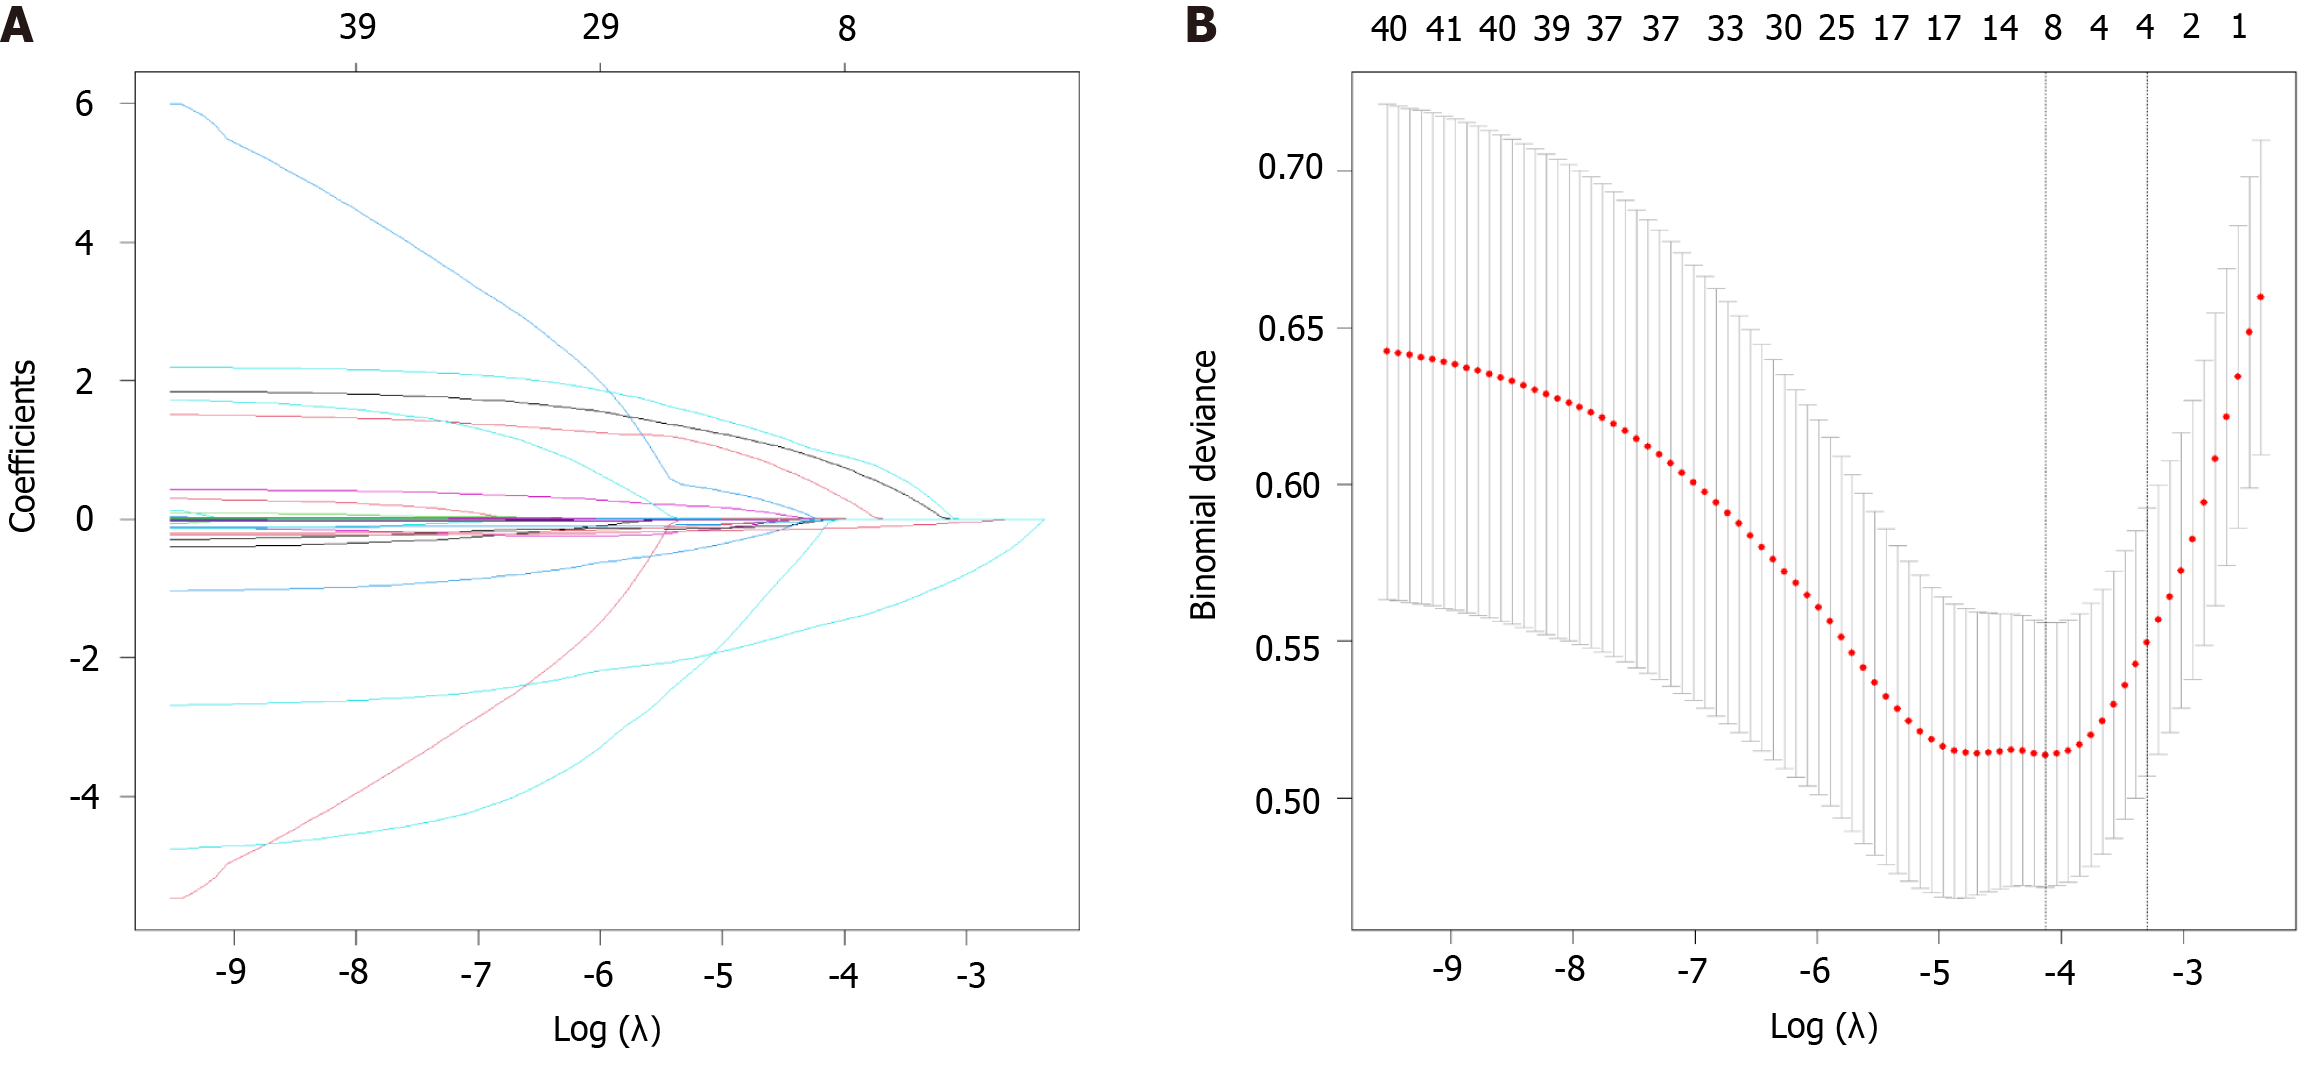
Figure 3 LASSO regression curves.
A: The curve of the regression coefficient vs log (λ); B: The curve of mean squared error vs log (λ).
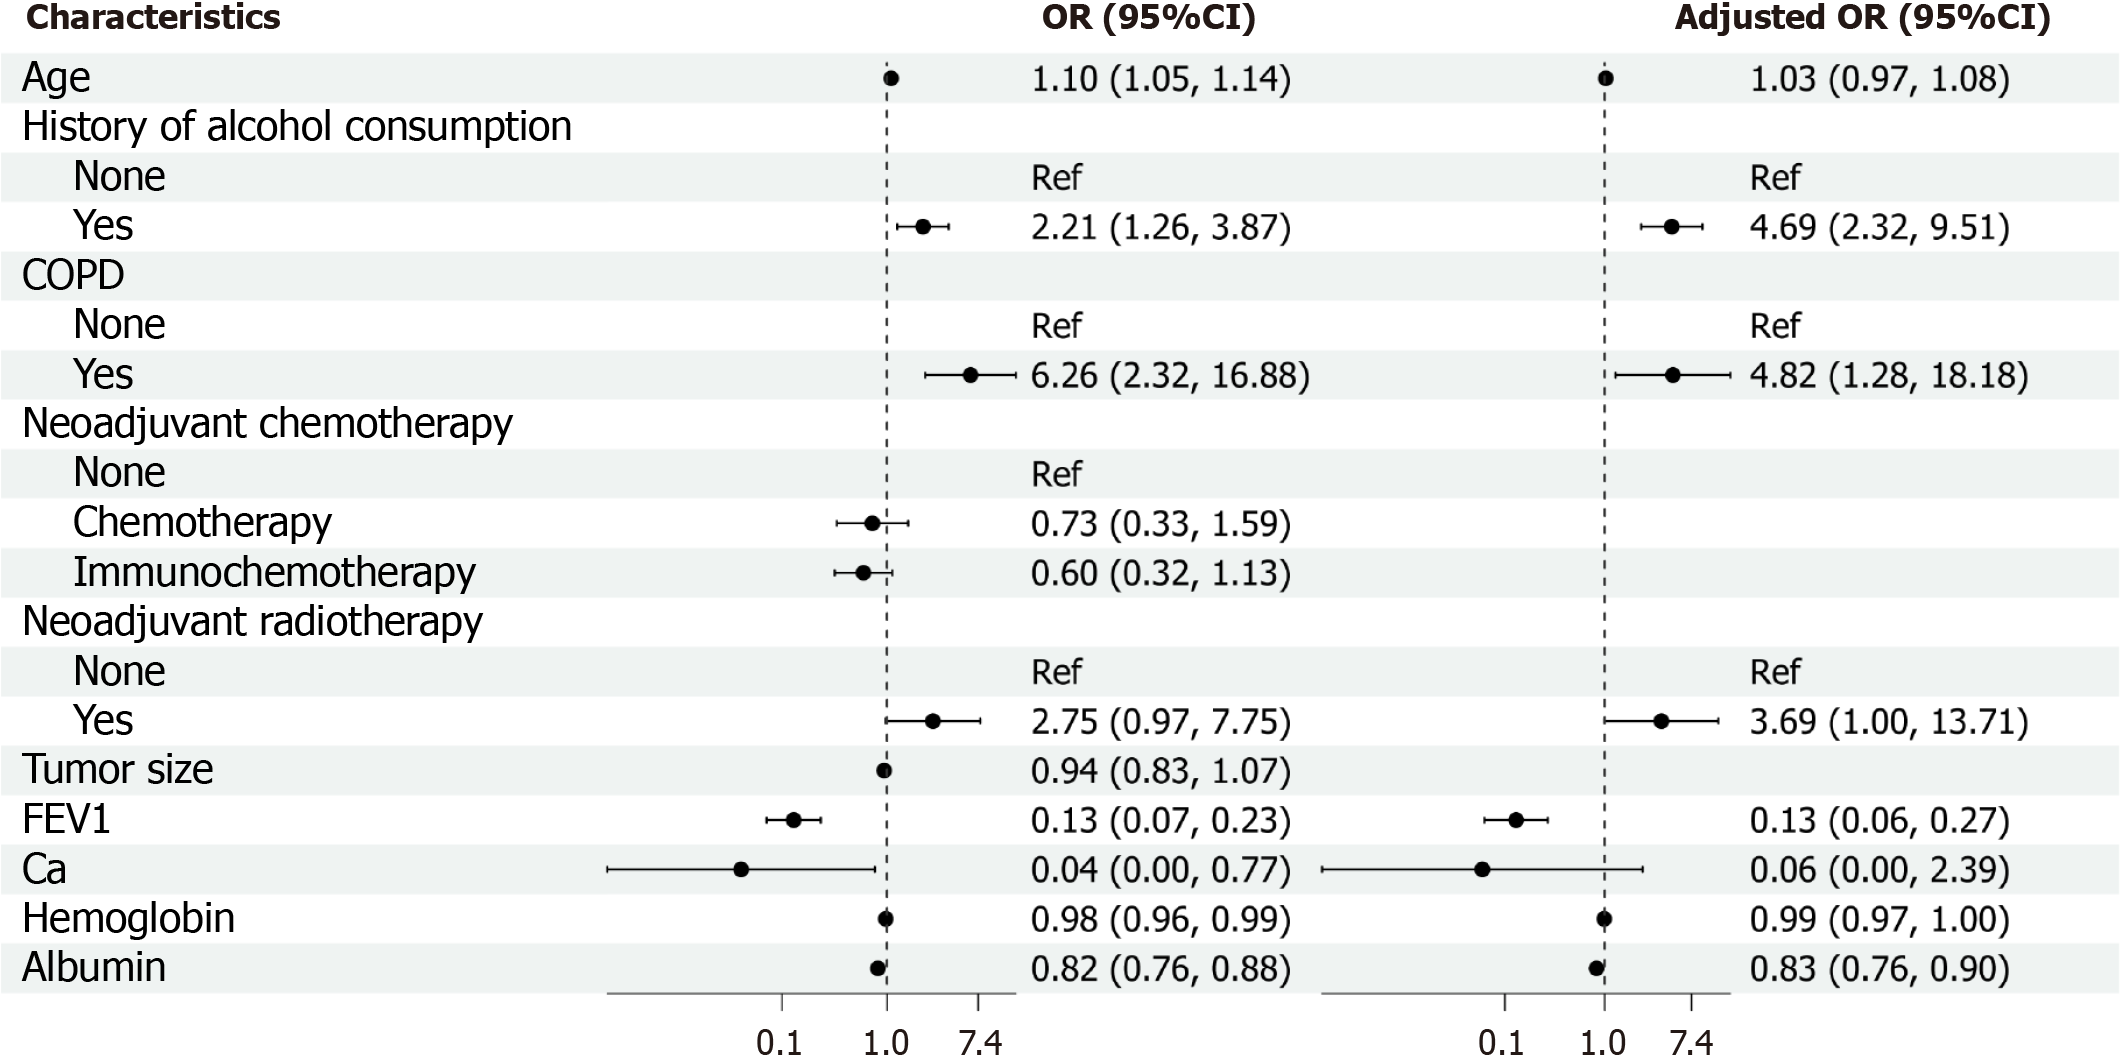
Figure 4 Forest plots of risk factors for severe adverse events after minimally invasive esophagectomy.
OR: Odds ratio; CI: Confidence interval; COPD: Chronic obstructive pulmonary disease; FEV1: Forced expiratory volume in 1 second; Ca: Calcium.
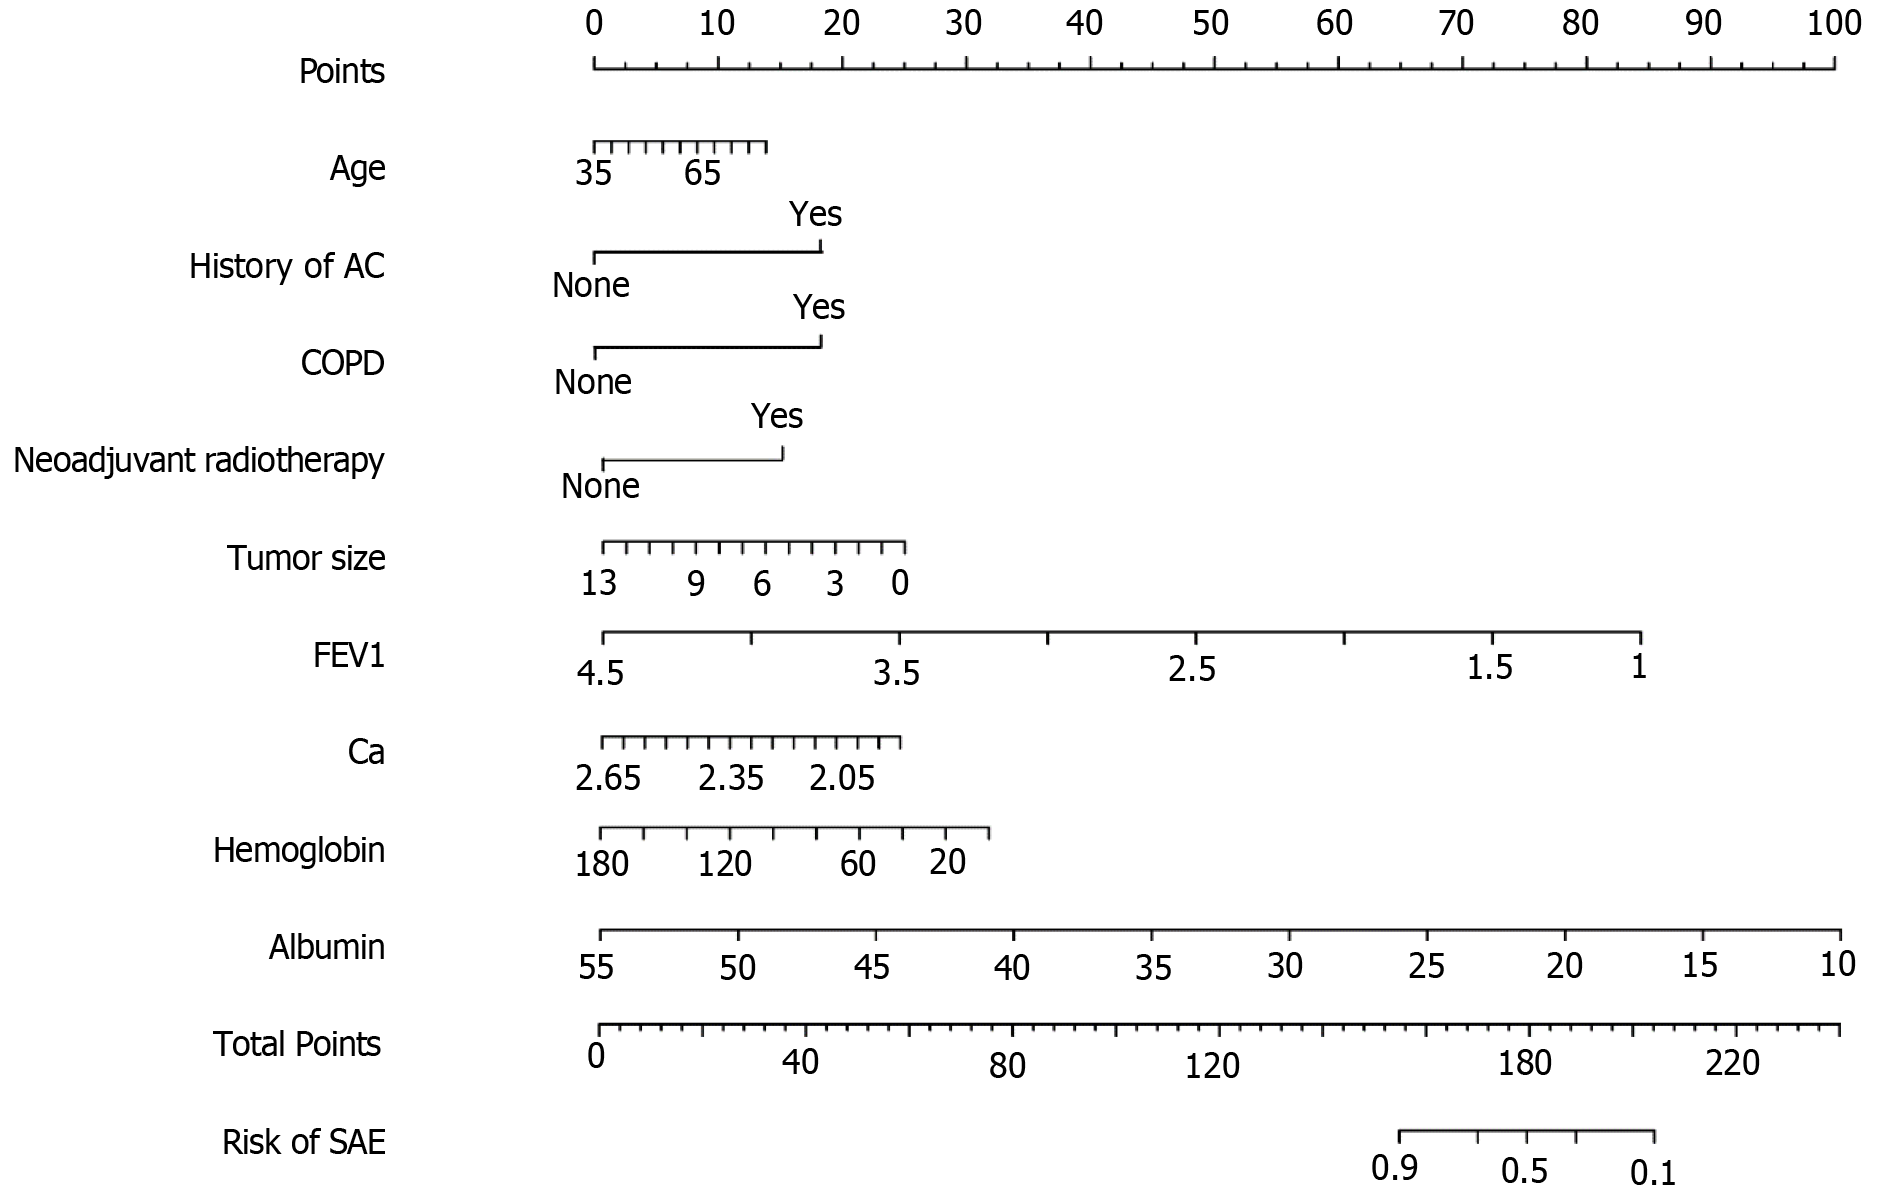
Figure 5 Nomogram of prediction model.
AC: Alcohol consumption; COPD: Chronic obstructive pulmonary disease; FEV1: Forced expiratory volume in the first second; Ca: Calcium; SAE: Severe adverse event.
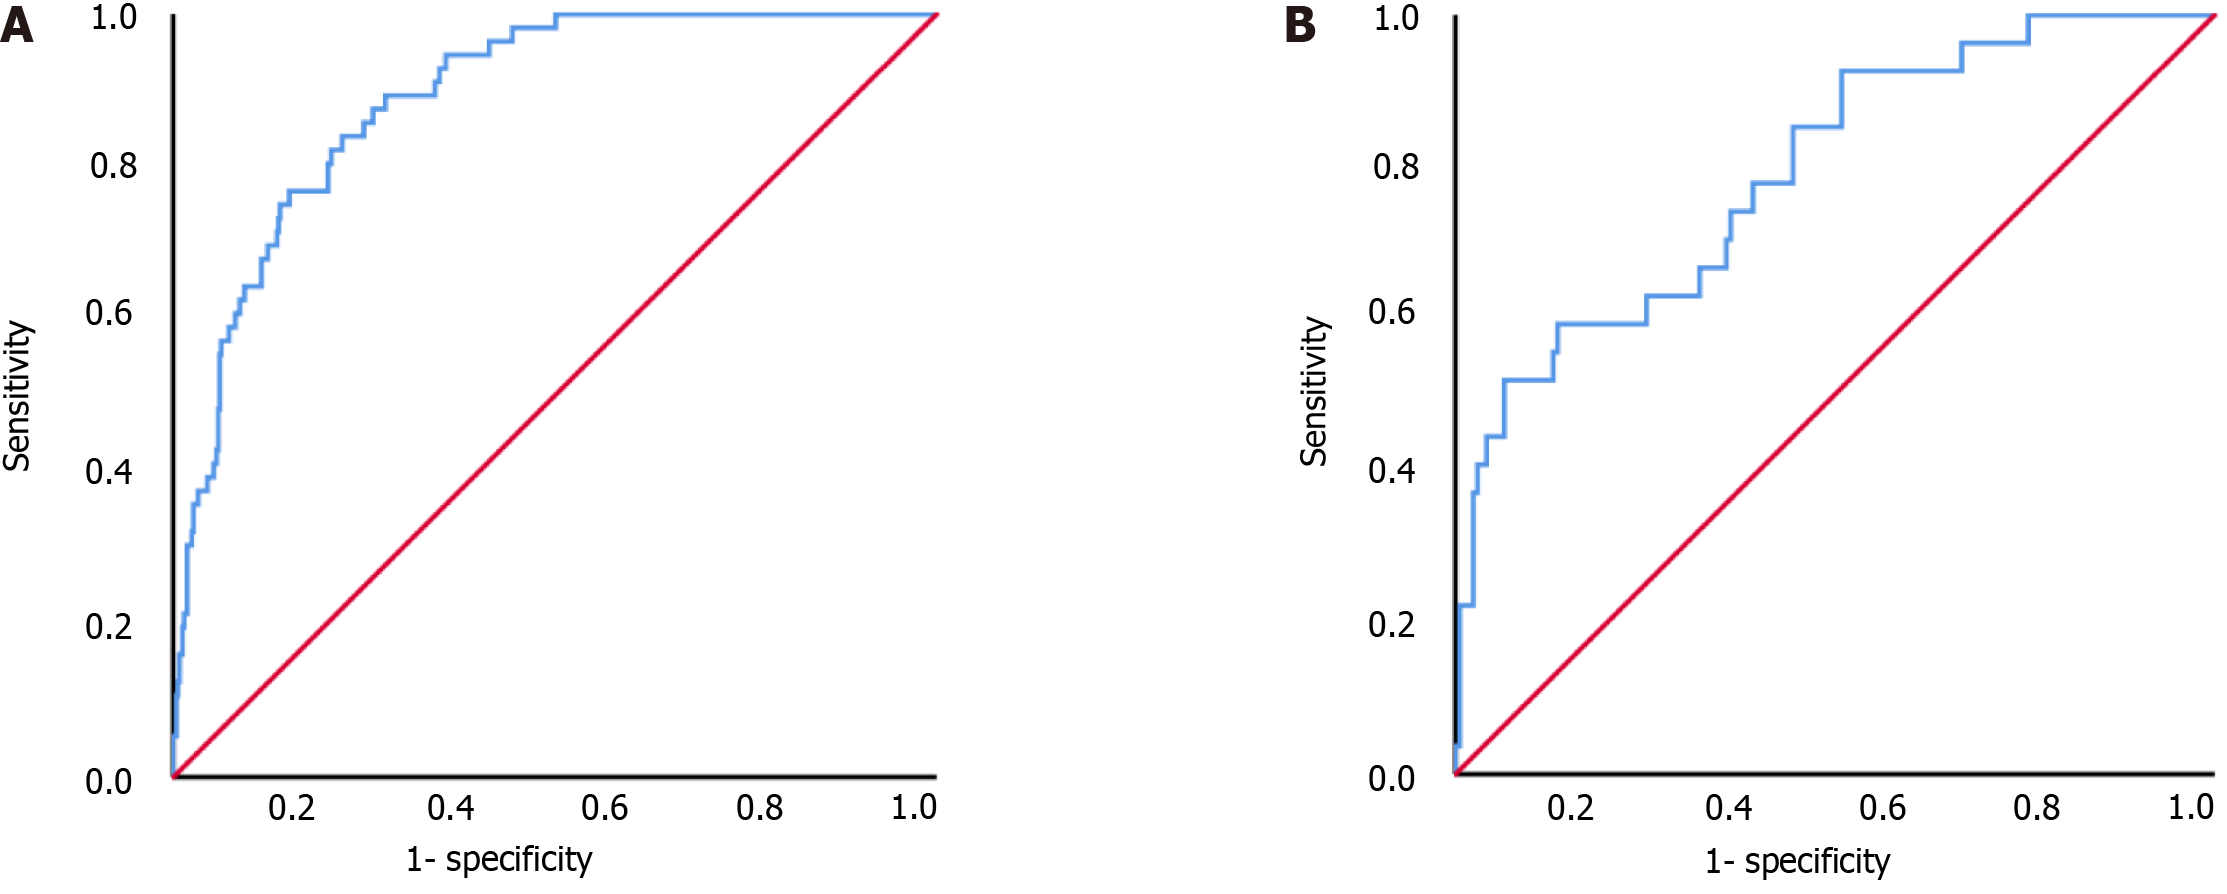
Figure 6 Receiver operating characteristic curves of prediction model in train set and validation set.
A: Receiver operating characteristic curves of train set; the area under the curve of prediction model was 0.889 (95% confidence interval: 0.853-0.926); B: Receiver operating characteristic curves of validation set; the area under the curve of prediction model was 0.793 (95% confidence interval: 0.701-0.884).
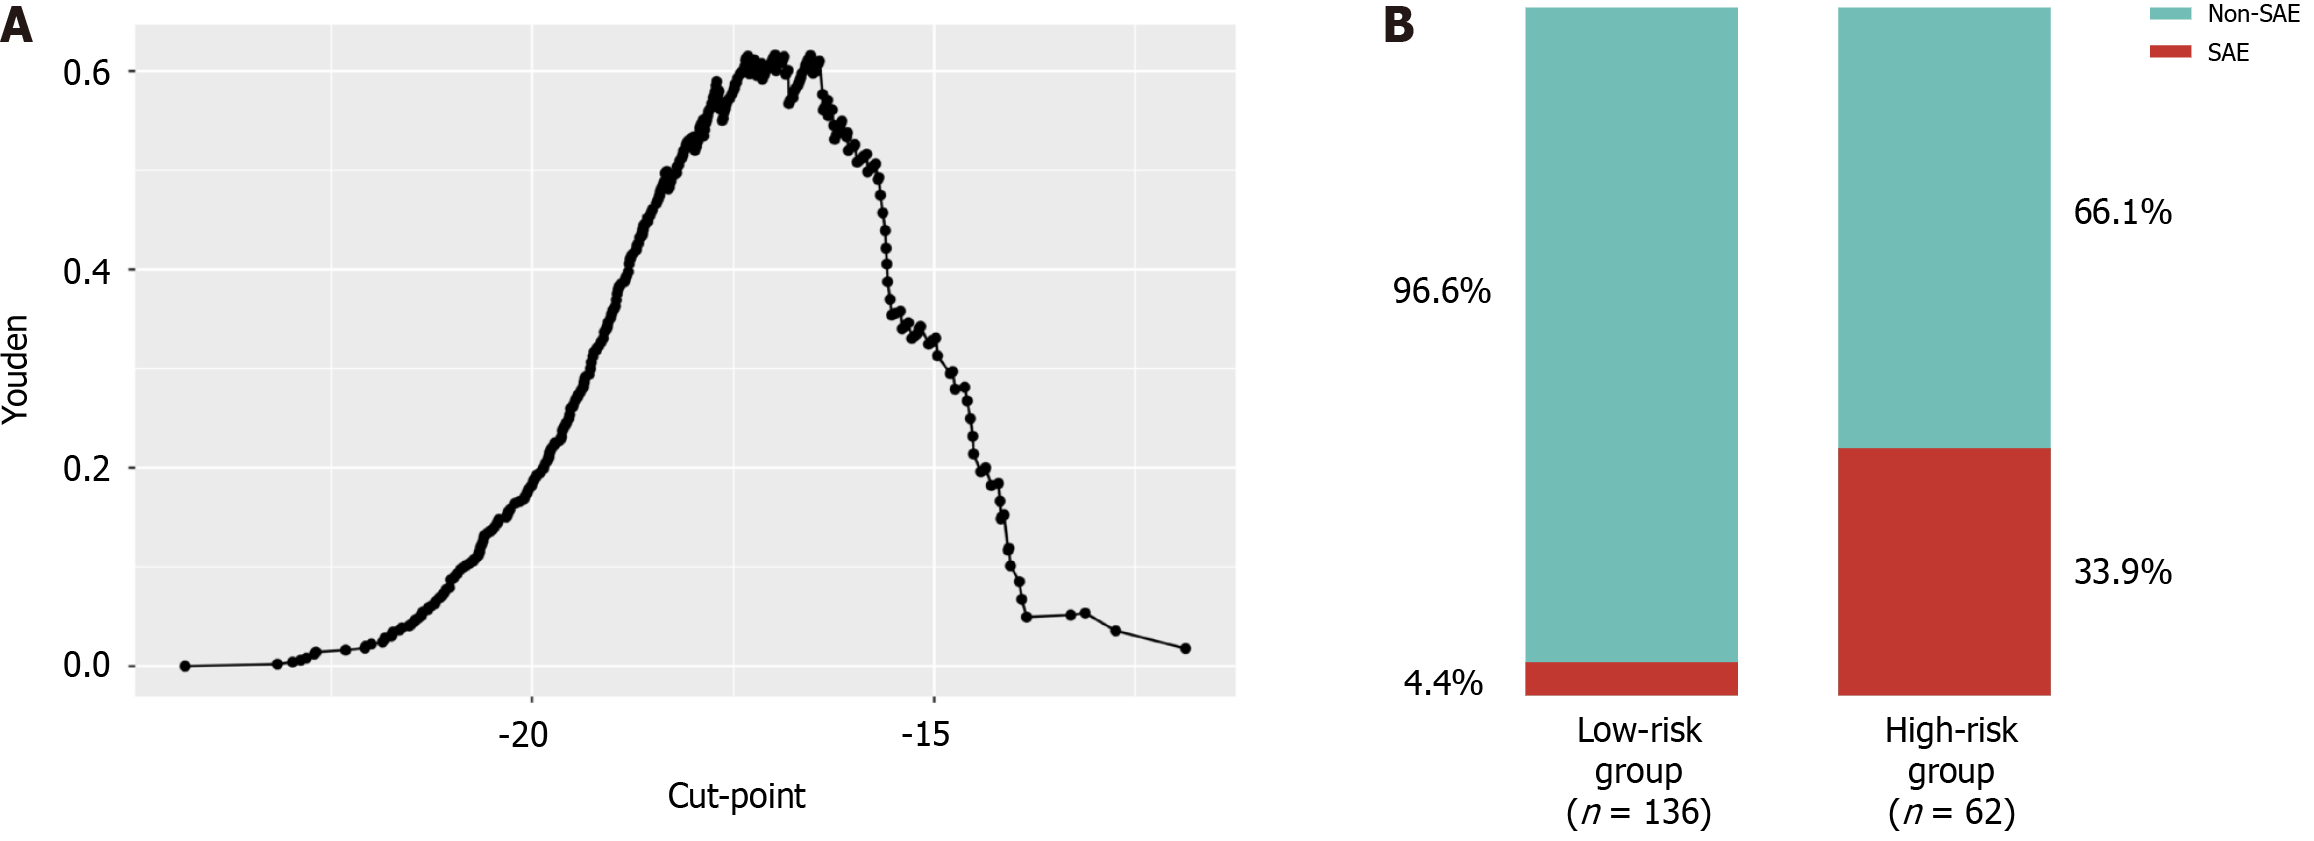
Figure 7 Optimal cut-point stratification validation for risk stratification model.
A: The best cut-point values are 16.98; B: Validation of risk stratification model in validation set. SAE: Severe adverse event.
- Citation: Zhong QH, Huang JS, Guo FL, Wu JY, Yuan MX, Zhu JF, Lin WW, Chen S, Zhang ZY, Lin JB. Prediction and stratification for the surgical adverse events after minimally invasive esophagectomy: A two-center retrospective study. World J Gastroenterol 2025; 31(3): 101041
- URL: https://www.wjgnet.com/1007-9327/full/v31/i3/101041.htm
- DOI: https://dx.doi.org/10.3748/wjg.v31.i3.101041


